Fig. 6.
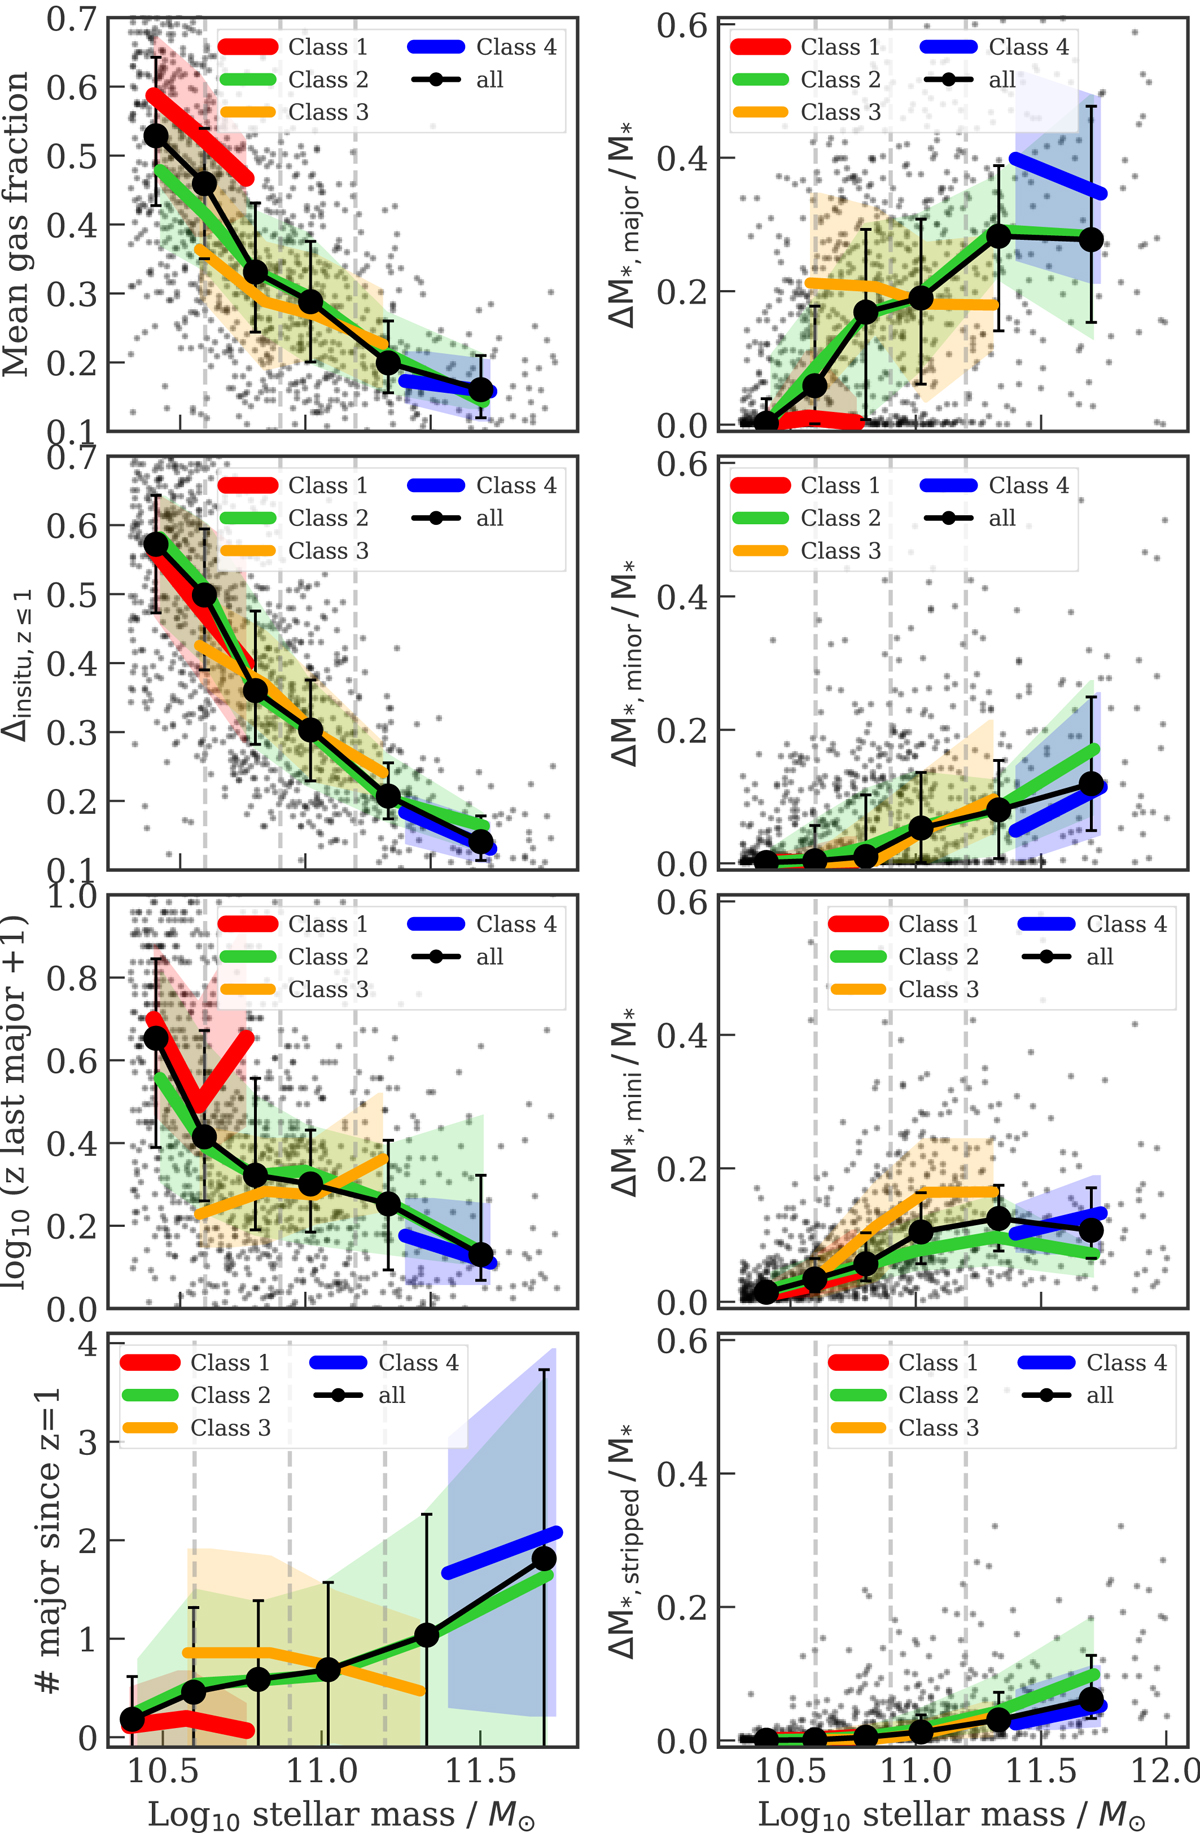
Merger history in different accretion classes. Left: median accretion history parameters as a function of the stellar mass. Right: median mass fractions from different mass ratio mergers and from stripped galaxies as a function of the stellar mass. Shaded regions or error bars show the 25th to 75th percentiles of the distributions. In the bottom left panel (number of major mergers since z = 1) we show mean profiles and standard deviations around the mean. Galaxies are divided into the accretion classes as shown in the legend. The accretion classes defined in Sect. 4.1 are the results of different merger histories.
Current usage metrics show cumulative count of Article Views (full-text article views including HTML views, PDF and ePub downloads, according to the available data) and Abstracts Views on Vision4Press platform.
Data correspond to usage on the plateform after 2015. The current usage metrics is available 48-96 hours after online publication and is updated daily on week days.
Initial download of the metrics may take a while.