Fig. 3.
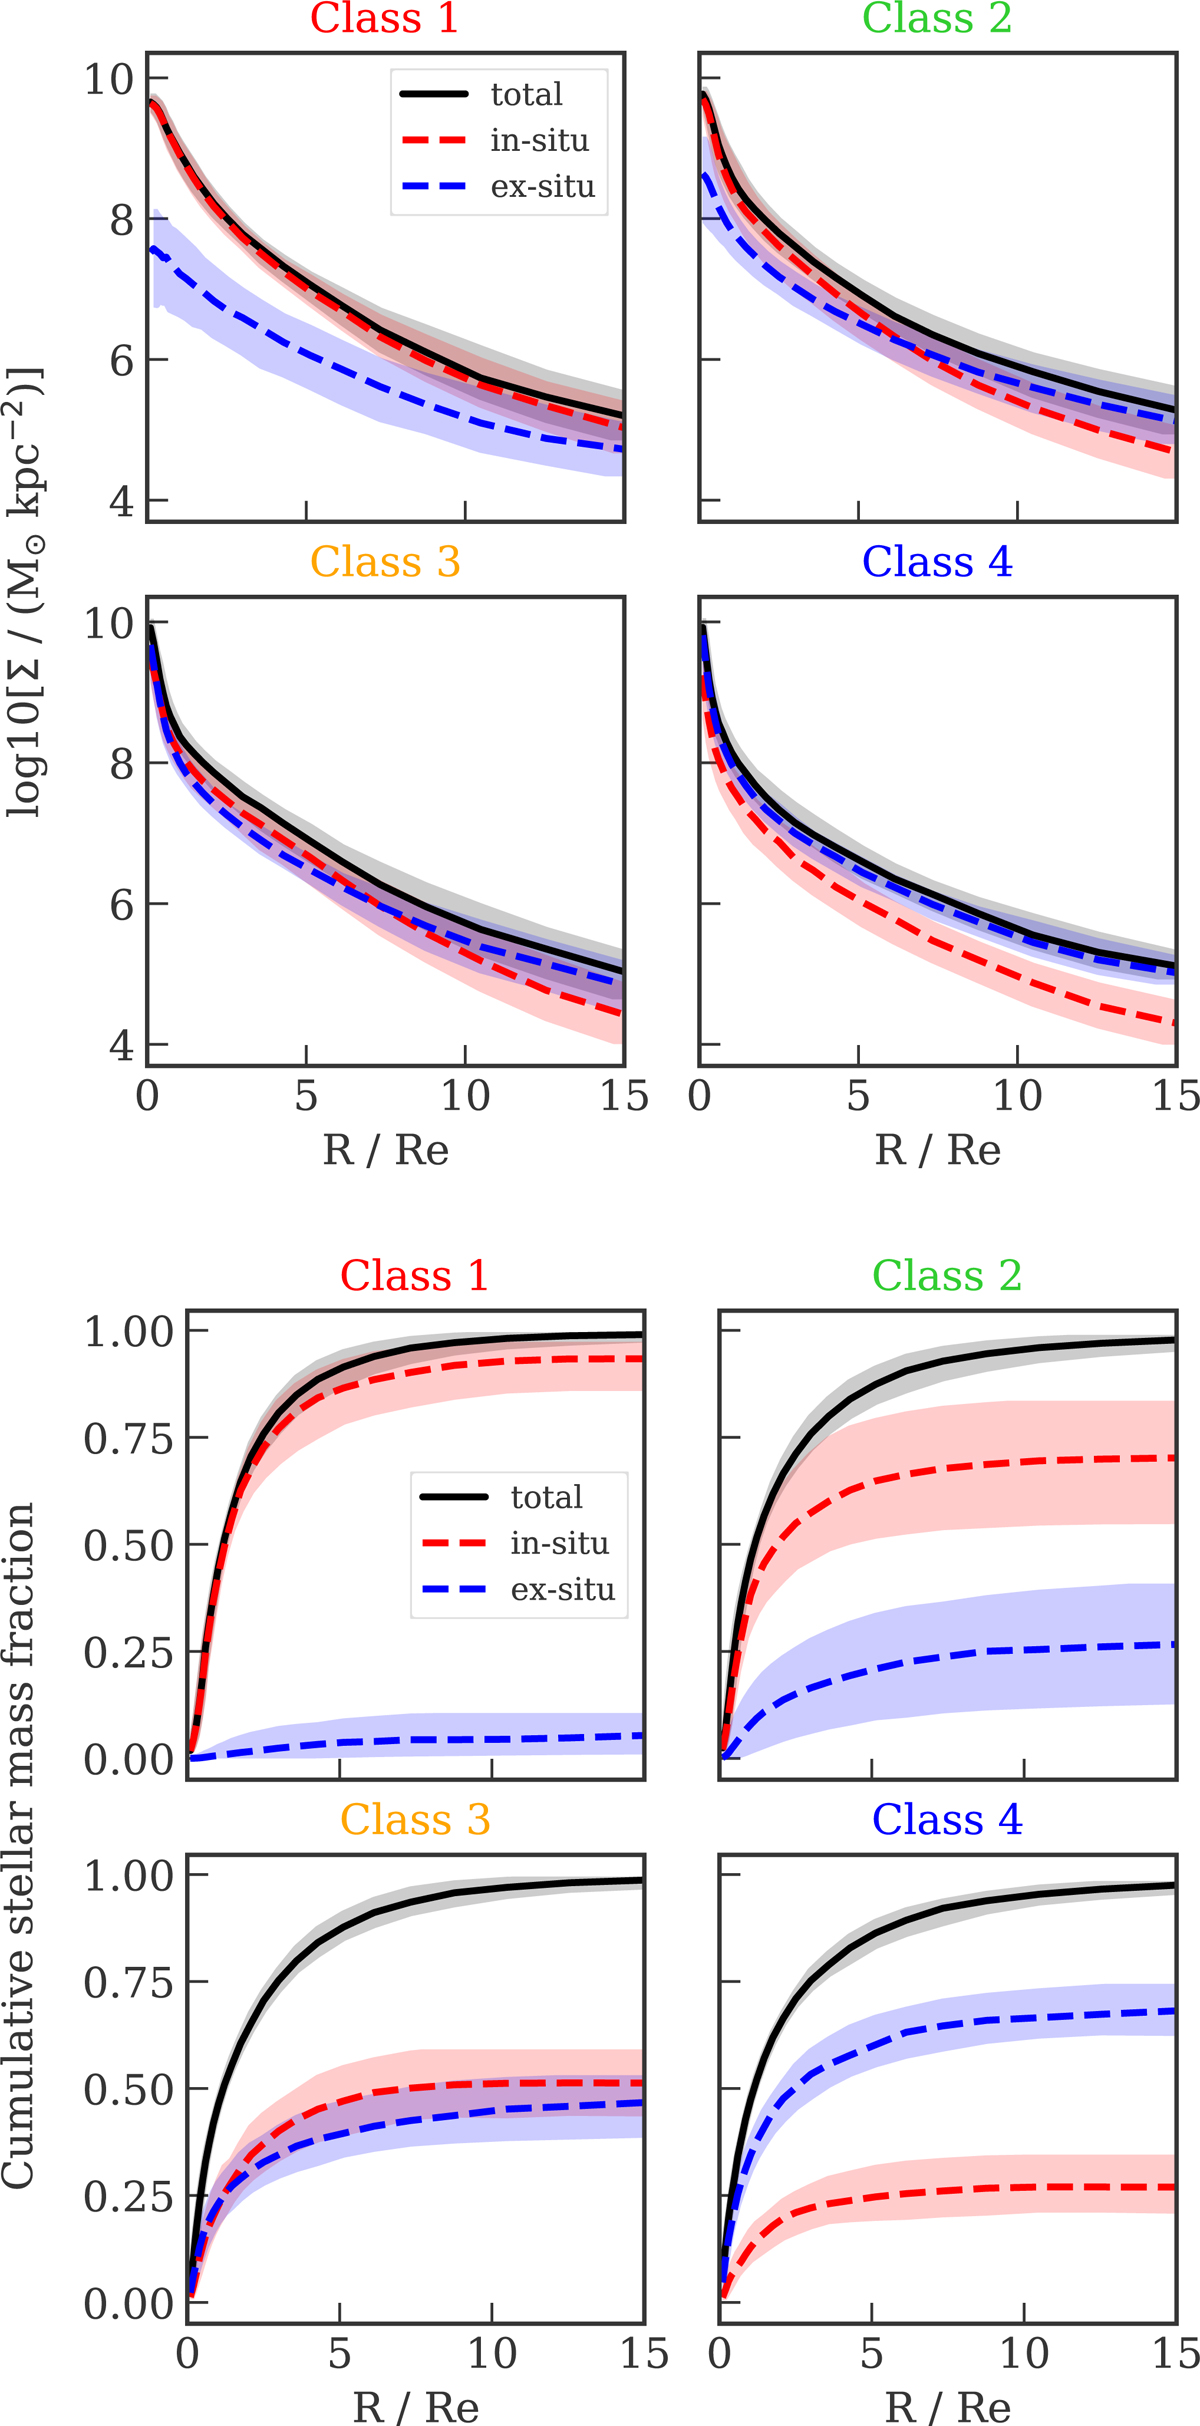
Accretion classes for the simulated sample of ETGs. Top: median stellar-mass-density profiles for each of the four classes defined in Sect. 4.1. The black lines show the median total density profiles, and the red and blue lines show the median density profiles of the in-situ and the ex-situ stars respectively. The shaded regions show the quartiles of the distributions. Bottom: median cumulative stellar-mass-fraction profiles for the in-situ and ex-situ components in the four accretion classes. The shaded regions show the quartiles of the distributions.
Current usage metrics show cumulative count of Article Views (full-text article views including HTML views, PDF and ePub downloads, according to the available data) and Abstracts Views on Vision4Press platform.
Data correspond to usage on the plateform after 2015. The current usage metrics is available 48-96 hours after online publication and is updated daily on week days.
Initial download of the metrics may take a while.