Fig. 8.
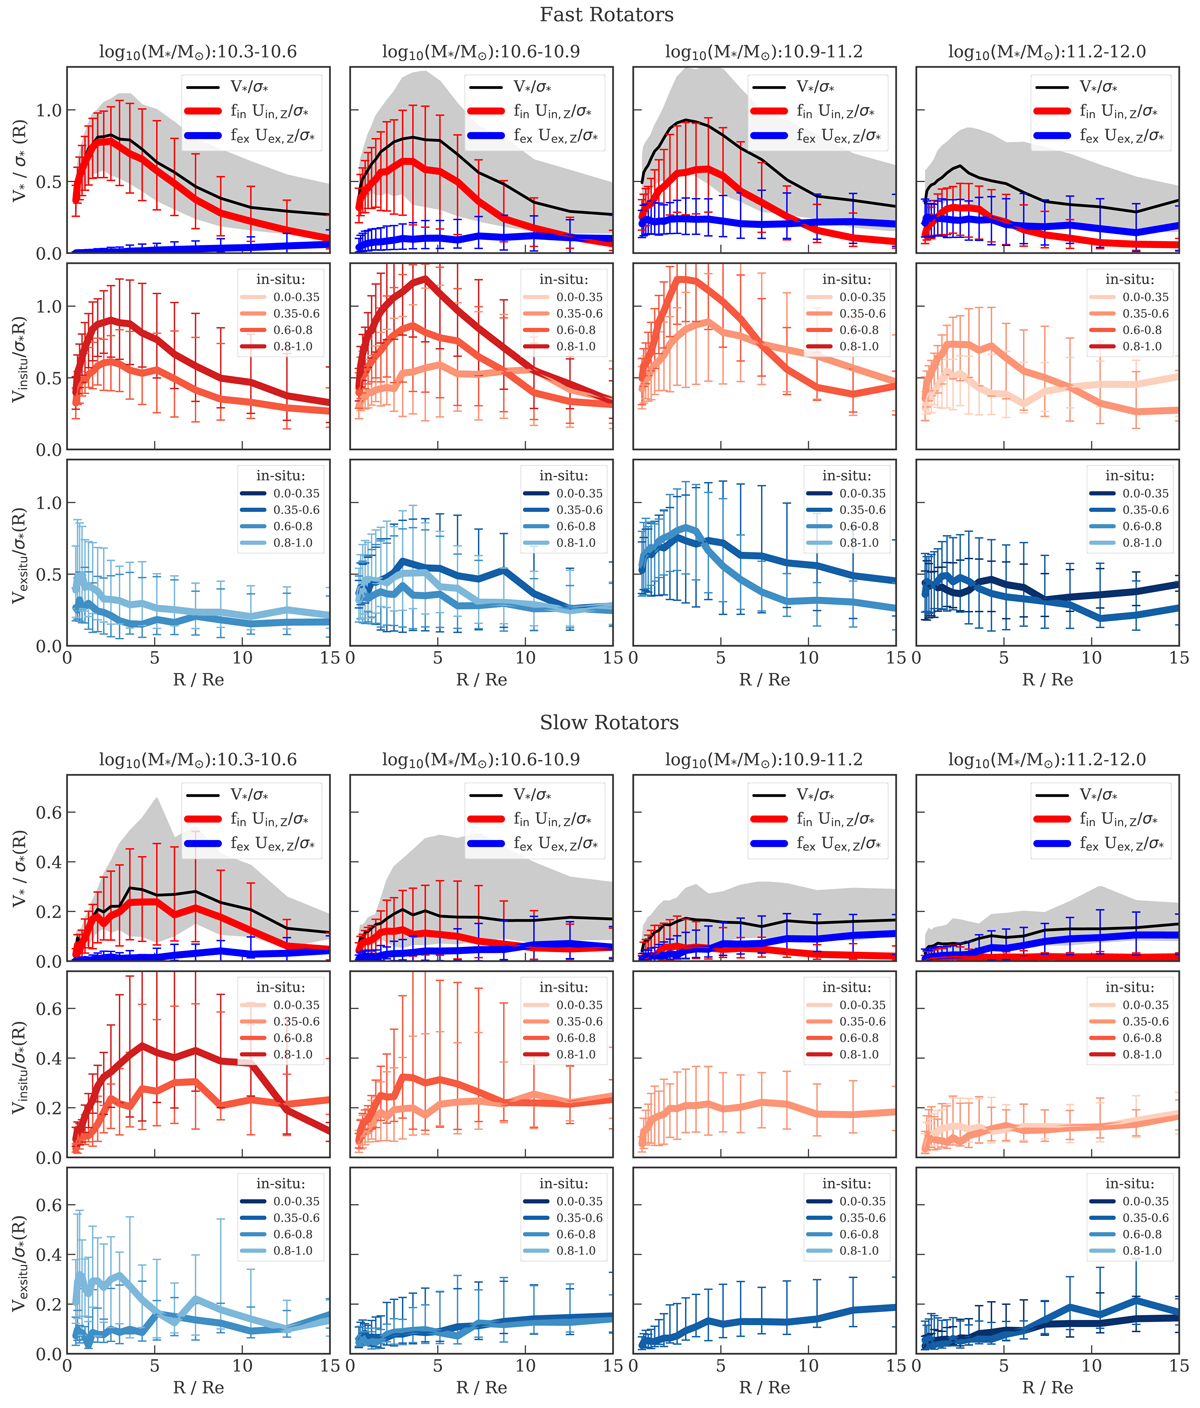
V/σ(R) profiles for the TNG FRs (top panels) and SRs (bottom panels) divided into mass bins. In the two sets of panels, the first rows show the median V*/σ* profiles of all the stars in black. The red and blue curves are the median fi(R)Ui, Z(R)/σ*(R) profiles for the in-situ and ex-situ stars, respectively. The sum of these median profiles approximates the median V*/σ*(R) profiles up to a median absolute difference of 0.02. The middle and bottom rows show the median ![]() profiles of the in-situ and ex-situ components, respectively. Here the galaxies have been divided according to their total in-situ fraction, as shown in the legend. Error-bars and shaded regions trace the quartiles of the distributions. The in-situ stars are characterized by a peaked and outwardly decreasing Vinsitu/σ*(R) profile, while the ex-situ stars typically add a constant level of (subdominant) rotational support.
profiles of the in-situ and ex-situ components, respectively. Here the galaxies have been divided according to their total in-situ fraction, as shown in the legend. Error-bars and shaded regions trace the quartiles of the distributions. The in-situ stars are characterized by a peaked and outwardly decreasing Vinsitu/σ*(R) profile, while the ex-situ stars typically add a constant level of (subdominant) rotational support.
Current usage metrics show cumulative count of Article Views (full-text article views including HTML views, PDF and ePub downloads, according to the available data) and Abstracts Views on Vision4Press platform.
Data correspond to usage on the plateform after 2015. The current usage metrics is available 48-96 hours after online publication and is updated daily on week days.
Initial download of the metrics may take a while.