Fig. 20.
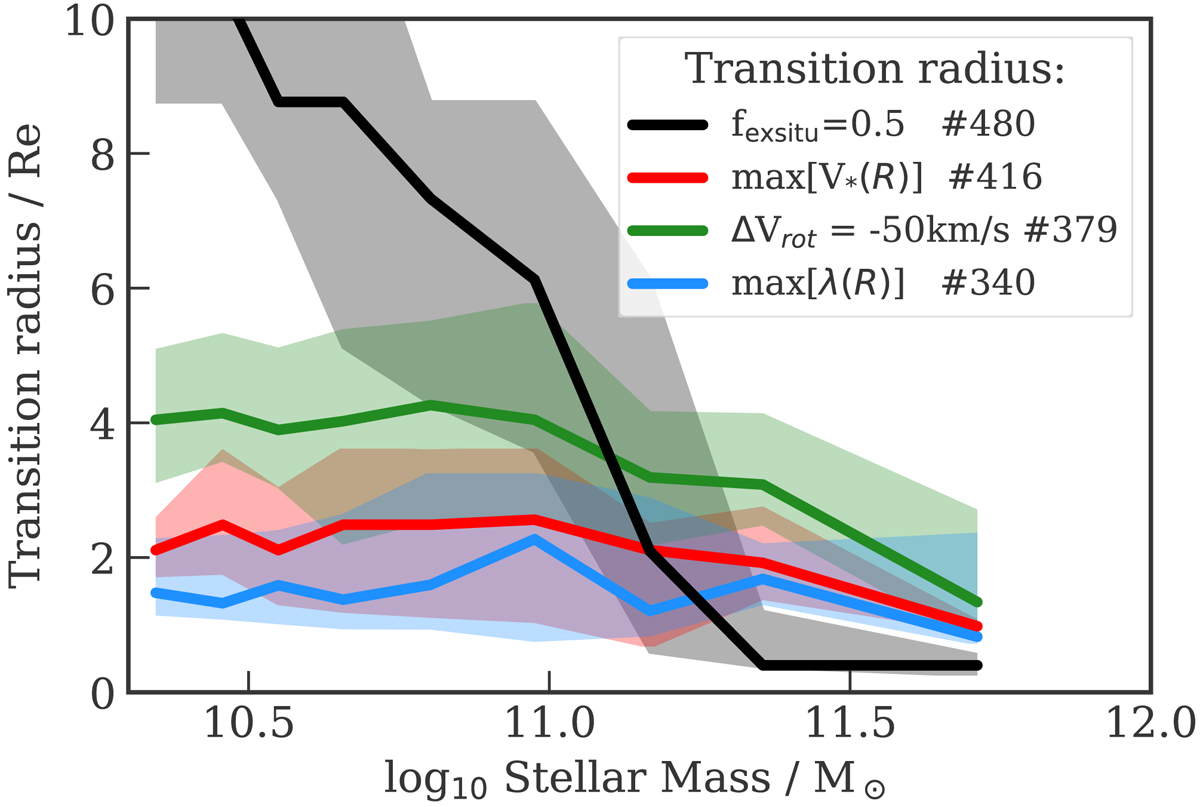
Median TNG100 kinematic transition radii (red, green, and blue solid curves) as a function of galaxy stellar mass, compared with the median transition radius RT, exsitu between in-situ- and ex-situ-dominated regions (black line). All the curves are obtained from FR galaxies of class 2 (see Fig. 3) with well-defined Rexsitu between in-situ-dominated centers and ex-situ-dominated outskirts. The number of galaxies used to produce each curve is reported in the legend.
Current usage metrics show cumulative count of Article Views (full-text article views including HTML views, PDF and ePub downloads, according to the available data) and Abstracts Views on Vision4Press platform.
Data correspond to usage on the plateform after 2015. The current usage metrics is available 48-96 hours after online publication and is updated daily on week days.
Initial download of the metrics may take a while.