| Issue |
A&A
Volume 646, February 2021
|
|
|---|---|---|
| Article Number | A13 | |
| Number of page(s) | 15 | |
| Section | Planets and planetary systems | |
| DOI | https://doi.org/10.1051/0004-6361/202039705 | |
| Published online | 02 February 2021 | |
Planetesimal formation around the snow line
I. Monte Carlo simulations of silicate dust pile-up in a turbulent disk
1
Earth-Life Science Institute, Tokyo Institute of Technology,
Meguro-ku,
Tokyo 152-8550,
Japan
e-mail: This email address is being protected from spambots. You need JavaScript enabled to view it.
2
Laboratoire J.-L. Lagrange, Université Côte d’Azur, Observatoire de la Côte d’Azur, CNRS,
06304 Nice,
France
3
ISAS/JAXA,
Sagamihara,
Kanagawa,
Japan
4
Department of Eartha and Planetary Sciences, Tokyo Institute of Technology,
Meguro-ku,
Tokyo 152-8551,
Japan
5
Steward Observatory/The Lunar and Planetary Laboratory, University of Arizona,
Tucson,
Arizona 85721,
USA
Received:
17
October
2020
Accepted:
24
November
2020
Abstract
Context. The formation of rocky planetesimals is a long-standing problem in planet formation theory. One of the possibilities is that it results from gravitational instability as a result of the pile-up of small silicate dust particles released from sublimating icy pebbles that pass the snow line.
Aims. We want to understand and quantify the role of the water snow line for the formation of rock-rich and ice-rich planetesimals. In this paper, we focus on the formation of rock-rich planetesimals. A companion paper examines the combined formation of both rock-rich and ice-rich planetesimals.
Methods. We developed a new Monte Carlo code to calculate the radial evolution of silicate particles in a turbulent accretion disk, accounting for the back reaction (i.e., inertia) of the particles on their radial drift velocity and diffusion. Results depend in particular on the particle injection width (determined from the radial sublimation width of icy pebbles), the pebble scale height, and the pebble mass flux through the disk. The scale height evolution of the silicate particles, which is the most important factor for the runaway pile-up, is calculated automatically in this Lagrange method.
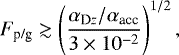
Results. From the numerical results, we derive semi-analytical relations for the scale height of the silicate dust particles and the particle-to-gas density ratio at the midplane, as functions of a pebble-to-gas mass flux ratio and the α parameters for disk gas accretion and vertical/radial diffusion We find that the runaway pile-up of the silicate particles (formation of rocky planetesimals) occurs if the pebble-to-gas mass flux ratio is ≳ [(αDz/αacc)/3 × 10−2]1/2, where αDz and αacc are the α parameters for vertical turbulent diffusion and disk gas accretion.
Key words: planets and satellites: formation / protoplanetary disks
© ESO 2021
1 Introduction
In order for planets to form, micron-sized grains must grow to planetesimal size (i.e., kilometers or more) before they are lost into the central star by gas drag. One possibility is through streaming instabilities (SI), a mechanism to concentrate small solid particles at high enough densities to trigger gravitational collapse (e.g., Youdin & Goodman 2005). A midplane particle-to-gas ratio of order unity is required to trigger strong clumping, but this condition is not easy to achieve, even when considering the most favorable particles, icy pebbles (e.g., Krijt et al. 2016). It is even more difficult to achieve for smaller silicate dust particles, especially when other sources of turbulence are present (Carrera et al. 2015; Yang et al. 2017; Gole et al. 2020).
The role of ice lines, and particularly of the water snow line, has long been recognized as potentially important: the sublimation of pebbles across the snow line leads to an outward diffusion of vapor and recondensation, thus increasing the pebble surface density (e.g., Stevenson & Lunine 1988; Ciesla & Cuzzi 2006; Schoonenberg & Ormel 2017; Drążkowska & Alibert 2017). Recondensation of outwardly diffused water vapor onto pebbles also induces local pebble growth (Ros & Johansen 2013; Schoonenberg & Ormel 2017; Drążkowska & Alibert 2017). The sublimation of icy pebbles changes the ionization rate across the snow line to form a local pressure bump, and the bump could stop the pebble drift there, resulting in their pile-up under favorable disk conditions (Kretke & Lin 2007; Brauer et al. 2008; Ida & Lin 2008). These mechanisms potentially lead to the formation of ice-rich planetesimals1. However, in the present work, our aim is to show that the sublimation of icy pebbles can also result in the formation of silicate-rich (rocky) planetesimals inside the snow line.
Many small silicate dust particles that are released by the sublimation of individual icy pebbles are coupled with disk gas (Sect. 2.4). Because incoming icy pebbles drift by gas drag quickly, and pebbles are supplied with a relatively high flux, the silicate dust particles can also pile up inside the snow line, potentially leading to the conditions for a formation of silicate-rich planetesimals by direct gravitational instability (Saito & Sirono 2011; Ida & Guillot 2016). Determining the reality of the processes and their relative contributions is of course crucial to understanding the formation of planetesimals, the composition of planets, and ultimately to accounting for the global ice-to-rock ratio in the Solar System (see Kunitomo et al. 2018).
This pile-up process has been addressed in past literature (Ida & Guillot 2016; Schoonenberg & Ormel 2017; Drążkowska & Alibert 2017; Hyodo et al. 2019). However, they lead to different, seemingly contradictory, results. In order to examine the problem from a new angle, we developed two tools. The first one is a 2D (r-z) Monte Carlo code to simulate the pile-up of small silicate particles injected from sublimating icy pebbles in a turbulent protoplanetary disk. We then used the Lagrangian advection-diffusion method by Ciesla (2010, 2011) with our new addition of the back-reaction to the radial velocity and diffusion of the silicate particles. The second one is a 1D diffusion-advection grid simulation based on the work of Schoonenberg & Ormel (2017), as updated by Hyodo et al. (2019), and including input results obtained from our Monte Carlo code. These tools enable us to study the fate of silicate dust particles and icy pebbles in a wide range of conditions, including the possibilities that turbulent mixing may differ in the radial and vertical directions (Zhu et al. 2015; Yang et al. 2018).
We first focused on the 2D Monte Carlo code and its results. In a companion paper (Paper II), we apply the results to the diffusion-advection simulation, allowing us to include the formation of both silicate-rich and water-rich planetesimals. We intend to consider the case of complex protoplanetary disk models in a third paper.
The present article is organized as follows. In Sect. 2, we summarize the results of Ida & Guillot (2016), Schoonenberg & Ormel (2017), and Hyodo et al. (2019), focusing on the silicate dust particle pile-up near the snow line. In Sect. 3, we describe our Monte Carlo simulation code. In Sect. 4, after testing our simulations, we present our results and derive semi-analytical relations for the silicate dust scale height and the pile-up. We conclude in Sect. 5.
2 Previous studies and an analytical solution
2.1 Setting
The outskirts of protoplanetary disks are a large reservoir of condensed particles, initially in the form of submicron-sized particles. Their progressive growth and drift due to gas drag (Adachi et al. 1976; Weidenschilling 1977) can lead to a wave of “pebbles”, that is, centimeter- to meter-sized particles that drift rapidly inward from the outer to the inner regions of the disk (e.g. Garaud 2007; Lambrechts et al. 2014). The mass flux of incoming pebbles relative to the gas mass flux can be significantly above the standard value of ~ 1∕100, which is realized for the mass flux of micron-dust dust particles. For example, Appelgren et al. (2020) find that a decrease in the drift rate of pebbles from the outer to the inner region can lead to a ~ 4 times increase in the dust-to-gas ratio. Similarly, Mousis et al. (2019) obtain an enrichment factor of the inner disk in volatiles that can reach ~20 to 30.
The values of Fp/g, the ratio of the mass flux of pebbles Ṁp to that of the gas Ṁg, depend on the disk models and underlying assumptions on particle growth. Using 2D simulations of the formation of a protoplanetary disk from the collapse of a molecular cloud core, Elbakyan et al. (2020) obtained a highly time-dependent Fp/g that is shaped bythe perturbations of the disk, as exemplified in Fig. 1. The high values, much beyond the canonical value (~ 1∕100) are therefore possible during the time-variation in each disk, either as a progressive increase during the later evolution phases of the disk (Garaud 2007; Mousis et al. 2019; Appelgren et al. 2020), or as short pulses (Elbakyan et al. 2020), presumably due to the sudden release of pebbles.
Given the possible presence of such a pebble flux, Saito & Sirono (2011) had pointed out that small silicate dust particles released by incoming icy pebbles would pile up, potentially leading to the conditions for a direct gravitational collapse of the dust sub-disk. However, they had assumed a stationary disk without inward-gas accretion through the disk and radial and vertical diffusion. Our goal is to understand, depending on the value of Fp/g, whether planetesimals may indeed form from such a pile-up.
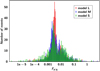 |
Fig. 1 Histogram of the time-dependent values of Fp/g ≡Ṁp∕Ṁg, the ratio of the pebble to gas mass flux at the inner boundary of three protoplanetary disks (models L, M and S, respectively) from Elbakyan et al. (2020). For this setting, irregularities in the radial and azimuthal structures of the disks yield a highly time-dependent Fp/g value. |
2.2 A comparison of previous studies
Several studies have thus far considered the problem in the framework of an evolving accretion disk. Using an analytical approach, Ida & Guillot (2016) found that even though the disk gas accretion tends to smooth out the radial distribution of silicate dust particles, a runaway pile-up may be achieved because of the back reaction to inward drift of the particles, that is, the slowing down of the radial drift of the silicate particles due to the increasing inertia of the piled-up particles. They derived a simple analytical criterion linking the critical pebble-to-gas mass flux ratio for runaway pile-up to a ratio between the dust-to-gas scale height and the fraction of dust contained by icy pebbles (Sects. 2.3 and 4.1.2). Because Ida & Guillot (2016) assumed that the scale heights of silicate particles are similar to those of incoming icy pebbles (i.e., much smaller than the disk’s gas scale height), and neglected radial and vertical turbulent diffusion, their critical pebble accretion flux corresponds to the most favorable limit to pile up silicate dust particles and form rock-rich planetesimals by gravitational instability.
Schoonenberg & Ormel (2017) performed detailed 1D diffusion-advection simulations of gas and icy pebbles with an Eulerian grid code to study pile-ups of the icy pebbles in an accretion disk, taking account of the back reaction to their drift velocity, sublimation process, and both radial and vertical turbulent diffusion. Near the snow line, re-condensation of water vapor diffused from the region inside the snow line enhances the ice surface density. For icy pebbles with Stokes numbers of 10−2 −1, SI can occur for the solid-to-gas surface density ratio ZΣ ≳ 0.02−0.03 (Johansen et al. 2009; Carrera et al. 2015; Yang et al. 2017). They found that the ice surface density is enhanced by a factor of several by the recycling process in the case of relatively vigorous turbulence (α ~ 10−3−10−2) and a relatively high pebble-to-gas mass accretion rate (Fp/g ~ 0.8).
Schoonenberg & Ormel (2017) also calculated the radial distribution of silicate particles released from drifting pebbles inside the snow line. However, because they were focusing on the pebbles’ SI, they did not consider the back reaction to the radial drift velocity of the silicate particles. They also assumed immediate turbulent stirring such that the scale height of silicate particles is the same as the disk’s gas scale height. As a result, they did not find a runaway pile-up of the silicate particles (for details, see Sects. 2.3 and 4.1.2).
Hyodo et al. (2019) updated Schoonenberg & Ormel (2017)’s 1D diffusion-advection grid simulations, adding the back reactions to radial drift and diffusion of silicate particles. They also considered the evolution of the scale height of silicate dust particles. When the silicate particles are released from icy pebbles passing the snow line, their scale height is similar to that of icy pebbles. It is gradually increased by the vertical turbulent diffusion. Hyodo et al. (2019) analytically modeled the dust scale height evolution and incorporated the model into the grid simulation. They treated the diffusion α-parameter and the effective α-parameter for the disk accretion independently. The turbulent mixing and the angular momentum transfer can be different mechanisms. For example, the angular momentum transfer of the disk can be dominated by a process other than radial turbulent diffusion such as disk winds (e.g., Suzuki et al. 2016; Bai et al. 2016). Therefore, it is reasonable to distinguish between the diffusion and the accretion α-parameters. They identified the parameter regions of the runaway pile-up of the silicate particles on the plane of the pebble mass flux and the diffusion α-parameter.
As Ida & Guillot (2016) suggested, the silicate particle pile-up condition depends directly on their scale height. Hyodo et al. (2019) estimated the scale height evolution only by accounting for vertical diffusion, and not taking radial diffusion into account.
2.3 Analytical derivation
As we described in Sect. 1, we assume that icy pebbles consist of a large number of small silicate particles covered by icy mantles. When the pebbles drift inward and pass the snow line, the icy mantles are sublimated, and consequently the small silicate particles are released. We set the Stokes number of icy pebbles to be τs,p = 0.1, which is relevant to the Epstein regime (Okuzumi et al. 2012; Ida et al. 2016), and that of silicate particles is τs,d ≪ 1, where the Stokes number is defined by the stopping time due to gas drag tstop and Keplerian frequency ΩK as τs= tstopΩK. The notations we use here are summarized in Table 1.
We consider a steady accretion disk. We show that our formulation and the results are scaled by the pebble-to-gas mass flux ratio, and we do not need to specify the magnitude of the disk’s gas accretion rate. Actually, the pebble mass flux through the disk (Ṁp) is proportional to the disk’s gas accretion rate (Ṁg) in the case of the steady accretion before the pebble formation front reaches the disk’s outer edge (Ida et al. 2016). Kanagawa et al. (2017) pointed out that the vertically averaged disk gas flow can be outward, when Ṁp is so large that the advective angular momentum carried by pebbles dominates over the viscous angular momentum transfer. In that case, the steady accretion disk model breaks down. However, as we show in Appendix A, such a situation is not realized in the parameter range we cover in this paper.
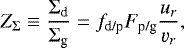
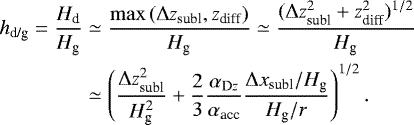
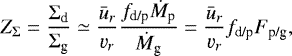
Firstly, we derived the vertically averaged solid-to-gas mass ratio (metallicity), inside the snow line. In this paper, the subscripts, “g”,“p”, and “d” represent the disk’s H-He gas, icy pebbles, and silicate dustparticles, respectively. In the steady state, the surface density of the silicate dust particles Σd and the disk gas Σg are given by

where vr and ur are the drift velocity of the silicate particles and the gas accretion velocity, and fd/p is the silicate dust mass fraction in the icy pebbles. We adopted fd/p = 0.5 as a nominal value. The vertically averaged metallicity is
 (3)
(3)
where
 (4)
(4)
We also used the local solid-to-gas ratio defined by
 (5)
(5)
where ρg and ρd are the local densities of gas and silicate dust particles.
The radial drift velocity of the particles and disk gas is given by Ida & Guillot (2016) and Schoonenberg & Ormel (2017):
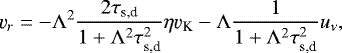 (6)
(6)
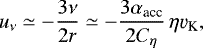
where vK is Keplerian velocity, τs,d is the Stokes number of the particles, and η is the degree of deviation of the gas rotation angular velocity (Ω) from Keplerian one (ΩK), given by

where Cη = 1.3−1.4, depending on the disk structure (Ida et al. 2016). We used Cη = 11∕8 for Σg ∝ r−1 and T ∝ r−1∕2 in this paper. In the above equation, uν is an unperturbed disk gas accretion (advection) velocity given by
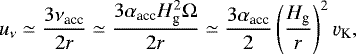 (9)
(9)
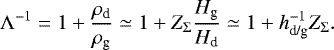
where νacc is the effective viscosity for the angular momentum transfer of the disk gas, Hg is the disk gas scale height, and uν is defined to be positive for inward flow. The effect of back reaction from the piled-up particles is represented by Λ, which is defined by
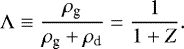 (10)
(10)
Because  , where Hd is the scale hight of the silicate dust particles, and
  , Eq. (10) for z < Hd is approximated for the particle motion by
 (11)
(11)
We define the scale height ratio:
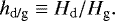 (12)
(12)
In the case of silicate particle pile-up due to the sublimation of icy pebbles, the pile-up is radially localized just inside of the snow line. If we apply Eq. (A.2), the gas accretion velocity (ur) is locally slowed down from uν by the back reaction to the gas motion. If the steady accretion with constant αacc is assumed, the gas surface density given by Eq. (2) is increased locally. However, in reality, the assumption for vertically constant αacc may be broken down in that case, or some local instability may smooth out the local gas concentration. Therefore, we assumed that ur ≃ uν also in the silicate dust pile-up region. Even if we take account of the back reaction to the gas motion, the condition for the runaway pile-up of the silicate dust particles does not change significantly, as shown below and in Appendix A.
Because τs,d ≪ 1, silicate particle motions are strongly coupled with disk gas, but the back reaction to the drift velocity of the silicate particles must be be taken into account. Equation (6) with τs,d ≪ 1 implies vr ≃ Λuν. Substituting ur ≃ uν, vr ≃ Λuν, and Eq. (11) into Eq. (3), we obtain
 (13)
(13)
which issolved as (Ida & Guillot 2016)
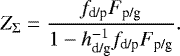 (14)
(14)
The midplane Z = ρd∕ρg is given by
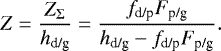 (15)
(15)
If we consider the back reaction to gas motion, the divergence condition is only slightly modified to (see Appendix A)
 (16)
(16)
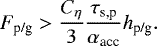
The metallicity Z diverges, which would lead to rocky planetesimal formation, for
![Mathematical equation: \begin{align*} F_{\textrm{p/g}} & > \frac{h_{\textrm{d/g}}}{ f_{\textrm{d/p}}} \hspace{0.5cm} [\mbox{w/o the back reaction to gas}], \\ F_{\textrm{p/g}} & > \frac{h_{\textrm{d/g}}}{(1-h_{\textrm{p/g}}) f_{\textrm{d/p}}} \hspace{0.5cm} [\mbox{w/ the back reaction to gas}].\end{align*}](/articles/aa/full_html/2021/02/aa39705-20/aa39705-20-eq18.png)
The former condition was derived by Ida & Guillot (2016). We mostly refer to the former condition.
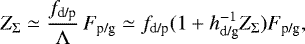
Schoonenberg & Ormel (2017) neglected the back reaction to the silicate dust drift velocity and assumed Λ =1 in Eq. (13). In this case, Eq. (13) is reduced to ZΣ ≃ fd/pFp/g, which showsno divergence. This demonstrates that the back reaction to the silicate particle radial velocity plays an essential role in the occurrence of the runaway pile-up.
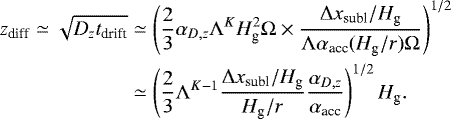
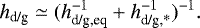
In the runaway pile-up condition, 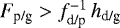 , the estimation of Hd is very important. The scale height of pebbles (Hp) is given with their Stokes number, τs,p, and the vertical mixing parameter αDz as (Dubrulle et al. 1995; Youdin & Lithwick 2007)
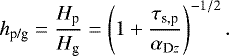 (19)
(19)
We discuss the increase of Hp by Kelvin-Helmholtz instability for the vertical shear due to pile-up of particles in Paper II.
The scale height of silicate dust particles (Hd) must be the same as Hp just after the release from the icy pebbles. Because τs,d ≪ τs,p, Hd is increased by the vertical turbulent stirring afterward. Ida & Guillot (2016) assumed that Hd ≃ Hp (hd/g = hp/g) until the runaway pile-up develops. For hd/g ~ 0.1 (τs,peb∕αDz ~ 102) and fd/p ~ 0.5, the optimistic estimate by Eq. (15) predicts that the runaway pile-up occurs for Fp/g > 0.2, which would be available for relatively early phase of disk evolution.
On the other hand, Schoonenberg & Ormel (2017) assumed immediate vertical stirring by turbulence, that is, Hd ≃ Hg (hd/g ≃ 1). Because they neglected the back reaction to vr, they never found the runway pile-up in their simulations. Even if we apply Eq. (15), which was derived with the back reaction, for the case of hd/g ≃ 1 and fd/p ~ 0.5, the runaway pile-up condition is Fp/g > 2. The high value of Fp/g may not be completely ruled out, but it is not easily established (Ida & Guillot 2016, and see Fig. 1 in this paper).
Hyodo et al. (2019) treated the effects of the vertical and radial diffusion more carefully. They considered the vertical stirring characterized by αDz to derive a model for hd/g as a function of x = r − rsnow. They also introduced the back reaction to the diffusion coefficients Dr and Dz by the pile-up of the particles, such that

A simple argument that  (Laibe & Price 2014; Lin & Youdin 2017) suggests K = 1. Another argument is based on Kolmogorov theory (e.g., Cho et al. 2003). In the eddy cascade, the energy transfer rate,
  is independent of ℓ, where ℓ, vℓ, and teddy are the eddy size, velocity, and turnover time ~ℓ∕vℓ. Because Dz, Dr ~ ℓ0vℓ0 where ℓ0 and vℓ0 are the eddy size and velocity controlling the turbulence,
 ![Mathematical equation: $D_z, D_r \propto \ell_0 \,[\ell_0/(\rho_{\textrm{g}} + \rho_{\textrm{d}})]^{1/3} \propto \Lambda^{1/3}$](/articles/aa/full_html/2021/02/aa39705-20/aa39705-20-eq24.png) . This argument thus implies K = 1∕3. This should be a lower limit because an increase in the solid-to-gas is expected to suppress turbulence itself. Given these uncertainties, Hyodo et al. (2019) performed runs with K = 0, 1, and 2. They found that the runaway pile-up is caused by inclusion of the back reaction to vr, and that the condition for the runaway pile-up depends on the relations among αacc, αD r, and αD z, while Ida & Guillot (2016) considered the limits of αDr, αDz → 0 and their condition, Eq. (15), does not include αacc. The condition derived by Hyodo et al. (2019) is more severe than the prediction by Ida & Guillot (2016). The runaway pile-up occurs for Fp/g > 0.2−0.3, and αD r = αDz ≃ 10−3 in the case of K = 1 and 2 with αacc = 10−2, while it does not occur with K = 0 as long as it is in the parameter space of αDr = αDz = 10−3−10−2 and Fp/g < 0.6. In this paper, we show this back-reaction effect on the diffusion coefficients more clearly.
. This argument thus implies K = 1∕3. This should be a lower limit because an increase in the solid-to-gas is expected to suppress turbulence itself. Given these uncertainties, Hyodo et al. (2019) performed runs with K = 0, 1, and 2. They found that the runaway pile-up is caused by inclusion of the back reaction to vr, and that the condition for the runaway pile-up depends on the relations among αacc, αD r, and αD z, while Ida & Guillot (2016) considered the limits of αDr, αDz → 0 and their condition, Eq. (15), does not include αacc. The condition derived by Hyodo et al. (2019) is more severe than the prediction by Ida & Guillot (2016). The runaway pile-up occurs for Fp/g > 0.2−0.3, and αD r = αDz ≃ 10−3 in the case of K = 1 and 2 with αacc = 10−2, while it does not occur with K = 0 as long as it is in the parameter space of αDr = αDz = 10−3−10−2 and Fp/g < 0.6. In this paper, we show this back-reaction effect on the diffusion coefficients more clearly.
Notations.
2.4 Stokes number of silicate particles
The models discussed thus far and the model that we present are based on the assumption that many silicate dust particles released by the individual icy pebbles remain small compared to pebbles (i.e., with a Stokes number that is much smaller than unity). In this case, the radial drift is much faster for icy pebbles than for silicate particles. Because the gas accretion velocity is given by 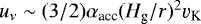 (Eq. (9)) and the drift speed relative to the gas is given by
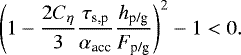
  (Eq. (6)), the total drift velocity is dominated by uν if τs,d ≲ αacc. Therefore, the assumption here is expressed as τs,d ≲ αacc < τs,p.
In Sect. 2.3, we assume that τs,p ~ 0.1, αacc ~ 10−3−10−2, and τs,d ≲ αacc. Saito & Sirono (2011) assumed that many μm-sized silicate particles are embedded in pebbles. Morbidelli et al. (2015) considered chondrule-sized (~mm) particles. Because the Stokes number is proportional to the particle size in the Epstein regime and its square in the Stokes regime, it is reasonable to assume that τs,d < αacc. This model corresponds to the “many-seeds model” of Schoonenberg & Ormel (2017). In the Monte Carlo simulations here, we adopt τs,d = 10−5.
In the silicate particle pile-up region, the particles may quickly grow up to sizes determined by the threshold collision velocity for fragmentation/rebound. The collision velocity is set by the velocity dispersion induced by the turbulence,  or by the drift velocity difference between the particles ~ 2τs,d η vK (e.g., Sato et al. 2016). The collision velocity between silicate particles is therefore
  times that between icy pebbles. If the threshold collision velocity is ten times lower for the silicate particles than for the icy particles (Blum & Wurm 2000; Zsom et al. 2010, 2011; Wada et al. 2011, 2013; Weidling et al. 2012) and τp,d ~ 0.1 is close to the fragmentation/rebound barrier for ice, the silicate particles can grow only up to τs,d ~ (10−1–10−2)τs,p ~ 10−3–10−2 in size. Therefore, for αacc = 10−3–10−2, the drift velocity of the silicate particles is comparable to uν and the pile-up would not be significantly affected by the value of τs,d.
We note that this conventional view has been challenged recently (Kimura et al. 2015; Gundlach et al. 2018; Musiolik & Wurm 2019; Steinpilz et al. 2019). A higher fragmentation threshold for silicates would open the possibility for dust to coagulate and grow. We hence performed runs with larger values of τs,d to find that the results are not affected for τs,d ≲ αacc and that the runaway pile-up region is removed from lower Fp/g regions as τs,d becomes larger.
Our model hence remains valid if the fragmentation velocity for rock-rich dust remains smaller than for ice. We also note that an exploration of the consequence of a different change of fragmentation velocity across ice lines was explored by Vericel & Gonzalez (2019) (see also Gonzalez et al. 2017). In this case, planetesimal formation may still be possible, but through a slow-down of the drift rate due to the gas back reaction and to a progressive growth of the particles.
3 The Monte Carlo approach
In order to model precisely the effects of drift due to gas drag, gas advection, radial and vertical diffusion, we developed a Monte Carlo simulation of silicate dust particles in a turbulent accretion disk. The dust particles released from sublimating icy pebbles are injected near the snow line. The back reactions to vr and the diffusion of the particles are included using the super-particle approximation. We set radial and vertical coordinates, (x, z), where x ≡ r − rsnow is the radial distance from the snow line at rsnow and z is the distance from the midplane.
We considered a radially local region near the snow line and neglected the r-dependence of the Keplerian frequency (Ω) and the disk’s gas scale height (Hg). As discussed in Sect. 2.4, we adopted the conventional view to set τs,p = 0.1 and τs,d = 10−5 in our simulations.
3.1 Injection of particles
To model the release from drifting icy pebbles due to sublimation, at each time step δt, we randomly injected a new silicate super-particle with mass m with a radially uniform distribution near the snow line in the − 0.5Δxsubl < x < 0.5Δxsubl range, and a Gaussian distribution of z of the root mean square Δzsubl as

where  is a random number in the range of [−1, 1], Δxsubl is the characteristic sublimation radial length, and Δzsubl corresponds to the scale height of theincoming icy pebbles, Hp, given by Eq. (19). We adopted Δxsubl = 0.1Hg as a nominal case. In Sect. 4.4.2, we also consider a more complicated function that fits the numerical result of the grid code simulation obtained by Paper II.
Here, we distinguish the effective viscosity parameters for advection, radial mixing, and vertical mixing, denoted by αacc, αD r, and αD z, respectively. According to different values of αDz, we used the consistent value of the scale height of the injected silicate particles given by Eq. (19). Although Hasegawa et al. (2017) suggested αDr, αDz ~ 0.1 αacc, the relations among αDr, αDz and αacc are not clear (e.g., Armitage et al. 2013). Therefore, we surveyed broad parameter ranges of αD r, αDz and αacc; we mostly show the results with αacc ≥ αDr = αDz. In some cases, the results with αDr≠αDz (αacc ≥ αDr, αDz) are also shown.
3.2 Advection and diffusion
At each time step δt, we changed the r–z locations of the particles that were injected before, following Ciesla (2010, 2011), by

where the first and second terms on the right-hand side represent advection (drift) and diffusion, respectively. The root mean square of  is
is  . In our simulations, we adopted δt = Ω−1. Fromang & Papaloizou (2006) suggested a turbulent correlation time in a protoplaneatry disk is ~ 0.15TK ~ Ω−1. Ciesla (2011) adopted planar (x–y) random walks, in addition to a vertical one (z), to take account of the global curvature effect. In our case, because we only considered a local radial range, we simply adopted r–z random walks.
We performed runs with K = 0 and K =1 for the diffusion coefficients (Eqs. (20) and (21)), with K = 1 being our nominal case. We also performed runs with K = 1∕3 (the lower limit) and found that the overall features of the results do not depend on the value of K (only the runaway pile-up timescale is different), as long as the back reaction to diffusion is considered (i.e., K > 0). Hereafter, we show the results with K = 1 as representative of the cases including a back reaction to diffusion.
The radial drift (advection) velocity vadv,r is the same as vr in Eq. (6). The vertical advection velocity is (Ciesla 2010)
 (26)
(26)
The first term (∝ αDz) comes from the effect of diffusion smoothing the concentration (ρd∕ρg) but not ρd itself.
3.3 Inclusion of back reaction effects
The advection and diffusion scheme was originally developed by Ciesla (2010, 2011). Here, we also include the effects of back reaction due to the silicate particle pile-up as well as a scheme to model the injection of silicate particles from sublimating icy pebbles.
We utilized the “super-particle” method, where one super-particle represents the mass of a large number of particles while it suffers the same specific drag force as the individual particles. We injected one super-particle at every time step δt = Ω−1. For given Ṁp, we can determine the individual mass of the super-particles as
 (27)
(27)
where fd/p is a silicate fraction in migratingpebbles (fd/p = 0.5 in the nominal case). To locally average the silicate dust mass density, we used linear grids, Δx and Δz. In the nominal cases, we adopted Δx = 0.1 Hg. We used Δz ~ Δzsubl near the midplane and larger Δz for upper regions to keep statistically enough number of particles in the individual grids.
The silicate particle mass density at a grid of [x, x + Δx] and [|z|, |z| + Δz] is
 (28)
(28)
where ΔNx,z is a total number of the particles in the grid. We simply assumed the vertical isothermal hydrodynamical equilibrium. Then, the gas density is given by
 (29)
(29)
The silicate dust-to-gas ratio at (x, z) is
 (30)
(30)
We counted ΔNx,z in the simulation bins of [x, x + Δx] and [|z|, |z| + Δz] to calculate Z according to Eq. (30). With calculated Z, we updated dΛ = 1∕(1 + Z) in Eqs. (24) and (25) through Eqs. (6), (20), and (21) for the next step.
In the simulations, we normalized length by Hg, including the range of particle injection, Δxsubl and Δzsubl, and the grid sizes, Δx and Δz. The time was scaled by Ω−1, that is, each super-particle was injected at every unit’s scaled time. Therefore, our results can be applied for any location of rsnow, as long as Hg∕r is the same.
In the simulations here, we adopted fd/p = 0.5 and Hg∕r = 0.04 at r = rsnow, as nominal values. We do not need to specify the values of Hg and Ṁg or the value of rsnow, because only the scaled values, hd/g(= Hd∕Hg), hp/g(= Hp∕Hg), Hg∕r and Fp/g(= Ṁp∕Ṁg), are used in the simulations. For the viscous α-parameters, we show that only the ratios αDz∕αacc and αDr∕αacc are important.
4 Results
4.1 Codecheck
We tested our code by comparing the simulated particle scale heights with the existing analytical argument, as Ciesla (2010) already did, and by reproducing the simple analytical result by Ida & Guillot (2016) and the numerical result without the back reaction to silicate particles by Schoonenberg & Ormel (2017). We also offer a detailed comparison with the results obtained by an updated code of Hyodo et al. (2019) in Paper II. While Hyodo et al. (2019) included both nonzero αD r and αD z, they assumed the evolution of Hd analytically estimated only from the vertical stirring with αDz. In our simulation, the evolution of Hd was self-consistently calculated, and we find that the radial mixing with αD r is also important for Hd. On the other hand, the sublimation width Δxsubl is self-consistently calculated in Hyodo et al. (2019), while it needs to be assumed in the simulation here.
4.1.1 Confirmation of the theoretically predicted particle scale height
Figure 2 shows the distribution of particles and their scale heights (the local root mean square of z of the particles) in a steady state at t = 104Ω−1 (after 104 particles are injected), obtained by our Monte Carlo simulations for (a) αD z = 10−5, (b) 10−3, and (c) 10−1. For these runs, we neglected the back reactions to vr (Λ = 1) and αDz (K = 0). To highlight the effect of vertical stirring, we set αDr = 0. The other parameters are the particles’ Stokes numbers τs = 10−3 and αacc = 10−2. The equilibrium scale height predicted from Eq. (19) with τs,p replaced by τs = 10−3 are (a) 0.1Hg, (b) 0.71Hg, and (c) 1.0Hg, respectively,which are shown via the green dashed lines in the plots. As the particles drift inward, the local root mean square of z (representedby the blue solid curves) asymptotically approaches the theoretical values in each panel. Thus, we confirm that the analytically derived Eq. (19) is reproduced by our Monte Carlo simulations.
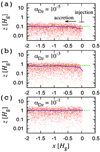 |
Fig. 2 Snapshots of particle distribution (red dots) on the x-z plane at time t = 104Ω−1, and the root mean square of z (blue solid curve) as a function of the radial direction x (centeredon the snow line location and in units of the gas pressure scale height Hg). We plot ∣z∣, while z takes either positive or negative values. We set αacc = 10−2, αD r = 0 and τs = 10−3. The vertical mixing parameter in each panel is (a) αDz = 10−5, (b) αD z = 10−3, and (c) αDz = 10−1. The analytical estimates of the equilibrium particle scale height for each αDz are shown by the dashed green lines. The back reactions are not included for vr (Λ = 1) and αD z (K = 0). We injected the particles in the range of x = [−0.05, 0.05]Hg and z = [−0.1, 0.1]Hg. |
4.1.2 Reproduction of the results of Schoonenberg & Ormel (2017) and Ida & Guillot (2016)
Ida & Guillot (2016) adopted the following setup: (1) the turbulent diffusion is neglected for simplicity, and (2) the silicate particle pile-up is fast enough that Hd is not increased from Δzsubl(= Hp) by the vertical stirring. To mimic the setup of Ida & Guillot (2016), we set the following in the Monte Carlo simulations: (1) we adopted αDr = 0, K = 0, and Δzsubl = 0.03Hg; (2) to keep Hd = Δzsubl = 0.03Hg as an equilibrium, we adopted αDz = 10−5 and τs,d = 10−2 (Eq. (19)); (3) the dust particle drift speed is set to be vr = −Λuν, where the artificially enlarged τs,d is not reflected (Eq. (6)), and (4) for gas, ur = −uν is always assumed. For comparison, vr = −uν (without the back reaction to vr) is also examined.
In the rest of the paper, we always set τs,p = 10−1 and τs,d = 10−5, and we consistently calculated Hp(= Δzsubl) by Eq. (19) and the evolution of Hd from Δzsubl by the vertical and radial diffusion, with given αDz and αDr. The above artificial setting is only used in the particular runs in Fig. 3.
Figure 3 shows the time evolution of the maximum value of ρd ∕ρg (the value on the midplane near the snow line) for different values of Fp/g, in the case of αacc = 10−2, Δxsubl = 0.1Hg, and Δzsubl = 0.03Hg. In panel a, the back reaction to vr is not included (Λ = 1) in the Monte Carlo calculations,that is, vr = ur = −uν, which corresponds to the result of Schoonenberg & Ormel (2017), except that they assumed hd/g = 1. The maximum ρd∕ρg quickly reaches the equilibrium values that are given by Eq. (3), with vr = ur = −uν and ZΣ = Z hd/g as
 (31)
(31)
The open circles in panel a represent this analytical solution for each of Fp/g, which completely agree with the numerical results here.
In Fig. 3b, the back reaction to vr is included (Λ <), corresponding to the setup of Ida & Guillot (2016). They predicted that runaway pile-up occurs for  , which is Fp/g > 0.06 for the parameters adopted here. This panel shows a clear runaway pile-up for Fp/g ≳ 0.1, which is consistent with the prediction.
A comparison between Figs. 3a and b clearly shows that the back reaction to vr of the silicate particles plays an essential role in the occurrence of the runaway pile-up. The increase in the pile-up slows down the drift velocity, and, accordingly, increases the pile-up itself. Because it is certain that the back reaction to vr exists, we include it in the results in the rest of the paper.
If the supply rate of silicate particles (fd/pṀp) exceeds a threshold value, the mode of the pile-up becomes runaway. The threshold value must be regulated by the local value of ρd ∕ρg, because the back reaction becomes effective once ρd∕ρg exceeds unity. While Ṁp, more exactly Fp/g, determines ZΣ = Σd∕Σg, the local value of Z = ρd∕ρg is regulated byHd and ZΣ (Z = ZΣ∕hd/g) near the snow line. The silicate dust particlescale height Hd is regulated bythe pebble scale height Hp (= Δzsubl in our simulation) and turbulent mixing parmeters, αDz and αDr, as shown in Sect. 4.3.
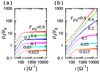 |
Fig. 3 Time evolution of the maximum ρd∕ρg. The back reaction to vr is included in the results in panel b, but not in panel a. The light blue, magenta, blue, green, and red curves are the results with Fp/g = 0.025, 0.05, 0.1, 0.2, 0.4, and 0.8, respectively. The other parameters are fixed as αacc = 10−2 and Δxsubl = 0.1Hg and Δzsubl = 0.03Hg. To mimic the settings of Ida & Guillot (2016), we artificiallly set αDr = 0, αD z = 10−5 and τs,d = 10−2 (however, the relatively large τs,d for the silicate dust is not reflected to the dust drift speed). The latter two parameters maintain Hd = Δzsubl. The circles in panel a represent the analytical solution given by Eq. (31). That in panel b is the analytical solution for non-divergent case (Fp/g = 0.025) given by Eq. (15). |
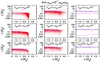 |
Fig. 4 Snapshots of silicate particles at t = 104 Ω−1 (red dots), and the root mean square of z (blue solid curves) at each grid of x. The dashed blue curves are given by Eq. (35) with Δxsubl replaced by max(Δxsubl, |x|) (see thediscussion at the end of Sect. 4.3.2). The magenta curve represents log10 (ρd∕ρg) near the midplane. We set αacc = 10−2, τs,d = 10−5, and fd/p = 0.5, and Ṁg = 10−8M⊙ yr−1. The nine panels adopt different values of Fp/g and αD z = αDr, as indicated in each panel. |
4.2 Typical results
We first show typical results in our simulations for different Fp/g and αD z (= αDr). As we show below, the radial diffusion also contributes to Hd. The back reaction to vr is included. In these results, Δxsubl = 0.1Hg is adopted, as well as αacc = 10−2.
Figure 4 shows the snapshots of silicate particles at 104 Ω−1 for the cases without the back reaction to diffusion coefficients (K = 0). In the right panels with αDz = αDr = 10−2 (αD z∕τs,d = 103), the vertical mixing is fast enough to realize the upper limit of Hd (Hd ≃ Hg) for all of Fp/g = 0.1, 0.3, and 1. Even for a high-mass flux of pebbles (Fp/g = 1.0), no pile-up of the silicate particles is found for αDz = αDr = 10−2. In the case of αDz = αDr = 10−6, on the other hand, the mixing is so weak that Hd is not increased to the equilibrium value [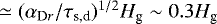 ] in the range of x > −2 Hg. Nevertheless, Hd near the injection point (x ~ 0) is much higherthan Δzsubl = Hp = 0.003Hg. This means that Hd is regulated by αDr as well as byαDz, which is discussed in Sect. 4.3.
Figure 5 show the results with the back reaction to diffusion coefficients (K = 1). In general, the runaway pile-up is more pronounced for smaller αDz = αDr and larger Fp/g. The magenta curves represent log10(ρd∕ρg) near the midplane. The midplane ρd∕ρg usually takes the maximum value, at the injection (sublimation) region, x ~ 0, which is denoted by  . In the panels with
  (the panels with αDz = 10−2 and those with αDz = 10−4 and Fp/g = 0.3 and 0.1), the results are similar to those in Fig. 4. If ρd∕ρg ≳several in Fig. 4, however, the pile-up is much more pronounced in this case, because the radial and vertical diffusions become much weaker as the pile-up proceeds.
Figure 6 shows the time evolution of  and Hd∕Hp at the maximum ρd∕ρg locations (hd/g,0), for different Fp/g. In panel a, the back reaction to diffusion is not included (K = 0). As Figs. 4 and 5 suggest, the transient αD z (= αDr) values between the runaway pile-up and non-pile-up cases are αDz ≃ 10−5 for K = 0 and αD z ≃ 10−4 for K = 1, so we plot the results with αDz = 10−5 in panel a and αDz = 10−4 in panel b. These figures show that transition to the runaway pile-up is much clearer in the case of K = 1.
This difference comes from the Hd evolution. The comparison with the result of Ida & Guillot (2016) in Sect. 2 suggests that Hd is directly related to a threshold value of Fp/g for the runaway pile-up: a lower Hd leads to a lower threshold value of Fp/g. However, Fig. 6 shows that Hd increases as ρd∕ρg increases in the case of K = 0, while it decreases for K = 1. Therefore, the pile-up suffers negative feedback for K = 0, but it suffers positive feedback for K = 1, resulting in a much clearer transition to the runaway pile-up.
In both cases, the back reaction to vr is included. As the pile-up proceeds, vr decreases, which enhances the pile-up. However, we also included the vertical stirring. As vr decreases, the silicate particles are stirred up for a longer period of time before they leave the sublimation region, resulting in higher Hd near that location. In panel a, Hd near the sublimation region quickly asymptotes to an equilibrium value for Fp/g ≤ 0.2 (lower  cases), and it increases with time for Fp/g = 0.8 (the runaway pile-up cases). In panel b, in the runaway pile-up cases (Fp/g = 0.4 and 0.8), Hd initially increases with time. However, after ρd∕ρg exceeds ~1, the diffusion coefficients become so small that the settling of the particles overwhelms the vertical stirring, and Hd decreases. Thus, the different responses to the pile-up between K = 0 and K = 1 result in different Hd and ρd∕ρg evolution in the pile-up cases. As we discussed in Sect. 3.2, K = 1 (with the diffusion back reaction) is more realistic.
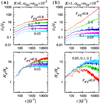 |
Fig. 6 Time evolution of |

4.3 Silicate particle scale height
4.3.1 Monte Carlo simulation results
Figure 7 shows  and hd/g, 0 at t = 15 000 Ω−1 as a function of αDz = αDr for different Fp/g. This figure more clearly shows that the asymptotic equilibrium values of hd/g, 0 are independentof Fp/g in the non-runaway pile-up cases, which is suggested by Fig. 6. The envelope curves in the plots for (a) K = 0 and (b) K = 1 match the analytical formula derived in the next subsubsection (Eqs. (3) and (35) with Eq. (36)). The equilibrium values are generally larger than the scale height of the injected silicate particles, Δzsubl, due to the effects of vertical and radial diffusion. In panels a and b, the values of hd/g, 0 that deviate from the envelope curves correspond to the runaway pile-up; hd/g, 0 deviates to higher values for K = 0 and lower values for K = 1. If we calculate on longer timescales, the deviations increase.
4.3.2 Analytical formula for the silicate scale height
The red dashed curves in Fig. 7 are analytical formulas for the non pile-up cases, which are derived as follows. The timescale to drift by Δxsubl is
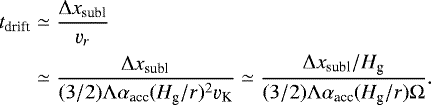 (32)
(32)
As the pile-up proceeds (Λ = 1∕(1 + Z) decreases), the particle drift becomes slower, and, accordingly, tdrift becomes longer. The vertical diffusion length during tdrift is
 (33)
(33)
This expression suggests that zdiff becomes higher as the pile-up proceeds (Λ decreases) for the case of K = 0. Hereafter, we derive the equilibrium value of Hd∕Hg for the non-pile-up cases with Λ ≃ 1 (the envelope curves in Fig. 7). If Z ≫ 1 for the equilibrium value of Hd∕Hg, the runaway pile-up occurs, so Z keeps increasing and the equilibrium value of Hd∕Hg no longer exists.
If only vertical diffusion is considered, the silicate particle scale height scaled by Hg is predicted as
 (34)
(34)
Furthermore, during tdrift, the particles are radially mixed in the range of  . In general, the dust scale height increases with distance from the snow line. If xdiff ≫ Δxsubl, the radial diffusion brings the high-z particles back to the injection region and raises the value of hd/g there. To take this effect into account, we found through comparison with the Monte Carlo simulation results that a good-fit analytical formula is obtained by multiplying the above hd/g by a factor of
 ![Mathematical equation: $[1 + (x_{\textrm{diff}}/\Delta x_{\textrm{subl}})^2]$](/articles/aa/full_html/2021/02/aa39705-20/aa39705-20-eq51.png) . When αD r is comparable to αacc, the silicate scale height is radially smoothed out, and the effect of radial mixing for the scale height becomes weak. To take this into account, we replaced αDr∕αacc in
. When αD r is comparable to αacc, the silicate scale height is radially smoothed out, and the effect of radial mixing for the scale height becomes weak. To take this into account, we replaced αDr∕αacc in 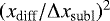 by
by ![Mathematical equation: $(\alpha_{\textrm{D}r}/ \alpha_{\textrm{acc}})/[1+ (C_{r, \rm diff} \, \alpha_{\textrm{D}r}/\alpha_{\textrm{acc}})^2]$](/articles/aa/full_html/2021/02/aa39705-20/aa39705-20-eq53.png) in the above equation. Comparing the formula with the numerical results (Figs. 7 and 8), we empirically adopted Cr,diff = 10. With these modifications,
in the above equation. Comparing the formula with the numerical results (Figs. 7 and 8), we empirically adopted Cr,diff = 10. With these modifications,
![Mathematical equation: \begin{align*} h_{\textrm{d/g,*}} \simeq & \left(\frac{\Delta z_{\textrm{subl}}^2}{H_{\textrm{g}}^2} + \frac{2}{3} \frac{\alpha_{\textrm{D}z}}{\alpha_{\textrm{acc}}} \frac{\Delta x_{\textrm{subl}}/H_{\textrm{g}}}{H_{\textrm{g}}/r}\right)^{1/2} \nonumber\\ & \times \left[1 + \frac{2}{3} \frac{(\alpha_{\textrm{D}r}/\alpha_{\textrm{acc}})}{1+ (C_{r, \rm diff}\,\alpha_{\textrm{D}r}/\,\alpha_{\textrm{acc}})^2} \frac{1}{(H_{\textrm{g}}/r)(\Delta x_{\textrm{subl}}/H_{\textrm{g}})} \right].\end{align*}](/articles/aa/full_html/2021/02/aa39705-20/aa39705-20-eq54.png) (35)
(35)
Because hd/g cannot exceed the equilibrium value 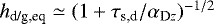 , the final form is
 (36)
(36)
As the lower panels in Fig. 7 show, the analytical formula reproduces the envelope curves of Hd ∕Hp obtained by the numerical simulations for the non-pile-up cases. We note that hd/g, 0 and  depend on the ratios of αDr∕αacc and αDz∕αacc, but not on their absolute values.
Equation (35) is the analytical formula for hd/g at x ~ 0. This formula can be extrapolated to any x by replacing Δxsubl with max(Δxsubl, |x|, ϵ), where ϵ is added to avoid the divergence in the case of extremely small Δxsubl; we adopted ϵ = 0.01 Hg. In Figs. 4 and 5, the scale height distribution obtained by the Monte Carlo simulations are well reproduced by the analytical formula (the blue dashed curves), except for the runaway pile-up cases, where the back reaction modulates the scale height as we discussed in this subsection.
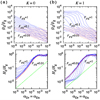 |
Fig. 7 Maximum ρd∕ρg and Hd ∕Hg at the maximum ρd∕ρg locations at t = 15000 Ω−1 as a functionof αDz = αDr for different Fp/g. The back reaction to diffusion is included with K = 1 in panel b, but not (K = 0) in panel a. The other parameters are fixed as αacc = 10−2, Δxsubl= 0.1Hg, and ΔzsublHp given by Eq. (19). Upper and bottom panels: the red dashed curves are the analytical formulas given by Eqs. (3) and (35) with Eq. (36). Lower panels: the green dashed lines represent Δzsubl ∕Hg. |
4.4 Silicate particle pile-up
4.4.1 Analytical formula for the silicate pile-up
We can also derive an analytical formula for  (the midplane particle-to-gas ratio at x ~ 0) for the non-runaway pile-up cases and for the phase before the runaway pile-up proceeds. If the estimated
  exceeds ~ 1, the actual value of ρd∕ρg should deviate from the estimate and increase with time.
Basically,  is predicted by Eq. (15) with the scale hight formula, Eqs. (36) and (35). A possible detailed correction is to include the effect of outward diffusion flux (Fd,D) of silicate particles beyond the snow line that can be found in the snapshots with αD r = αacc = 10−2 in Figs. 4 and 5. As shown in Appendix B, calibrating with the results of Monte Carlo simulations in Figs. 7 and 8, the effect can be achieved with fd/pFp/g being replaced by Fd,net = fd/pFp/g − Fd,D, where
![Mathematical equation: \begin{equation*} F_{\textrm{d,net}} = f_{\textrm{d/p}} F_{\textrm{p/g}} \left[1 - \left(1+ \frac{15}{2}\frac{H_{\textrm{g}}}{r}\frac{\alpha_{\textrm{acc}}}{\alpha_{\textrm{D}r}}\right)^{-1} \right].\end{equation*}](/articles/aa/full_html/2021/02/aa39705-20/aa39705-20-eq61.png) (37)
(37)
Accordingly, Eq. (15) is reduced to
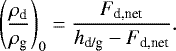 (38)
(38)
This formula reproduces the numerical results in Figs. 7 and 8, as long as ρd ∕ρg ≲ 1. We note, however, that if the effect of silicate particles that diffuse beyond the snow line sticking to icy pebbles is considered, most of the silicate grains beyond the snow line may eventually come back with the pebbles, so Fd,net would become more similarto fd/pFp/g.
We derived the analytical formulas for the silicate particle scale height, Eqs. (35) and (36), and those for the pile-up, Eqs. (37) and (38). The formulas make the intrinsic physics of the pile-up of the silicate particles released from the drifting icy pebble by their sublimation clear, which is a complicated process. Here, we study the parameter dependences using the analytical formulas and the simulations with K = 1.
The formulas imply that the results are scaled by αDz∕αacc and αDr∕αacc for given Δzsubl, Δxsubl, and Hg ∕r. We also carried out the Monte Carlosimulations with αacc = 10−3 and confirmed that the plots in Fig. 7 do not change as long as we use αD r ∕αacc (= αDz∕αacc) as the horizontal coordinate.
The sublimation width, Δxsubl, is an independent parameter. The results with Δxsubl = Hg (Fig. 8b), are compared to those with Δxsubl = 0.1Hg (Fig. 8a, which are identical to Fig. 7b). In Fig. 8b, the injected particles are distributed in region ten-times broader than in the case of Fig. 8a. As a result, the vertical mixing is more effective (tdrift is longer) and the pile-up (the maximum ρd∕ρg) is lower.
So far, the results with αDr = αDz have been shown. In Fig. 8c, αDr is fixed and αDz is independently changed. In Fig. 8d, αDz is fixed. The envelope curves for Hd∕Hg (= hd/g) are also reproduced by the analytical formula in these cases, which strongly suggests that the correction factors with the vertical and radial diffusion are physically correct.
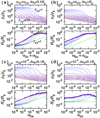 |
Fig. 8 Same as Fig. 7, except for αDz∕αDr relations and the value of Δxsubl. The maximum ρd∕ρg and hd/g (= Hd ∕Hg) for different Fp/g are given as functions of (a) αD r = αDz with Δxsubl = 0.1 Hg, which is the same as Fig. 7b, for comparison, (b) αD r = αDz with Δxsubl = Hg, (c) αD z with αDr = 10−4 and Δxsubl = 0.1 Hg, and (d) αD r with αDz = 10−4 and Δxsubl = 0.1 Hg. For all the cases, K = 1 is adopted. Upper and bottom panels: the red dashed curves are the analytical formulas given by Eqs. (35) and (3) with corresponding parameter values. |
4.4.2 The condition for the silicate runaway pile-up
The analytical formulas reproduce the numerical results for a broad range of multidimensional parameters. Figure 9a shows the contour maps of the maximum ρd∕ρg on the planeof αDz∕αacc(= αDr∕αacc), and Fp/g at t = 1.5 × 10⁴ Ω−1 for Δxsubl = 0.1 Hg. In Fig. 9b, Δxsubl is given by Eq. (41). In both cases, αacc = 10−2 and K =1. The left and right panels show the results of Monte Carlo simulations and the analytical results, respectively. The red regions represent the parameter ranges of runaway pile-up of silicate particles. As expected, the analytical formulas reproduce the numerical results.
For these simulations, αacc = 10−2 and αDz(= αDr) are in the range of [10−6, 10−2]. The analytical formula to predict  is Eq. (37) with Eqs. (38), (35), and (36). They are functions of αD r ∕αacc and αD z ∕αacc for given Δxsubl, as long as the term
  in Eq. (35) is negligible, which is satisfied in the parameter range we considered, as shown inFigs. 7 and 8. We also carried out simulations with αacc = 10−3 and αD z (= αDr) in the range of [10−7, 10−3] to find thatthe contour map is almost identical, confirming that the results are scaled by αD z ∕αacc(= αDr∕αacc).
Using the formulas, we derive the boundary of the runaway pile-up on the plane of αD z ∕αacc (= αDr∕αacc) and Fp/g. Equation (38) shows that the boundary is given by Fd,net ≃ hd/g. As shown in Figs. 9a and b, the boundary is located at αD z (= αDr) < 3 × 10⁻⁴ for Fp/g < 1. In this parameter range, Fig. 7 shows hd/g ≃ hd/g,*. Since αDr∕Cr,diff αacc ≪ 1 for αacc ~ 10−2, Fd,net ≃ fd/pFp/g. Therefore, the boundary is approximately given by
![Mathematical equation: \begin{align*} F_{\textrm{p/g}} & \simeq f_{\textrm{d/p}}^{-1} h_{\textrm{d/g,*}} \nonumber\\ & \simeq f_{\textrm{d/p}}^{-1} \left(\frac{2}{3} \frac{\alpha_{\textrm{D}z}}{\alpha_{\textrm{acc}}} \frac{\Delta x_{\textrm{subl}}/H_{\textrm{g}}}{H_{\textrm{g}}/r} \right)^{1/2} \left[ 1 + \frac{2}{3} \frac{\alpha_{\textrm{D}r}}{\alpha_{\textrm{acc}}} \frac{1}{(H_{\textrm{g}}/r)(\Delta x_{\textrm{subl}}/H_{\textrm{g}})} \right].\end{align*}](/articles/aa/full_html/2021/02/aa39705-20/aa39705-20-eq65.png) (39)
(39)
Adopting Hg∕r = 0.04 and fd/p = 1∕2 as nominal values,
![Mathematical equation: \begin{eqnarray} F_{\textrm{p/g}} & \simeq & 0.13 \left(\frac{f_{\textrm{d/p}}}{1/2}\right)^{-1} \left(\frac{\alpha_{\textrm{D}z}/\alpha_{\textrm{acc}}}{10^{-2}}\right)^{1/2} \left(\frac{H_{\textrm{g}}/r}{0.04}\right)^{1/2} \left(\frac{\Delta x_{\textrm{subl}}}{0.1\,H_{\textrm{g}}} \right)^{1/2} \nonumber \\ & & \times \left[ 1 + \frac{5}{3} \left(\frac{\alpha_{\textrm{D}r}/\alpha_{\textrm{acc}}}{10^{-2}}\right) \left(\frac{H_{\textrm{g}}/r}{0.04}\right)^{-1} \left(\frac{\Delta x_{\textrm{subl}}}{0.1\,H_{\textrm{g}}}\right)^{-1} \right] \nonumber \\ & \propto & \left\{ \begin{array}{ll} \displaystyle \left(\frac{\alpha_{\textrm{D}z}}{\alpha_{\textrm{acc}}} \right)^{1/2} \left(\frac{\alpha_{\textrm{D}r}}{\alpha_{\textrm{acc}}} \right) \Delta x_{\textrm{subl}}^{-1} & \displaystyle [\frac{\alpha_{\textrm{D}z}}{\alpha_{\textrm{acc}}} > 0.6 \times 10^{-2} ],\\ \displaystyle \left(\frac{\alpha_{\textrm{D}z}}{\alpha_{\textrm{acc}}} \right)^{1/2} \Delta x_{\textrm{subl}}^{1/2} & \displaystyle [\frac{\alpha_{\textrm{D}z}}{\alpha_{\textrm{acc}}} < 0.6 \times 10^{-2} ].\end{array} \right. \end{eqnarray}](/articles/aa/full_html/2021/02/aa39705-20/aa39705-20-eq66.png) (40)
(40)
This equation explicitly shows that the pile-up condition is scaled by αD r ∕αacc and αD z ∕αacc.
In Eq. (40), the sublimation width, Δxsubl, is a free parameter. We used Δx = 0.1 Hg as a nominal parameter. The sublimation width was determined by the sublimation and drift rates of icy pebbles. The sublimation rate is given by the partial pressure of water vapor and the disk temperature. The water vapor partial pressure is affected by radial diffusion. In Paper II, we numerically solve the sublimation width, taking account of the icy pebble size evolution and the water vapor partial pressure in a turbulent accretion disk. Fitting the numerical results, the sublimation width for αDz = αDr and αacc = 10−2 is roughly approximated as
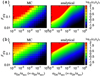 |
Fig. 9 Contour maps of the maximum ρd∕ρg on the plane of αDz∕αacc(= αDr∕αacc) and Fp/g with (a) Δxsubl= 0.1 Hg, and (b) Δxsubl given by Eq. (41). In both cases, αacc = 10−2 and K = 1 are adopted. Left panels: results of Monte Carlo simulations at t = 15 000 Ω−1, and right ones: results after using analytical formulas given by Eq. (3) with Eqs. (35), (36), (4), and the corresponding Δxsubl. The Monte Carlo simulations were performed with a grid size of Δlog10(αDz∕αacc) = Δlog10Fp/g = 0.2. We used more refined grids to make the maps by the analytical formulas. The color scales are based on log10 (ρd∕ρg). |
![Mathematical equation: \begin{align*} &\log_{10} \left(\frac{\Delta x_{\textrm{subl}}}{H_{\textrm{g}}}\right) \simeq \frac{X_+ - X_-}{2} \textrm{erf} \left[ 3 \log_{10} \left(\frac{\alpha_{\textrm{D}r}/\alpha_{\textrm{acc}}}{0.08}\right) \right] + \frac{X_+ + X_-}{2}, \nonumber\\ & X_- = \log_{10} (\Delta x_{\textrm{subl}}/H_{\textrm{g}})_{-} = \log_{10} 2; \nonumber \\ & X_+ = \log_{10} (\Delta x_{\textrm{subl}}/H_{\textrm{g}})_{+} = \log_{10} 0.1,\end{align*}](/articles/aa/full_html/2021/02/aa39705-20/aa39705-20-eq67.png) (41)
(41)
where  and
and  are the lower αDr∕αacc limit at which advection dominates, and the higher one at which radial diffusion dominates, respectively (Paper II). The error function smoothly connects the two limits. Figures 9a and b show that the threshold value of Fp/g is several times higher than in Fig. 9a for αDz∕αacc ~ 10−4, while it is similar for αDz∕αacc ~ 10−2. In the former case,
  (Eq. (40)), so Fp/g must be larger in Fig. 9b than in Fig. 9a by a factor of
  (Eq. (41)), while the dependence on Δxsubl must be slightly weaker in the latter case (Eq. (41)). Thereby, the silicate particle runaway pile-up condition with Eq. (41) is roughly given by
 (42)
(42)
which agrees with the results in Fig. 9.
Figure 9 shows the results with αDr = αDz. As mentioned in Sect. 1, magneto-hydrodynamic simulations gave αD r < αDz (Zhu et al. 2015; Yang et al. 2018). We also performed simulations with αD r = 0.1 αDz. As we can predict from Eq. (40), the runaway pile-up region is extended to a value several times larger of αD z ∕αacc at Fp/g ~ 1 in the case of Δxsubl = 0.1 Hg, while the runaway pile-up region is almost the same for smaller values of Fp/g. Because αD z ∕αacc is very uncertain, we surveyed a rather broad parameter space and leave the estimate of αD z ∕αacc for future study.
4.4.3 Comparison with Hyodo et al. (2019)
Hyodo et al. (2019) performed 1D advection-diffusion grid code simulations with αacc = 10−2 and αD r = αDz = 10−3, 3 × 10⁻³, 10−2 to find that the silicate runaway pile-up occurs for αDz = αDr ≈ 10−1αacc and Fp/g ≥ 0.3 in the case of K = 1. However, Fig. 9b shows that the silicate runaway pile-up region is restricted to a smaller parameter range, that is, to values of αD z ∕αacc = αDr∕αacc that are one order of magnitude smaller for a given Fp/g value. As already mentioned, this is because Hyodo et al. (2019) assumed that the silicate scale height is ~ Δzsubl at the snow line and it is gradually increased by the vertical turbulent stirring as the particles drift inward, whereas the Monte Carlo simulations performed here show that the silicate scale height is larger, due to the effect ofa coupled radial and vertical diffusion in a finite-sized sublimation width. As a result, smaller αD z and αD r are required for a runway pile-up.
5 Conclusion and discussions
The runaway pile-up of silicate particles released from sublimating icy pebbles that pass through the snow line is a potential mechanism to form rock-rich planetesimals. Ida & Guillot (2016) showed that the back reaction (inertia) of silicate particles to gas drag can lead to a runaway pile-up of dust particles. They provided a simple criterion for this to occur, as a function of both the pebble-to-gas mass-flux ratio and the silicate particle scale-height. Schoonenberg & Ormel (2017) found instead that a runaway pile-up of ice-rich pebbles would be possible, and that of silicate particles does not occur. However they did not include the back reaction of dust particles, and thus found no pile-up of dust particles. Hyodo et al. (2019) performed 1D diffusion-advection grid code simulations including turbulent diffusion and the back reaction to radial drift and diffusion for both icy pebble and silicate particles. They allowed the local turbulent diffusion governing radial and vertical diffusion to differ from the effective viscosity controlling the gas mass flux in the disk. They found that a runaway pile-up of either dust or pebbles could be achieved, depending on the values of turbulent diffusion and of the pebble-to-gas mass-flux ratio. However, they had to approximate the calculation of the silicate particle scale-height based on simple arguments. In this work, we revisited this issue.
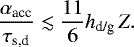
We developed a new 2D (r-z) Monte Carlo code to simulate the pile-up of small silicate particles released from sublimating pebbles in a turbulent protoplanetary disk, taking account of the back reactions to the drift velocity and the diffusion of silicate particles. From the simulation results, we derived semi-analytical formulas for the maximum silicate-to-gas density ratio near the injection region and the silicate scale height there as a function of the pebble mass flux, αacc, αD r, and αD z. Using the derived formulas, we determined the detailed condition for the silicate runaway pile-up. We found that the silicate particle scale height is larger than the estimate of Hyodo et al. (2019), due to the coupled effect of radial and vertical diffusion, and that for the silicate particle runaway pile-up to occur, αD z ∕αacc ≲ 10−2× (pebble-to-gas mass flux)2 is required, which is more restrictive than the result of Hyodo et al. (2019) (αD z∕αacc ≲ 10−1 and Fp/g ≳ 0.3). To clarify if the condition is actually satisfied, detailed nonideal MHD simulations are needed to evaluate αD z, αD r, and αacc.
Thus far, we have not included the pile-up of icy pebbles. This would occur upstream, that is, beyond the snow line, and could thus suppress the supply of pebbles and therefore dust grains, affecting the pile-up of dust-rich planetesimals. It is also important to understand when and where runaway pile-ups of icy pebbles and silicate particles may occur in the course of disk evolution. We investigate these issues in Paper II.
One would want to extend the arguments developed in this work to other ice lines, such as for NH3 and CO2. The pile-up process proposed here only occurs if the Stokes numbers of the particles before and after the sublimation of a volatile component (τs,0 and τs,1, respectively) satisfy τs,0 ≫ αacc ≳ τs,1. It is unlikely that this condition is satisfied at the ice lines of volatile elements other than H2 O. This pile-up process is therefore only expected to be effective for the water snow line.
Acknowledgements
We thank Vardan Elbakyan for providing his simulation data and Chao-Chin Yang for helpful comments. S.I. was supported by MEXT Kakenhi 18H05438. T.G. was partially supported by a JSPS Long Term Fellowship at the University of Tokyo. R.H. was supported by JSPS Kakenhi JP17J01269 and 18K13600). R.H. also acknowledges JAXA’s International Top Young program. S.O. was supported by JSPS Kakenhi 19K03926 and 20H01948. A.N.Y. was supported by NASA Astrophysics Theory Grant NNX17AK59G and NSF grant AST-1616929.
Appendix A The effects of back reaction to gas motion
The silicate dust particle and gas radial velocities taking account of the inertia of the particles (“back reaction”) at |z| < Hd are given, respectively, by (Schoonenberg & Ormel 2017)

where τs,d is the Stokes number of the particles, Z = ρd∕ρg, Λ = ρg∕(ρg + ρd) = 1∕(1 + Z), uν is an unperturbed disk gas accretion velocity given by
 (A.3)
(A.3)
and  . When we consider the icy pebbles, the subscript “d” is replaced by “p.” Equations (A.1) and (A.2) are rewritten as

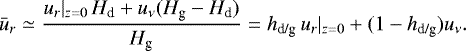
We adopted a two-layer model: a dust-rich midplane layer with scale height Hd and a dust-poor upper layer. To evaluate gas surface density, we used the vertically averaged ur, such that
 (A.6)
(A.6)
where
 (A.7)
(A.7)
SubstitutingEq. (A.5) into this equation, we obtain
![Mathematical equation: \begin{align*} \bar{u}_r & \simeq \frac{\Lambda}{1+\Lambda^2 \tau_{\textrm{s,d}}^2} \nonumber\\ & \times \left[ \left(\frac{2\tau_{\textrm{s,d}}}{1+Z} + \frac{3\alpha_{\textrm{acc}}}{2C_{\eta}} \right) Z \, h_{\textrm{d/g}} - \frac{3\alpha_{\textrm{acc}}}{2C_{\eta}} (1 + Z + \Lambda \tau_{\textrm{s,d}}^2) \right] \eta \varv_{\textrm{K}}.\end{align*}](/articles/aa/full_html/2021/02/aa39705-20/aa39705-20-eq79.png) (A.8)
(A.8)
We note that even the vertically averaged gas motion is outward for
![Mathematical equation: \begin{equation*} \frac{\alpha_{\textrm{acc}}}{\tau_{\textrm{s,d}}} < \frac{4C_{\eta}}{3} h_{\textrm{d/g}} \frac{Z}{(1+Z)[1+Z(1-h_{\textrm{d/g}})]},\end{equation*}](/articles/aa/full_html/2021/02/aa39705-20/aa39705-20-eq80.png) (A.9)
(A.9)
where we assumed  . For Z ≲ 1 and Cη = 11∕8, this condition is reduced to
 (A.10)
In the case of silicate dust particles, since τs,d ≪ αacc, this condition is not satisfied and the gas flow is always inward.
For pebbles, the outward flow condition is the same as Eq. (A.10) with “d” replaced by “p”. The condition is less restrictive than that for silicate particles; however, it is not satisfied within the parameter range in this paper, as shown below. We usually consider the cases of τs,p > αacc and 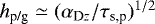 . In this case, the modified Eq. (A.10) is Z ≳ (6∕11)(αacc∕αDz)hp/g. If this equation is satisfied, the (vertically averaged) gas flow is outward beyond the snow line. However, in our case, Z, αacc, and αD z are not independent. Equation (A.16) is Z ≃ (1∕2)(3∕4Cη)(αDz∕αacc)hp/gFp/g for Z < 1. Thus, the outward flow condition in the icy pebble region is
 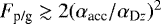 . It is out of the parameter range that we cover in this paper. In the parameter regimes we cover, ūr is always negative (inward flow) in the regions of both silicate particles and icy pebbles.
Substituting Eqs. (A.8) and (A.1) into Eq. (A.6),
![Mathematical equation: \begin{align*} Z \, h_{\textrm{d/g}} & \simeq Z_{\Sigma} \simeq \frac{\bar{u}_r}{\varv_r} f_{\textrm{d/p}} F_{\textrm{p/g}} \nonumber \\ & \simeq \frac{-2 \frac{Z}{1+Z} \, h_{\textrm{d/g}} \tau_{\textrm{s,d}} + \frac{3}{2C_{\eta}}\alpha_{\textrm{acc}} \left[1 + Z (1-h_{\textrm{d/g}}) + \frac{\tau_{\textrm{s,d}}^2}{1+Z}\right]}{2 \Lambda \,\tau_{\textrm{s,d}} + \frac{3}{2C_{\eta}} \alpha_{\textrm{acc}}} f_{\textrm{d/p}} F_{\textrm{p/g}}.\end{align*}](/articles/aa/full_html/2021/02/aa39705-20/aa39705-20-eq85.png) (A.11)
(A.11)
Now we adopt the approximation only appropriate for the silicate dust, τs,d ≪ αacc ≪ 1. With this approximation, Eq. (A.11) is reduced to
![Mathematical equation: \begin{align*} Z \, h_{\textrm{d/g}} & \simeq \left[1 + Z (1-h_{\textrm{d/g}}) \right] f_{\textrm{d/p}} F_{\textrm{p/g}}, \end{align*}](/articles/aa/full_html/2021/02/aa39705-20/aa39705-20-eq86.png) (A.12)
(A.12)
which is solved in terms of Z as
 (A.13)
As we discuss in Sect. 2, the pile-up of silicate particles is radially local and the corresponding local surface density variation of Σg could be smoothed out. In that case, it may be better to use ur = uν than ūr here, and we obtain
 (A.14)
Because hd/g ≪ 1 for the pile-up case, the pileup condition differs only slightly between Eqs. (A.13) and (A.14).
From Eqs. (A.13) and (A.14), the runaway pile-up conditions of silicate particles are given by
![Mathematical equation: \begin{align*} F_{\textrm{p/g}} & > \frac{f_{\textrm{d/p}}^{-1}}{1-h_{\textrm{d/g}}}h_{\textrm{d/g}} \:\textrm{or} \: > f_{\textrm{d/p}}^{-1} h_{\textrm{d/g}} & [\rm silicate \: particles].\end{align*}](/articles/aa/full_html/2021/02/aa39705-20/aa39705-20-eq89.png) (A.15)
(A.15)
This equation implies that the particle scale height is the key parameter for the runaway pile-up: the pile-up is favored for a smaller scale height. In Sect. 4.3, we discuss the effect of radial and vertical diffusion on the silicate particle scale height, hd/g, because it is not in an equilibrium state.
On the other hand, for pebbles, αacc ≪ τs,p ≪ 1 is an appropriate approximation. From αacc ≪ τs,p, we can also assume hp/g ≪ 1. With these approximations, Eq. (A.11) with “d” replaced by “p” and fd/p by 1 is reduced to
 (A.16)
This quadratic equation does not have a solution if
 (A.17)
Therefore, the runaway pile-up condition for pebbles is
 (A.18)
We discuss the pebble runaway pile-up condition with the effect of the vertical stirring by Kelvin-Hermholtz Instability in more details in Paper II.
Appendix B Consequences of outward diffusion over the snow line
In Eq. (15), the radial diffusion effect of silicate particles is not included. The (scaled) radial diffusion flux of silicate particles is
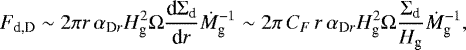 (B.1)
(B.1)
where CF is an unknown numerical factor. We calibrated CF by the results of Monte Carlo simulations in Figs. 7 and 8 as follows. The (scaled) net silicate dust mass flux, Fd,net ~ fd/pFp/g − Fd,D, in a steady state, should satisfy 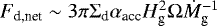 . SubstitutingEq. (B.1) into this equation, we obtain
![Mathematical equation: \begin{align*} F_{\textrm{d,D}} & \sim f_{\textrm{d/p}} {F}_{\textrm{p/g}}\times \left[1+ \frac{3}{2\,C_F}\frac{H_{\textrm{g}}}{r}\frac{\alpha_{\textrm{acc}}}{\alpha_{\textrm{D}r}}\right]^{-1}. \end{align*}](/articles/aa/full_html/2021/02/aa39705-20/aa39705-20-eq95.png) (B.2)
(B.2)
Accordingly, the midplane particle-to-gas ratio at x ~ 0,  , is given by Eq. (15) with fd/pFp/g replaced by Fd,net = fd/pFp/g − Fd,D, as
 (B.3)
(B.3)
where
![Mathematical equation: \begin{equation*} F_{\textrm{d,net}} = f_{\textrm{d/p}} F_{\textrm{p/g}} \left\{1 - \left[1+ \frac{3}{2 \, C_F}\frac{H_{\textrm{g}}}{r}\frac{\alpha_{\textrm{acc}}}{\alpha_{\textrm{D}r}}\right]^{-1} \right\}.\end{equation*}](/articles/aa/full_html/2021/02/aa39705-20/aa39705-20-eq98.png) (B.4)
(B.4)
We plotted the analytical estimate of  given by Eq. (3) with CF = 0.2 in Figs. 7 and 8. They fit the numerical results as long as
  . If the effect of sticking to icy pebbles by silicate particles that diffuse beyond the snow line is considered, most of the silicate grains beyond the snow line may eventually come back with the pebbles, so Fd,net would become more similar to fd/pFp/g.
References
- Adachi, I., Hayashi, C., & Nakazawa, K. 1976, Prog. Theor. Phy., 56, 1756 [CrossRef] [Google Scholar]
- Appelgren, J., Lambrechts, M., & Johansen, A. 2020, A&A, 638, A156 [CrossRef] [EDP Sciences] [Google Scholar]
- Armitage, P. J., Simon, J. B., & Martin, R. G. 2013, ApJ, 778, L14 [NASA ADS] [CrossRef] [Google Scholar]
- Bai, X.-N., Ye, J., Goodman, J., & Yuan, F. 2016, ApJ, 818, 152 [Google Scholar]
- Blum, J., & Wurm, G. 2000, Icarus, 143, 138 [NASA ADS] [CrossRef] [Google Scholar]
- Brauer, F., Dullemond, C. P., & Henning, T. 2008, A&A, 480, 859 [NASA ADS] [CrossRef] [EDP Sciences] [Google Scholar]
- Carrera, D., Johansen, A., & Davies, M. B. 2015, A&A, 579, A43 [NASA ADS] [CrossRef] [EDP Sciences] [Google Scholar]
- Cho, J., Lazarian, A., & Vishniac, E. T. 2003, MHD Turbulence: Scaling Laws and Astrophysical Implications, eds. E. Falgarone & T. Passot, Lect. Notes Phys., 614, 56 [NASA ADS] [CrossRef] [Google Scholar]
- Ciesla, F. J. 2010, ApJ, 723, 514 [NASA ADS] [CrossRef] [Google Scholar]
- Ciesla, F. J. 2011, ApJ, 740, 9 [NASA ADS] [CrossRef] [Google Scholar]
- Ciesla, F. J., & Cuzzi, J. N. 2006, Icarus, 181, 178 [NASA ADS] [CrossRef] [Google Scholar]
- Drążkowska, J., & Alibert, Y. 2017, A&A, 608, A92 [NASA ADS] [CrossRef] [EDP Sciences] [Google Scholar]
- Dubrulle, B., Morfill, G., & Sterzik, M. 1995, Icarus, 114, 237 [NASA ADS] [CrossRef] [Google Scholar]
- Elbakyan, V. G., Johansen, A., Lambrechts, M., Akimkin, V., & Vorobyov, E. I. 2020, A&A, 637, A5 [CrossRef] [EDP Sciences] [Google Scholar]
- Fromang, S., & Papaloizou, J. 2006, A&A, 452, 751 [NASA ADS] [CrossRef] [EDP Sciences] [Google Scholar]
- Garaud, P. 2007, ApJ, 671, 2091 [NASA ADS] [CrossRef] [Google Scholar]
- Gole, D. A., Simon, J. B., Li, R., Youdin, A. N., & Armitage, P. J. 2020, ApJ, 904, 132 [CrossRef] [Google Scholar]
- Gonzalez, J. F., Laibe, G., & Maddison, S. T. 2017, MNRAS, 467, 1984 [NASA ADS] [Google Scholar]
- Gundlach, B., Schmidt, K. P., Kreuzig, C., et al. 2018, MNRAS, 479, 1273 [NASA ADS] [CrossRef] [Google Scholar]
- Hasegawa, Y., Okuzumi, S., Flock, M., & Turner, N. J. 2017, ApJ, 845, 31 [NASA ADS] [CrossRef] [Google Scholar]
- Hyodo, R., Ida, S., & Charnoz, S. 2019, A&A, 629, A90 [NASA ADS] [CrossRef] [EDP Sciences] [Google Scholar]
- Hyodo, R., Guillot, T., Ida, S., Okuzumi, S., & Youdin, A. N. 2021a, A&A, 646, A14 (Paper II) [EDP Sciences] [Google Scholar]
- Hyodo, R., Ida, S., & Guillot, T. 2021b, A&A, 645, L9 [CrossRef] [EDP Sciences] [Google Scholar]
- Ida, S., & Guillot, T. 2016, A&A, 596, L3 [Google Scholar]
- Ida, S., & Lin,D. N. C. 2008, ApJ, 685, 584 [NASA ADS] [CrossRef] [Google Scholar]
- Ida, S., Guillot, T., & Morbidelli, A. 2016, A&A, 591, A72 [NASA ADS] [CrossRef] [EDP Sciences] [Google Scholar]
- Johansen, A., Youdin, A., & Mac Low M.-M. 2009, ApJ, 704, L75 [NASA ADS] [CrossRef] [Google Scholar]
- Kanagawa, K. D., Ueda, T., Muto, T., & Okuzumi, S. 2017, ApJ, 844, 142 [NASA ADS] [CrossRef] [Google Scholar]
- Kimura, H., Wada, K., Senshu, H., & Kobayashi, H. 2015, ApJ, 812, 67 [NASA ADS] [CrossRef] [Google Scholar]
- Kretke, K. A., & Lin, D. N. C. 2007, ApJ, 664, L55 [NASA ADS] [CrossRef] [Google Scholar]
- Krijt, S., Ormel, C. W., Dominik, C., & Tielens, A. G. G. M. 2016, A&A, 586, A20 [NASA ADS] [CrossRef] [EDP Sciences] [Google Scholar]
- Kunitomo, M., Guillot, T., Ida, S., & Takeuchi, T. 2018, A&A, 618, A132 [NASA ADS] [CrossRef] [EDP Sciences] [Google Scholar]
- Laibe, G., & Price, D. J. 2014, MNRAS, 440, 2136 [NASA ADS] [CrossRef] [Google Scholar]
- Lambrechts, M., Johansen, A., & Morbidelli, A. 2014, A&A, 572, A35 [NASA ADS] [CrossRef] [EDP Sciences] [Google Scholar]
- Lin, M.-K., & Youdin, A. N. 2017, ApJ, 849, 129 [NASA ADS] [CrossRef] [Google Scholar]
- Morbidelli, A., Lambrechts, M., Jacobson, S., & Bitsch, B. 2015, Icarus, 258, 418 [NASA ADS] [CrossRef] [Google Scholar]
- Mousis, O., Ronnet, T., & Lunine, J. I. 2019, ApJ, 875, 9 [CrossRef] [Google Scholar]
- Musiolik, G., & Wurm, G. 2019, ApJ, 873, 58 [NASA ADS] [CrossRef] [Google Scholar]
- Okuzumi, S., Tanaka, H., Kobayashi, H., & Wada, K. 2012, ApJ, 752, 106 [NASA ADS] [CrossRef] [Google Scholar]
- Ros, K., & Johansen, A. 2013, A&A, 552, A137 [NASA ADS] [CrossRef] [EDP Sciences] [Google Scholar]
- Saito, E., & Sirono, S.-i. 2011, ApJ, 728, 20 [NASA ADS] [CrossRef] [Google Scholar]
- Sato, T., Okuzumi, S., & Ida, S. 2016, A&A, 589, A15 [NASA ADS] [CrossRef] [EDP Sciences] [Google Scholar]
- Schoonenberg, D., & Ormel, C. W. 2017, A&A, 602, A21 [NASA ADS] [CrossRef] [EDP Sciences] [Google Scholar]
- Steinpilz, T., Teiser, J., & Wurm, G. 2019, ApJ, 874, 60 [NASA ADS] [CrossRef] [Google Scholar]
- Stevenson, D. J., & Lunine, J. I. 1988, Icarus, 75, 146 [NASA ADS] [CrossRef] [Google Scholar]
- Suzuki, T. K., Ogihara, M., Morbidelli, A., Crida, A., & Guillot, T. 2016, A&A, 596, A74 [NASA ADS] [CrossRef] [EDP Sciences] [Google Scholar]
- Vericel, A., & Gonzalez, J. F. 2019, SF2A-2019: Proceedings of the Annual meeting of the French Society of Astronomy and Astrophysics, eds. P. Di Matteo, O. Creevey, A. Crida, et al. [Google Scholar]
- Wada, K., Tanaka, H., Suyama, T., Kimura, H., & Yamamoto, T. 2011, ApJ, 737, 36 [NASA ADS] [CrossRef] [Google Scholar]
- Wada, K., Tanaka, H., Okuzumi, S., et al. 2013, A&A, 559, A62 [NASA ADS] [CrossRef] [EDP Sciences] [Google Scholar]
- Weidenschilling, S. J. 1977, MNRAS, 180, 57 [Google Scholar]
- Weidling, R., Güttler, C., & Blum, J. 2012, Icarus, 218, 688 [NASA ADS] [CrossRef] [Google Scholar]
- Yang, C. C., Johansen, A., & Carrera, D. 2017, A&A, 606, A80 [NASA ADS] [CrossRef] [EDP Sciences] [Google Scholar]
- Yang, C.-C., Mac Low, M.-M., & Johansen, A. 2018, ApJ, 868, 27 [NASA ADS] [CrossRef] [Google Scholar]
- Youdin, A. N., & Goodman, J. 2005, ApJ, 620, 459 [NASA ADS] [CrossRef] [Google Scholar]
- Youdin, A. N., & Lithwick, Y. 2007, Icarus, 192, 588 [NASA ADS] [CrossRef] [Google Scholar]
- Zhu, Z., Stone, J. M., & Bai, X.-N. 2015, ApJ, 801, 81 [NASA ADS] [CrossRef] [Google Scholar]
- Zsom, A., Ormel, C. W., Güttler, C., Blum, J., & Dullemond, C. P. 2010, A&A, 513, A57 [NASA ADS] [CrossRef] [EDP Sciences] [Google Scholar]
- Zsom, A., Sándor, Z., & Dullemond, C. P. 2011, A&A, 527, A10 [NASA ADS] [CrossRef] [EDP Sciences] [Google Scholar]
Our subsequent papers, Hyodo et al. (2021a, referred to as Paper II) and Hyodo et al. (2021b), investigate pile-ups of both icy pebble and silicate dust particles.
All Tables
All Figures
|
Fig. 1 Histogram of the time-dependent values of Fp/g ≡Ṁp∕Ṁg, the ratio of the pebble to gas mass flux at the inner boundary of three protoplanetary disks (models L, M and S, respectively) from Elbakyan et al. (2020). For this setting, irregularities in the radial and azimuthal structures of the disks yield a highly time-dependent Fp/g value. |
| In the text | |
|
Fig. 2 Snapshots of particle distribution (red dots) on the x-z plane at time t = 104Ω−1, and the root mean square of z (blue solid curve) as a function of the radial direction x (centeredon the snow line location and in units of the gas pressure scale height Hg). We plot ∣z∣, while z takes either positive or negative values. We set αacc = 10−2, αD r = 0 and τs = 10−3. The vertical mixing parameter in each panel is (a) αDz = 10−5, (b) αD z = 10−3, and (c) αDz = 10−1. The analytical estimates of the equilibrium particle scale height for each αDz are shown by the dashed green lines. The back reactions are not included for vr (Λ = 1) and αD z (K = 0). We injected the particles in the range of x = [−0.05, 0.05]Hg and z = [−0.1, 0.1]Hg. |
| In the text | |
|
Fig. 3 Time evolution of the maximum ρd∕ρg. The back reaction to vr is included in the results in panel b, but not in panel a. The light blue, magenta, blue, green, and red curves are the results with Fp/g = 0.025, 0.05, 0.1, 0.2, 0.4, and 0.8, respectively. The other parameters are fixed as αacc = 10−2 and Δxsubl = 0.1Hg and Δzsubl = 0.03Hg. To mimic the settings of Ida & Guillot (2016), we artificiallly set αDr = 0, αD z = 10−5 and τs,d = 10−2 (however, the relatively large τs,d for the silicate dust is not reflected to the dust drift speed). The latter two parameters maintain Hd = Δzsubl. The circles in panel a represent the analytical solution given by Eq. (31). That in panel b is the analytical solution for non-divergent case (Fp/g = 0.025) given by Eq. (15). |
| In the text | |
|
Fig. 4 Snapshots of silicate particles at t = 104 Ω−1 (red dots), and the root mean square of z (blue solid curves) at each grid of x. The dashed blue curves are given by Eq. (35) with Δxsubl replaced by max(Δxsubl, |x|) (see thediscussion at the end of Sect. 4.3.2). The magenta curve represents log10 (ρd∕ρg) near the midplane. We set αacc = 10−2, τs,d = 10−5, and fd/p = 0.5, and Ṁg = 10−8M⊙ yr−1. The nine panels adopt different values of Fp/g and αD z = αDr, as indicated in each panel. |
| In the text | |
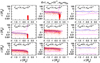 |
Fig. 5 Same as Fig. 4, except for K = 1. |
| In the text | |
|
Fig. 6 Time evolution of |
| In the text | |
|
Fig. 7 Maximum ρd∕ρg and Hd ∕Hg at the maximum ρd∕ρg locations at t = 15000 Ω−1 as a functionof αDz = αDr for different Fp/g. The back reaction to diffusion is included with K = 1 in panel b, but not (K = 0) in panel a. The other parameters are fixed as αacc = 10−2, Δxsubl= 0.1Hg, and ΔzsublHp given by Eq. (19). Upper and bottom panels: the red dashed curves are the analytical formulas given by Eqs. (3) and (35) with Eq. (36). Lower panels: the green dashed lines represent Δzsubl ∕Hg. |
| In the text | |
|
Fig. 8 Same as Fig. 7, except for αDz∕αDr relations and the value of Δxsubl. The maximum ρd∕ρg and hd/g (= Hd ∕Hg) for different Fp/g are given as functions of (a) αD r = αDz with Δxsubl = 0.1 Hg, which is the same as Fig. 7b, for comparison, (b) αD r = αDz with Δxsubl = Hg, (c) αD z with αDr = 10−4 and Δxsubl = 0.1 Hg, and (d) αD r with αDz = 10−4 and Δxsubl = 0.1 Hg. For all the cases, K = 1 is adopted. Upper and bottom panels: the red dashed curves are the analytical formulas given by Eqs. (35) and (3) with corresponding parameter values. |
| In the text | |
|
Fig. 9 Contour maps of the maximum ρd∕ρg on the plane of αDz∕αacc(= αDr∕αacc) and Fp/g with (a) Δxsubl= 0.1 Hg, and (b) Δxsubl given by Eq. (41). In both cases, αacc = 10−2 and K = 1 are adopted. Left panels: results of Monte Carlo simulations at t = 15 000 Ω−1, and right ones: results after using analytical formulas given by Eq. (3) with Eqs. (35), (36), (4), and the corresponding Δxsubl. The Monte Carlo simulations were performed with a grid size of Δlog10(αDz∕αacc) = Δlog10Fp/g = 0.2. We used more refined grids to make the maps by the analytical formulas. The color scales are based on log10 (ρd∕ρg). |
| In the text | |
Current usage metrics show cumulative count of Article Views (full-text article views including HTML views, PDF and ePub downloads, according to the available data) and Abstracts Views on Vision4Press platform.
Data correspond to usage on the plateform after 2015. The current usage metrics is available 48-96 hours after online publication and is updated daily on week days.
Initial download of the metrics may take a while.