Fig. 6
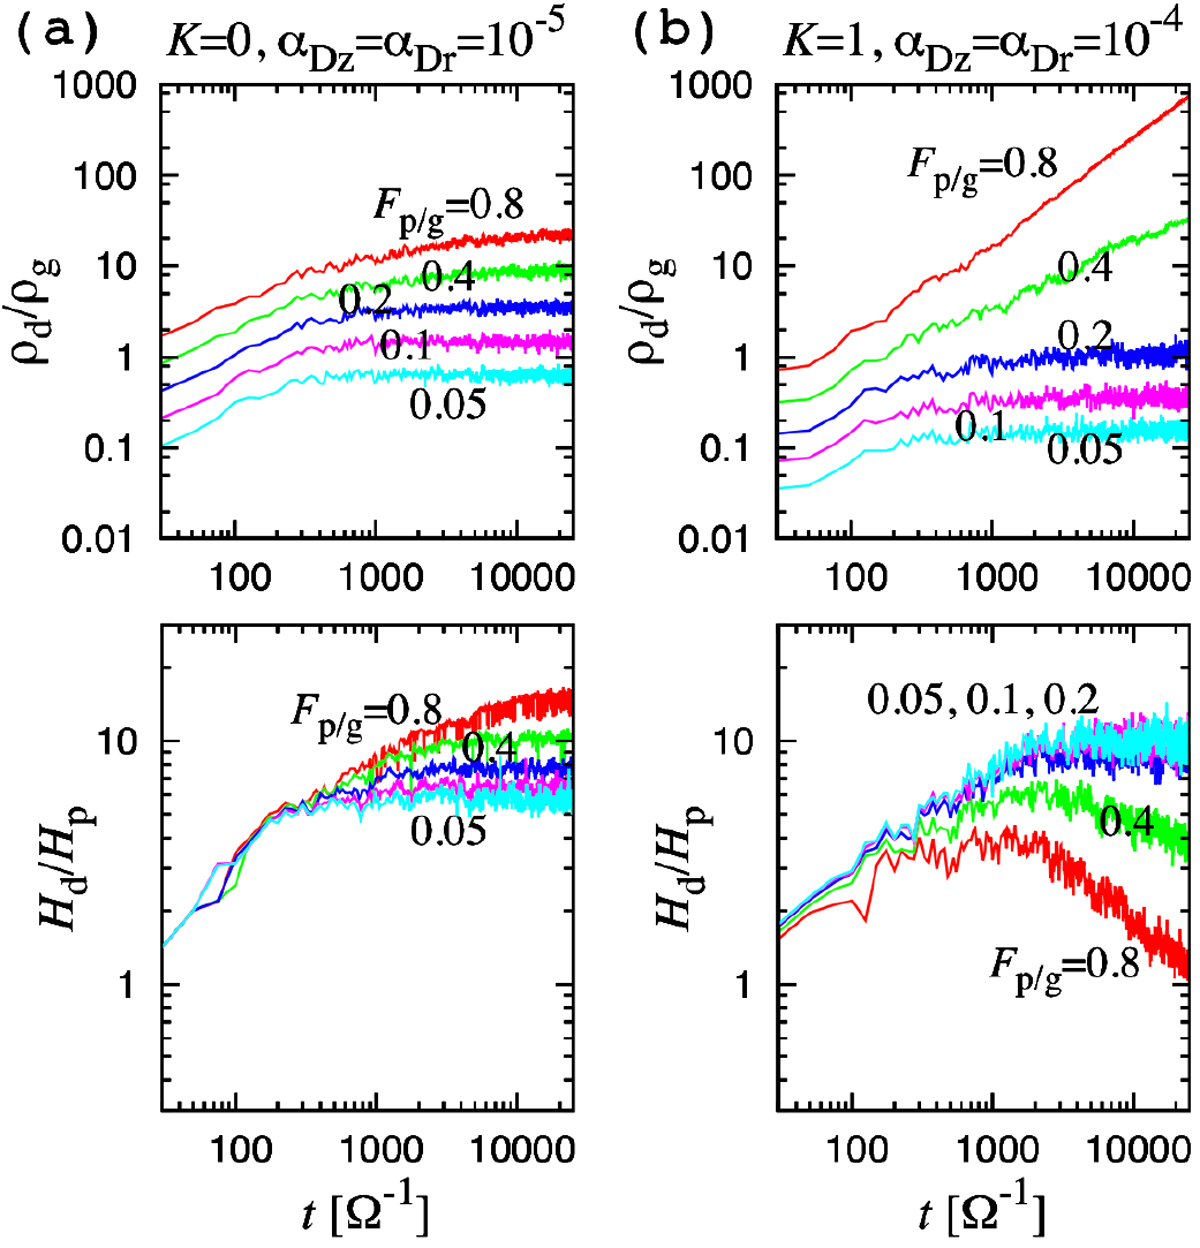
Time evolution of ![]() and the dust scale height at the maximum ρd∕ρg locations scaled by the initial one (= Hp). The back reaction to diffusion is included with K = 1 in panel b, but not (K = 0) in panel a, while the back reaction to vr is included in both panels a and b. The light blue, magenta, blue, green, and red curves are the results with Fp/g = 0.05, 0.1, 0.2, 0.4 and 0.8, respectively. The other parameters are fixed as αacc = 10−2, Δxsubl= 0.1, and Δzsubl = 0.03. The diffusion parameters are αDz = αDr = 10−5 in panel a and αDz = αDr = 10−4 in panel b.
and the dust scale height at the maximum ρd∕ρg locations scaled by the initial one (= Hp). The back reaction to diffusion is included with K = 1 in panel b, but not (K = 0) in panel a, while the back reaction to vr is included in both panels a and b. The light blue, magenta, blue, green, and red curves are the results with Fp/g = 0.05, 0.1, 0.2, 0.4 and 0.8, respectively. The other parameters are fixed as αacc = 10−2, Δxsubl= 0.1, and Δzsubl = 0.03. The diffusion parameters are αDz = αDr = 10−5 in panel a and αDz = αDr = 10−4 in panel b.
Current usage metrics show cumulative count of Article Views (full-text article views including HTML views, PDF and ePub downloads, according to the available data) and Abstracts Views on Vision4Press platform.
Data correspond to usage on the plateform after 2015. The current usage metrics is available 48-96 hours after online publication and is updated daily on week days.
Initial download of the metrics may take a while.