Fig. 7
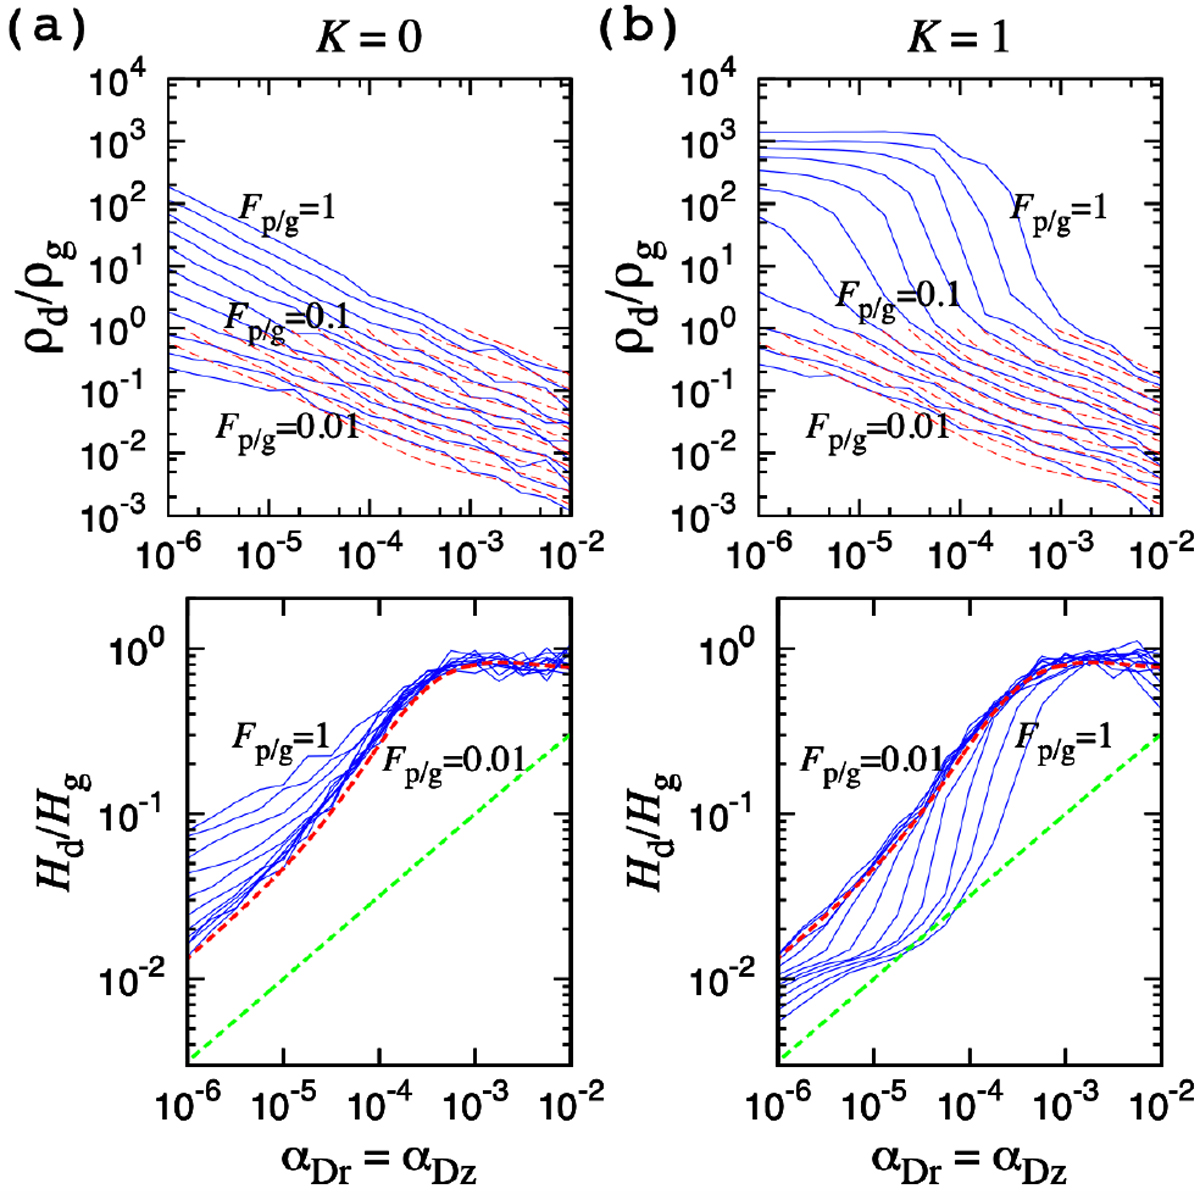
Maximum ρd∕ρg and Hd ∕Hg at the maximum ρd∕ρg locations at t = 15000 Ω−1 as a functionof αDz = αDr for different Fp/g. The back reaction to diffusion is included with K = 1 in panel b, but not (K = 0) in panel a. The other parameters are fixed as αacc = 10−2, Δxsubl= 0.1Hg, and ΔzsublHp given by Eq. (19). Upper and bottom panels: the red dashed curves are the analytical formulas given by Eqs. (3) and (35) with Eq. (36). Lower panels: the green dashed lines represent Δzsubl ∕Hg.
Current usage metrics show cumulative count of Article Views (full-text article views including HTML views, PDF and ePub downloads, according to the available data) and Abstracts Views on Vision4Press platform.
Data correspond to usage on the plateform after 2015. The current usage metrics is available 48-96 hours after online publication and is updated daily on week days.
Initial download of the metrics may take a while.