Fig. 3
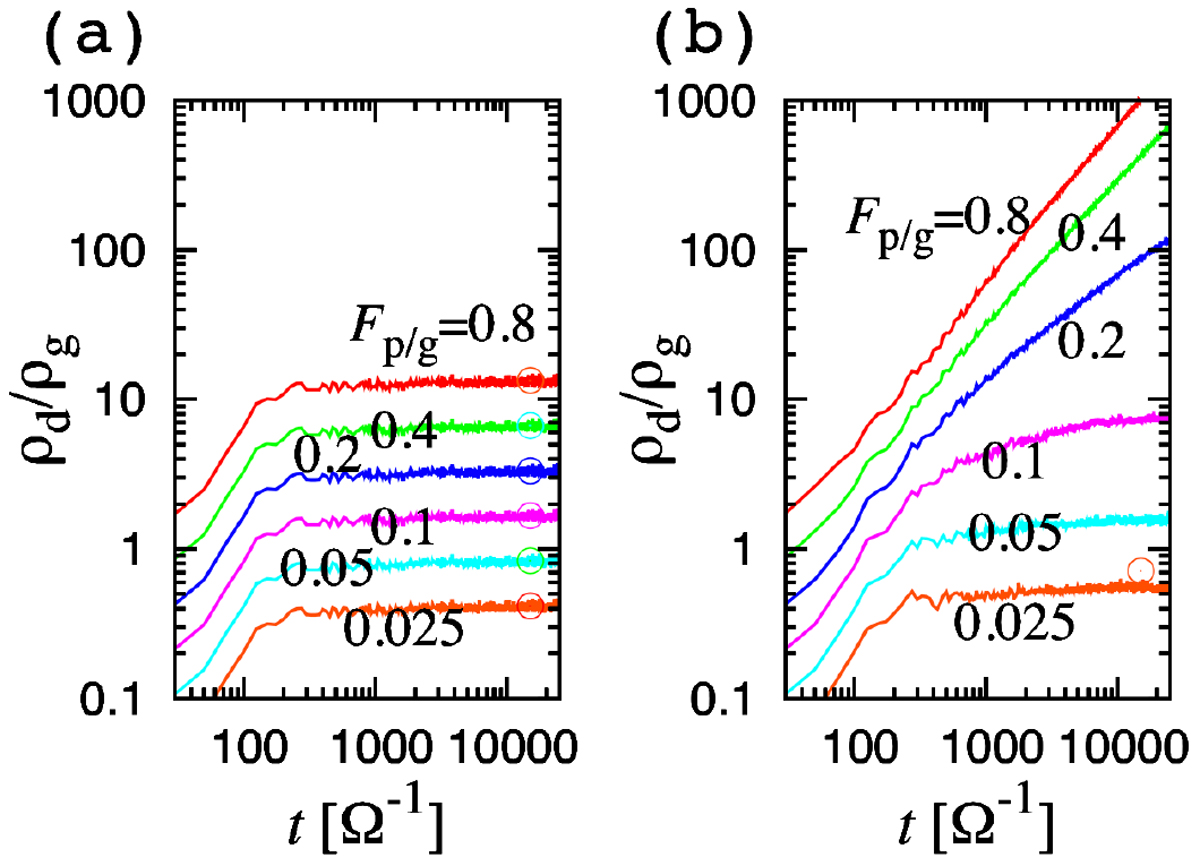
Time evolution of the maximum ρd∕ρg. The back reaction to vr is included in the results in panel b, but not in panel a. The light blue, magenta, blue, green, and red curves are the results with Fp/g = 0.025, 0.05, 0.1, 0.2, 0.4, and 0.8, respectively. The other parameters are fixed as αacc = 10−2 and Δxsubl = 0.1Hg and Δzsubl = 0.03Hg. To mimic the settings of Ida & Guillot (2016), we artificiallly set αDr = 0, αD z = 10−5 and τs,d = 10−2 (however, the relatively large τs,d for the silicate dust is not reflected to the dust drift speed). The latter two parameters maintain Hd = Δzsubl. The circles in panel a represent the analytical solution given by Eq. (31). That in panel b is the analytical solution for non-divergent case (Fp/g = 0.025) given by Eq. (15).
Current usage metrics show cumulative count of Article Views (full-text article views including HTML views, PDF and ePub downloads, according to the available data) and Abstracts Views on Vision4Press platform.
Data correspond to usage on the plateform after 2015. The current usage metrics is available 48-96 hours after online publication and is updated daily on week days.
Initial download of the metrics may take a while.