Fig. 9
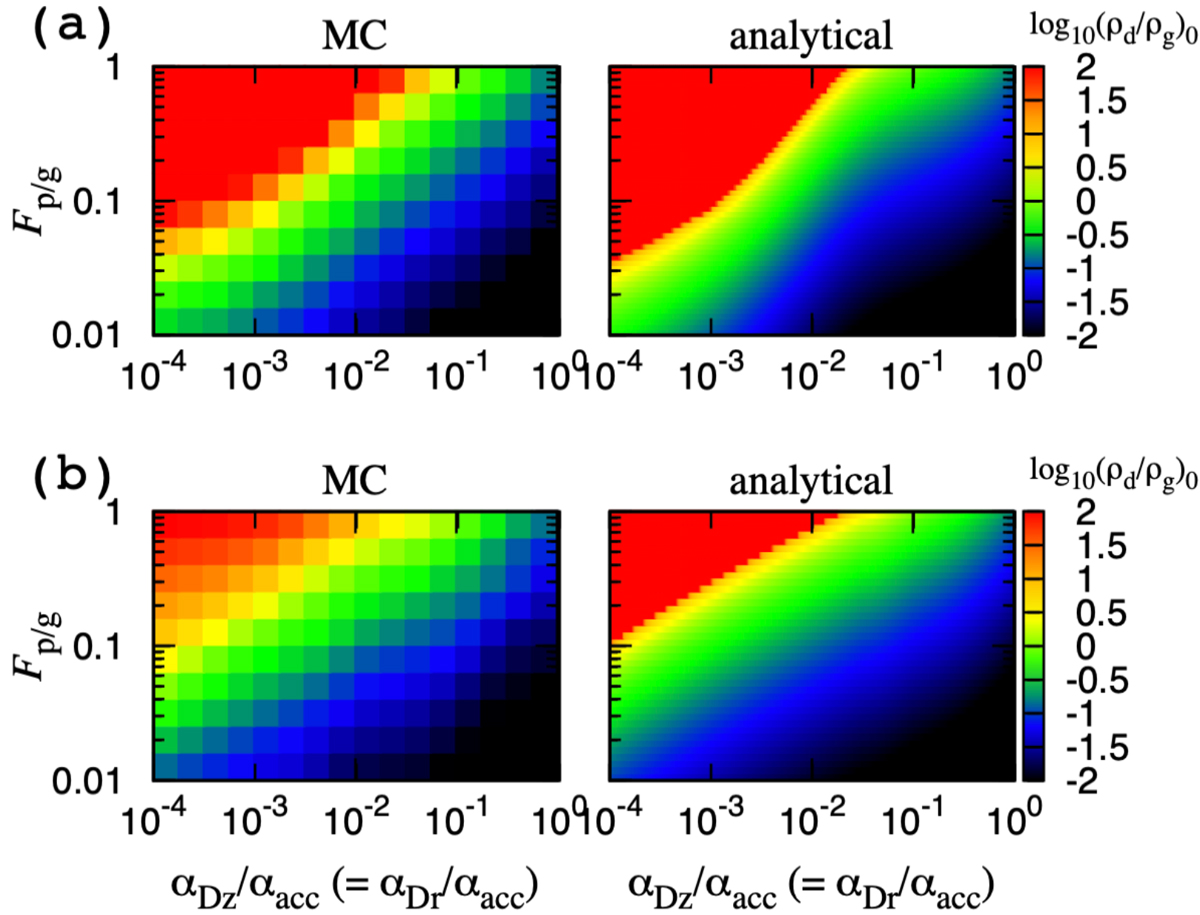
Contour maps of the maximum ρd∕ρg on the plane of αDz∕αacc(= αDr∕αacc) and Fp/g with (a) Δxsubl= 0.1 Hg, and (b) Δxsubl given by Eq. (41). In both cases, αacc = 10−2 and K = 1 are adopted. Left panels: results of Monte Carlo simulations at t = 15 000 Ω−1, and right ones: results after using analytical formulas given by Eq. (3) with Eqs. (35), (36), (4), and the corresponding Δxsubl. The Monte Carlo simulations were performed with a grid size of Δlog10(αDz∕αacc) = Δlog10Fp/g = 0.2. We used more refined grids to make the maps by the analytical formulas. The color scales are based on log10 (ρd∕ρg).
Current usage metrics show cumulative count of Article Views (full-text article views including HTML views, PDF and ePub downloads, according to the available data) and Abstracts Views on Vision4Press platform.
Data correspond to usage on the plateform after 2015. The current usage metrics is available 48-96 hours after online publication and is updated daily on week days.
Initial download of the metrics may take a while.