Fig. 4
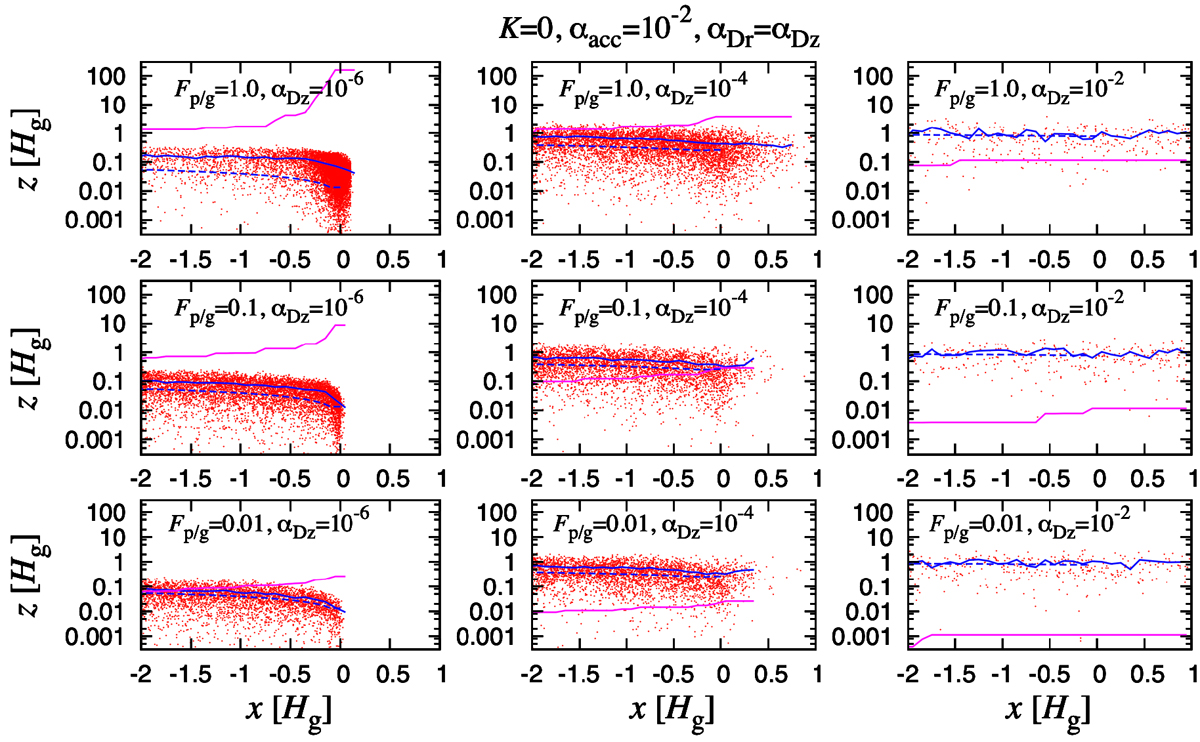
Snapshots of silicate particles at t = 104 Ω−1 (red dots), and the root mean square of z (blue solid curves) at each grid of x. The dashed blue curves are given by Eq. (35) with Δxsubl replaced by max(Δxsubl, |x|) (see thediscussion at the end of Sect. 4.3.2). The magenta curve represents log10 (ρd∕ρg) near the midplane. We set αacc = 10−2, τs,d = 10−5, and fd/p = 0.5, and Ṁg = 10−8M⊙ yr−1. The nine panels adopt different values of Fp/g and αD z = αDr, as indicated in each panel.
Current usage metrics show cumulative count of Article Views (full-text article views including HTML views, PDF and ePub downloads, according to the available data) and Abstracts Views on Vision4Press platform.
Data correspond to usage on the plateform after 2015. The current usage metrics is available 48-96 hours after online publication and is updated daily on week days.
Initial download of the metrics may take a while.