Fig. 2
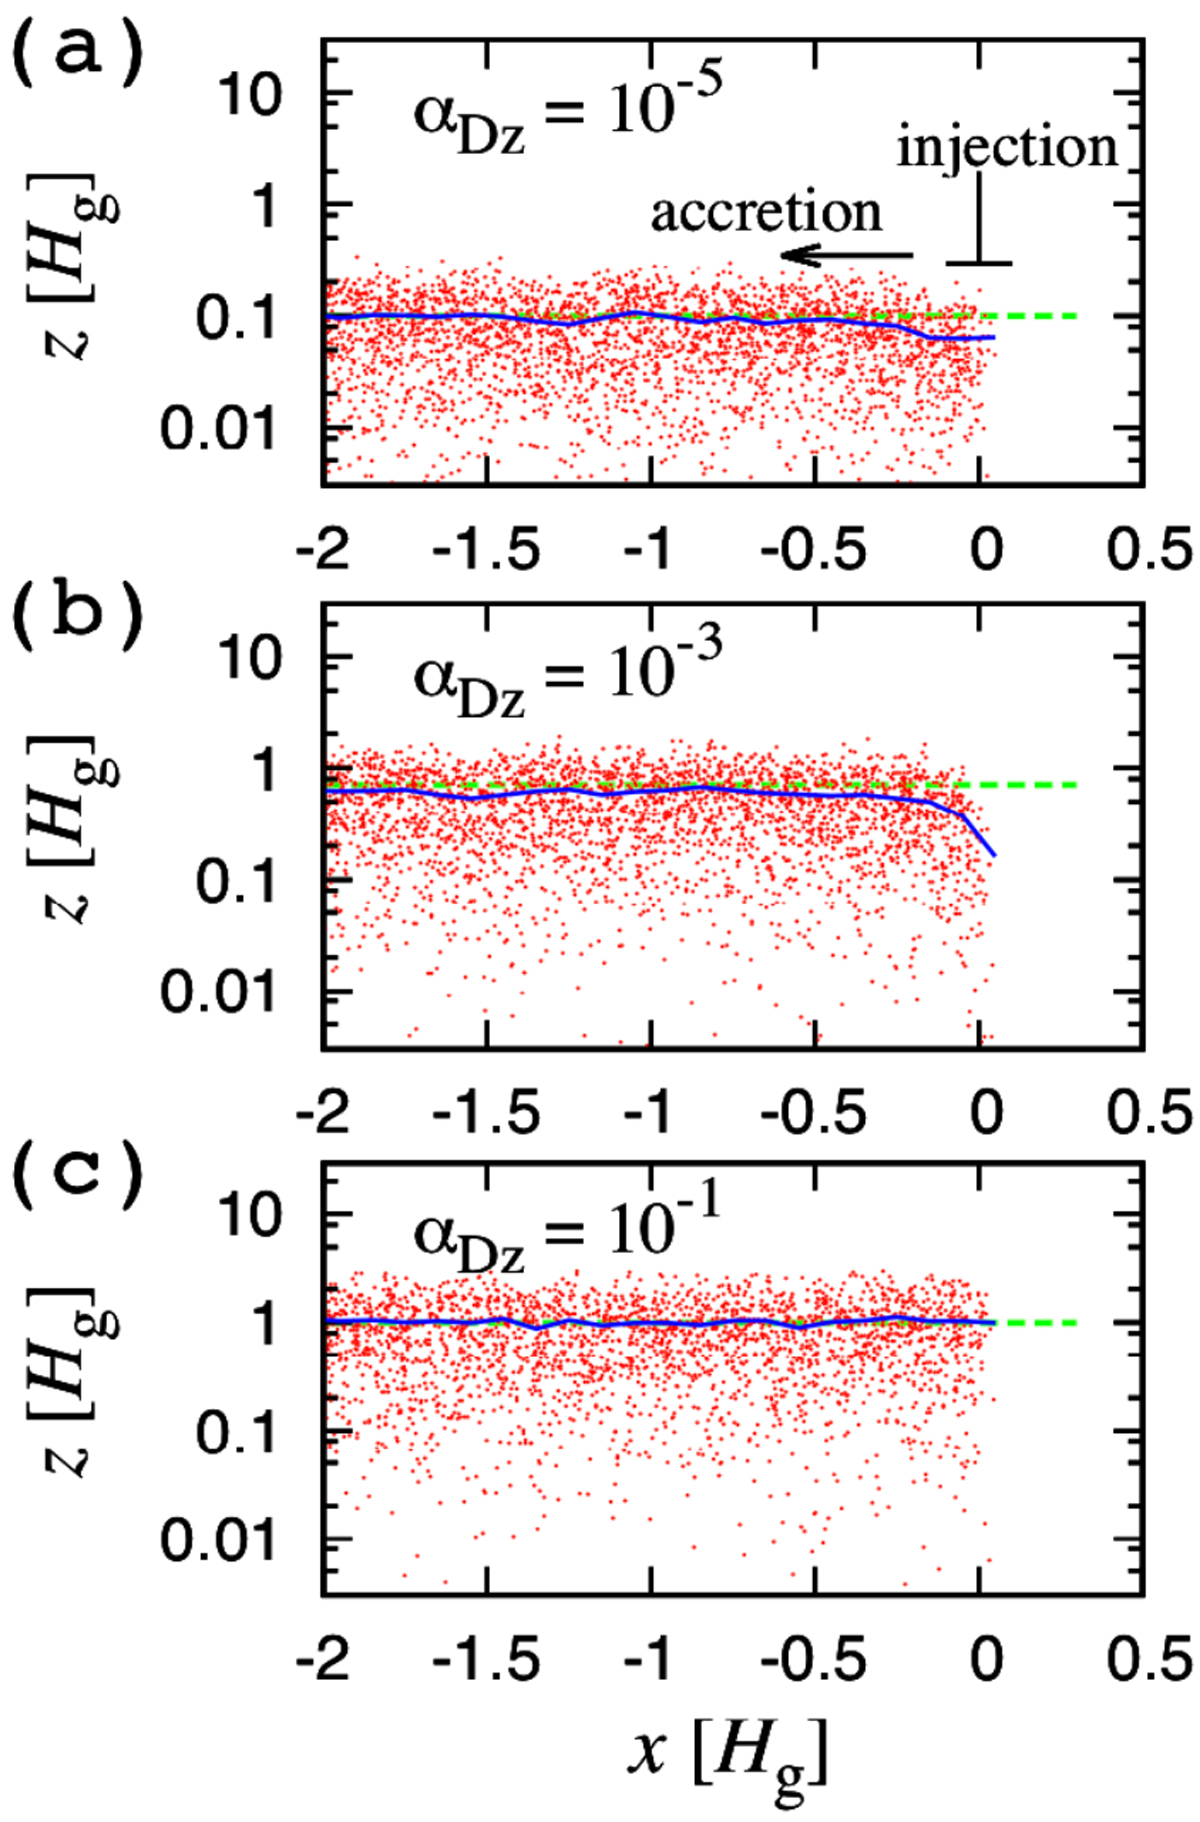
Snapshots of particle distribution (red dots) on the x-z plane at time t = 104Ω−1, and the root mean square of z (blue solid curve) as a function of the radial direction x (centeredon the snow line location and in units of the gas pressure scale height Hg). We plot ∣z∣, while z takes either positive or negative values. We set αacc = 10−2, αD r = 0 and τs = 10−3. The vertical mixing parameter in each panel is (a) αDz = 10−5, (b) αD z = 10−3, and (c) αDz = 10−1. The analytical estimates of the equilibrium particle scale height for each αDz are shown by the dashed green lines. The back reactions are not included for vr (Λ = 1) and αD z (K = 0). We injected the particles in the range of x = [−0.05, 0.05]Hg and z = [−0.1, 0.1]Hg.
Current usage metrics show cumulative count of Article Views (full-text article views including HTML views, PDF and ePub downloads, according to the available data) and Abstracts Views on Vision4Press platform.
Data correspond to usage on the plateform after 2015. The current usage metrics is available 48-96 hours after online publication and is updated daily on week days.
Initial download of the metrics may take a while.