| Issue |
A&A
Volume 646, February 2021
|
|
|---|---|---|
| Article Number | A50 | |
| Number of page(s) | 9 | |
| Section | Extragalactic astronomy | |
| DOI | https://doi.org/10.1051/0004-6361/202039349 | |
| Published online | 04 February 2021 | |
10.4 m GTC observations of the nearby VHE-detected GRB 190829A/SN 2019oyw⋆
1
Instituto de Astrofísica de Andalucía (IAA-CSIC), Glorieta de la Astronomía s/n, 18008 Granada, Spain
e-mail: This email address is being protected from spambots. You need JavaScript enabled to view it.
2
Universidad de Granada, Facultad de Ciencias Campus Fuentenueva s/n, 18071 Granada, Spain
3
Departamento de Ingeniería de Sistemas y Automática, Escuela de Ingenierías, Universidad de Málaga, C. Dr. Ortiz Ramos s/n, 29071 Málaga, Spain
4
Aryabhatta Research Institute of Observational Sciences (ARIES), Manora Peak, Nainital 263002, India
5
School of Studies in Physics and Astrophysics, Pandit Ravishankar Shukla University, Chattisgarh 492 010, India
6
Department of Physics, Deen Dayal Upadhyaya Gorakhpur University, Gorakhpur 273009, India
7
Special Astrophysical Observatory of Russian Academy of Sciences, Nizhniy Arkhyz, Russia
8
Crimean Astrophysical Observatory, Russian Academy of Sciences, Nauchnyi 298409, Russia
9
Departamento de Álgebra, Geometría y Topología, Facultad de Ciencias, Universidad de Málaga, Campus de Teatinos s/n, 29071 Málaga, Spain
10
Astronomical Institute, Academy of Sciences of the Czech Republic, Boční II 1401, 141 00 Prague, Czech Republic
11
Mykolaiv National University, Astronomical Observatory, Mykolaiv, Ukraine
12
Research Institute, Mykolaiv Astronomical Observatory, Mykolaiv, Ukraine
13
School of Physics, O’Brien Centre for Science North, University College Dublin, Belfield, Dublin 4, Ireland
14
School of Physics and Astronomy, University of Birmingham, B15 2TT Birmingham, UK
15
INAF, Astrophysics and Space Science Observatory, Via P. Gobetti 101, 40129 Bologna, Italy
16
INAF, Istituto di Astrofisica e Planetologia Spaziali, Via Fosso del Cavaliere 100, 00133 Rome, Italy
17
School of Astronomy and Space Science, Nanjing University, Nanjing 210093, PR China
18
Key Laboratory of Modern Astronomy and Astrophysics (Nanjing University), Ministry of Education, Nanjing, PR China
Received:
6
September
2020
Accepted:
15
November
2020
Abstract
Aims. Gamma-ray burst (GRB) 190829A (z = 0.0785) was detected by Fermi and Swift and also at very high energy (VHE) by the High-Energy Stereoscopic System (H.E.S.S.) telescopes. The prompt emission displayed two emission episodes separated by a quiescent gap of ∼40 s. We present the 10.4 m Gran Telescopio Canarias (GTC) observations of the afterglow of GRB 190829A and its underlying supernova. We also compare GRB 190829A to GRB 180728A, a GRB with similar behaviour, and discuss the implications on underlying physical mechanisms producing these two GRBs.
Methods. We present multi-band photometric data along with spectroscopic follow-up observations taken with the 10.4 m GTC telescope. Together with the data from the prompt emission, the 10.4 m GTC data are used to understand the emission mechanisms and possible progenitor.
Results. A detailed analysis of the multi-band observations of the afterglow requires the cooling frequency to pass between the optical and X-ray bands at early epochs. The afterglow then transitions to the underlying supernova (SN) 2019oyw, which dominates later on.
Conclusions. Although the prompt emission temporal properties of GRB 190829A and GRB 180728A are similar, the two pulses are different in the spectral domain. We find that SN 2019oyw associated with GRB 190829A is powered by Ni decay and is a Type Ic-BL SN. The spectroscopic and photometric properties of this SN are consistent with those observed for SN 1998bw, but evolved earlier.
Key words: gamma-ray burst: general / gamma-ray burst: individual: GRB 190829A / supernovae: individual: SN 2019oyw
The reduced spectra are only available at the CDS via anonymous ftp to cdsarc.u-strasbg.fr (130.79.128.5) or via http://cdsarc.u-strasbg.fr/viz-bin/cat/J/A+A/646/A50
© ESO 2021
1. Introduction
Multiwavelength observations of nearby (redshift z ≤ 0.2) long-duration gamma-ray bursts (GRBs) and their association with Type Ic supernovae with broad lines (Type Ic-BL SNe) have revolutionised our understanding of the explosion mechanisms and environments of massive stars across the electromagnetic spectrum (Woosley 1993; Hjorth & Bloom 2012). Some of these nearby GRBs also belong to the classes of low/intermediate-luminosity GRBs and ultra long-duration GRBs, which are outliers that have revealed crucial observational evidence that is used to distinguish between potential powering mechanisms and progenitors (Georgy et al. 2009; Dessart et al. 2017). As underlying SN features are faint and diluted by their host galaxies, 8–10 m class optical–near-infrared (NIR) facilities play a vital role in extracting information (Pandey 2013; Cano et al. 2014). So far, only a handful of nearby GRBs have been found to have associated Ic-BL SNe: GRB 980425/SN 1998bw (z = 0.00867; Galama et al. 1999), GRB 030329/SN 2003dh (z = 0.16867; Stanek et al. 2003), GRB 031203/SN 2003lw (z = 0.10536; Malesani et al. 2004), GRB 060218/SN 2006aj (z = 0.03342; Mirabal et al. 2006; Modjaz et al. 2006), GRB 100316D/SN 2010bh (z = 0.0592; Chornock et al. 2010), GRB 130702A/SN 2013dx (z = 0.145; D’Elia et al. 2015), GRB 171205A/SN 2017iuk (z = 0.0368; Izzo et al. 2019), and GRB 180728A/SN 2018fip (z = 0.117; Izzo et al. 2018).
GRB 190829A belongs to a subclass of long bursts whose prompt emission light curves show double episodes: the first being a fainter, harder pulse (a precursor), and the second, following a quiescent phase, being a significantly brighter and softer main pulse (Chand et al. 2020; Coppin et al. 2020). These events provide a unique opportunity to probe deeper into the nature of the central engine of GRBs (Hu et al. 2014; Chand et al. 2020; Fraija et al. 2020) emitting even at very high energy (VHE; de Naurois & H. E. S. S. Collaboration 2019; Sahu & Fortín 2020). The proximity of GRB 190829A also provided the opportunity to discover the underlying SN (Bolmer et al. 2019; Lipunov et al. 2019a; Perley & Cockeram 2019; Terreran et al. 2019; Dichiara et al., in prep.), posing the natural question of whether such double-episodic prompt emission GRBs have a particular connection with progenitor models invoking SN features (Woosley & Bloom 2006; Davies et al. 2007). In the Fermi era, Lan et al. (2018) studied a large sample (101) of such GRBs. Among these, there are only 11 bursts with known redshifts. In this sample, GRB 180728A is the nearest burst (z = 0.117) also found to be associated with SN 2018fip (Izzo et al. 2018; Selsing et al. 2018; Wang et al. 2019) and exhibiting remarkable similarity with the properties of GRB 190829A. Therefore, observed prompt emission properties with a significant quiescent temporal gap at Swift/BAT and Fermi/GBM frequencies for these two nearby and SN-connected GRBs prompted us to perform a joint prompt emission analysis using a sophisticated tool, the Multi-Mission Maximum Likelihood framework (3ML1) to explore their prompt spectral properties systematically.
Very high energy photons from GRB 190829A were detected by the High Energy Stereoscopic System (H.E.S.S.; de Naurois & H. E. S. S. Collaboration 2019) making this burst the nearest to be seen at these high frequencies. Many ground-based telescopes searched for counterparts soon after the Swift and Fermi gamma-ray detection and follow-up observations at other wavelengths were reported. Using the 10.4 m Gran Telescopio Canarias (GTC, Canary Islands, Spain) optical-NIR observations and a redshift of z = 0.0785 ± 0.005 were reported (Valeev et al. 2019), thus triggering larger facilities to follow up the event. This follow-up later lead to the discovery of the re-brightening of the underlying transient AT 2019oyw/SN 2019oyw (de Ugarte Postigo et al. 2019; Lipunov et al. 2019b; Terreran et al. 2019; Volnova et al. 2019). Afterglow observations at radio frequencies were also reported by Chandra (2019), Laskar et al. (2019), and Rhodes et al. (2020).
In this paper, we present the analysis of the prompt emission properties of GRB 190829A and GRB 180728A. We also discuss our late-time photometric and spectroscopic observations of GRB 190829A/SN 2019oyw using the 10.4 m GTC telescope and their comparison with other well-studied similar events. This paper is organised as follows. In Sect. 2, we present the prompt observations and data analysis of GRB 190829A and GRB 180728A. We then focus on the optical spectroscopic observations of GRB 190829A and their analysis in Sect. 3. In Sect. 4, we present the optical photometric observations of GRB 190829A. Finally, we discuss and conclude in Sect. 5. All the uncertainties are quoted at the 1σ level throughout this paper, unless otherwise mentioned. We assume the Hubble constant H0 = 70 km s−1 Mpc−1 and density parameters ΩΛ = 0.73 and Ωm = 0.27 (Jarosik et al. 2011).
2. Prompt emission properties: GRB 190829A and GRB 180728A
The Fermi satellite first triggered on GRB 190829A on 29 August 2019 at 19:55:53 UT (T0, Fermi GBM Team 2019). After 51 s, the Burst Alert Telescope (BAT) onboard Swift also triggered and located this event at 19:56:44 UT with a duration of T902 = 58.2 ± 8.9 s (Dichiara et al. 2019; Lien et al. 2019). Both Fermi/GBM and Swift/BAT reported the temporal behaviour of this GRB as having a double-peaked structure. Konus-Wind also detected two emission episodes in the waiting mode with a total duration of ∼61.8 s. The time-integrated spectrum of the first episode using Konus-Wind data in the 20 keV to 2 MeV range was best described using a power law with an exponential cut-off model with Ep = 579 keV and a spectral slope index of
  (Tsvetkova et al. 2019). The X-ray telescope (XRT) onboard Swift began observing the field 97.3 s after the BAT trigger and found a bright, fading uncatalogued X-ray source and continued to monitor it until four months after the trigger. The astrometrically corrected X-ray position is RA(J2000) = 02h58m10.57s, Dec(J
 with an uncertainty of
  (90% confidence radius; Evans et al. 2019).
Observations by the Gamma-ray Burst Monitor (GBM, Meegan et al. 2009) onboard the Fermi satellite were obtained from the GBM archive3 and analysed using the 3ML software. We used data from three of the twelve sodium iodide (NaI) detectors with the strongest detections and one of the two bismuth germanate (BGO) detectors with the best detection (if available). We used the data from Fermi along with Swift/BAT data to examine the temporal and spectral prompt emission properties of GRB 190829A and GRB 180728A. These two nearby GRBs show similar temporal behaviour consisting of two episodes: a weak precursor and a main burst, separated by a quiescent gap. This rarely observed temporal behaviour prompted us to compare the two. To perform the time-averaged and time-resolved spectral analysis, we reduced the time-tagged event (TTE) mode data of GBM using the gtburst4 software as they have high time precision in all 128 energy channels. We retrieved the Swift/BAT light curve and spectrum following the standard procedure5, and fitted spectrum with the Band function (Band et al. 1993) and various other models (Blackbody, Cut-off Power law, and Power law or their combinations) based upon the model fit, residuals of the data, and their parameters. The results based on the analysis described above are presented in Figs. 1 and 2, and the values are provided in Table 1. The episodes are identified with the Bayesian Blocks method (Scargle 1998).
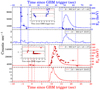 |
Fig. 1. Prompt emission light curves of GRB 190829A (blue) and GRB 180728A (red). Two upper panels: gamma-ray light curves of GRB 190829A (1 s bins) whereas the two bottom panels show the gamma-ray light curves of GRB 180728A (64 ms bins). The energy channels are given in the legend. Solid blue and red vertical lines represent the Fermi trigger times. The red and blue dashed vertical lines indicate the time interval used for the joint time-averaged spectral analysis for each episode of the two bursts. The peak energy evolution of the first episode of GRB 190829A shows a trend from hard to soft whereas the second episode is more disordered. The behaviour of this second episode is contrary to the Ep behaviour observed for GRB 180728A which tracks intensity. The insets for GRB 190829A (blue) and GRB 180728A (red) show the evolution of the low-energy spectral index (α) with the red-dashed and the black-solid lines representing the synchrotron fast cooling spectral index (−3/2) and the line of death of synchrotron emission (−2/3), respectively. Interestingly, α in the case of GRB 190829A seems to overshoot the synchrotron limits in later bins whereas for GRB 180728A, α remains within the synchrotron limit throughout its evolution. |
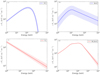 |
Fig. 2. Best-fit time-integrated energy spectra of GRB 190829A (blue) and GRB 180728A (red) in model space using joint spectral analysis with different combinations of detectors (see Table 1). Panel a: first pulse of GRB 190829A is modelled with a Cut-off power-law model. Panel b: second pulse of GRB 190829A is best described with a Band function. Panel c: first pulse of GRB 180728A is modelled with a Power law model. Panel d: second pulse of GRB 180728A is described by a combination of Band and BB functions. The shaded regions mark the 1σ contour for the corresponding best fit model. |
Comparison between different models used for the episode-wise time-averaged joint spectral analysis of Fermi/GBM and Swift/BAT data of GRB 180728A and GRB 190829A.
For GRB 190829A, the time-averaged spectrum of the precursor (first episode) is best described as a power law with an exponential high-energy cut-off function with a photon index of  , and a cut-off energy corresponding to the peak energy, Ep = 123.51
 keV. On the contrary, the main episode is best fit by a Band function with Ep = 11.23
 keV, low-energy spectral index (α) =
  and high-energy spectral index (β) =
  , consistent with Lesage et al. (2019). However, in the case of GRB 180728A, the precursor episode is best described by a power law with photon index equal to
  , whereas the main episode is best described with a band+ blackbody component with Ep = 102.70
 keV, α =
  , β =
, β =  and the temperature (kT) = 5.61
 keV.
keV.
3. 10.4 m GTC spectroscopic observations of GRB 190829A/SN 2019oyw
Spectroscopic observations of GRB 190829A were triggered at the 10.4 m GTC (+OSIRIS) soon after the burst and a set of spectroscopic observations were acquired (see Table 2). We obtained optical spectroscopy covering the range 3700–10 000 Å from 0.32 to 4.09 d post-burst (in the rest-frame), in order to monitor the optical evolution of GRB 190829A/SN 2019oyw; see Table 2. To improve the signal-to-noise ratio (S/N), the spectra at nearby epochs and their respective phases were averaged. In the following sections, the redshift determination and spectral analysis of the underlying supernova along with the comparison to other similar nearby events are described.
GRB 190829A/SN 2019oyw spectroscopic observation log taken with the 10.4 m GTC.
3.1. Redshift determination
The Ca H and K absorption line doublet (3933.664 and 3968.470 Å) was identified in the observed spectrum (see Fig. 3) which allowed us to determine a redshift of z = 0.0785 ± 0.0005 (Valeev et al. 2019). Emission lines (O III, Hα, Hβ) of the underlying galaxy are also visible at the same redshift, thus supporting the physical association between GRB 190829A and the SDSS galaxy J025810.28-085719.2, as first proposed by Dichiara et al. (2019). In order to achieve the maximum spectral resolution at bluer wavelengths we used the R1000B (and especially the R2500U) grisms on 30 August 2019 in order to constrain the redshift.
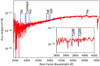 |
Fig. 3. Optical spectrum from the 10.4 m GTC in the range 3500 − 7000 Å, which provides the redshift of GRB 190829A. The CaII lines are shown in absorption (see Inset) and the emission lines of the underlying host galaxy are found at the same redshift. |
3.2. Spectroscopic evolution of GRB 190829A/SN 2019oyw
The upper panel of Fig. 4 shows the spectral evolution. Multiple spectra observed at similar epochs were co-added to improve the S/N. All the spectra were de-reddened for the Galactic and host extinction values (Schlafly & Finkbeiner 2011; Chand et al. 2020) and also shifted to the rest-frame wavelength. Because of poor S/N, the smoothing of spectra was done using the Savitzky–Golay method by fitting the second-order polynomial function for each λ in the range λ − λ/50 < λ < λ + λ/50, as described by Quimby et al. (2018). All the spectra were flux calibrated by scaling them to the observed photometric flux density values (shown with black circles in Fig. 4) wherever possible.
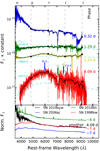 |
Fig. 4. Spectroscopic evolution of GRB 190829A/SN 2019oyw from 0.32 to 4.09 d after the burst. The flux density as a function of the rest-frame wavelength is plotted after correcting spectra for Galactic and host extinctions. All the spectra presented in the upper panel have been corrected for grism losses and scaled to the observed photometric flux density values shown with black circles, wherever possible. Atmospheric features are indicated with green arrows in the spectrum at 4.09 d. The emission lines: Si II (λ6355 Å) and Ca II NIR (λ8498 Å, 8542 Å, and 8662 Å) are indicated by blue arrows. For clarity, random offsets in the Y-axis are applied to the smoothed spectra. An unusual bluer excess in the early spectrum taken at 0.32 d deviating from the overall power-law nature is also noticeable. Bottom panel: we display the spectrum of SN 2019oyw taken at ∼4.09 d (in black, smoothed) along with other GRB/SNe spectra: SN 1998bw (red), SN 2006aj (blue), and SN 2010bh (green). |
As shown in Fig. 4, the first two spectra (at 0.32 and 1.29 d post-burst) are featureless and typical of those expected from GRB afterglows, but a transition from the afterglow (AG) to the underlying SN is clearly illustrated with broad lines as emerging features in the later (after ∼2.23 d) optical spectra of GRB 190829A/SN 2019oyw, indicating high velocities already at this stage. The spectrum at 0.32 d shows a power-law behaviour, whereas the spectra at 1.29, 2.23, and 4.09 d appear to deviate from the power law and can be constrained with the blackbody function implying blackbody temperatures (TBB) of ∼5100, ∼4660, and ∼4575 K, respectively (shown with cyan colour in the upper panel of Fig. 4). The associated SN 2019oyw spectrum at 4.09 d appears to have Si II (λ6355 Å) and Ca II NIR (λ8498 Å, 8542 Å, and 8662 Å) spectral features (blue arrows) at higher velocities, which are typical of those seen in Type Ic-BL SNe.
In the bottom panel of Fig. 4, the spectrum of SN 2019oyw taken at ∼4.09 d is compared with other GRB/SNe spectra: SN 1998bw (Patat et al. 2001), SN 2006aj (Pian et al. 2006), and SN 2010bh (Bufano et al. 2012). For comparison, all the spectra were normalised, de-reddened (Galactic + host) and shifted to the rest-frame wavelength. It is apparent that the observed broad spectral features for GRB 190829A/SN 2019oyw are similar to those observed in the other SNe. The spectrum of SN 2019oyw taken at ∼4.09 d bears a close resemblance to the spectrum of SN 1998bw taken at 7 d. This time difference between the spectra of the two SNe indicates that SN 2019oyw evolved faster than SN 1998bw.
4. 10.4 m GTC photometric observations of GRB 190829A/SN 2019oyw
Photometric observations of GRB 190829A/SN 2019oyw obtained by the 10.4 m GTC telescope show that this GRB lies in the outskirts of the host; see Fig. 5. Multi-band optical photometry observations obtained for GRB 190829A/SN 2019oyw were measured using aperture photometry through standard procedures after image subtraction. A model for the light profile of the galaxy was determined in order to estimate the contribution from the host assuming a symmetric light distribution, and we subtracted this model from the images containing the GRB/SN in order to obtain accurate photometric measurements. The photometry was calibrated against a number of stars from the SDSS catalogue (Alam et al. 2015) in the field of view. These calibration stars were specifically chosen because they are isolated, not saturated, and are in a constant background. The derived AB magnitudes in SDSS (ugriz) filters for the afterglow/SN 2019oyw are provided in Table 3.
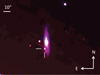 |
Fig. 5. Sloan gri-band false colour image of the field of GRB 190829A taken with the 10.4 m GTC on 29 August 2019. Two perpendicular lines indicate the afterglow position. The associated host galaxy, J025810.28-085719.2, is clearly seen. North is up and east to the left. |
Optical and photometric data of GRB 190829A/SN 2019oyw in SDSS u, g, r, i, and z-bands obtained with the 10.4 m GTC.
The optical photometric observations of GRB 190829A/SN 2019oyw spanning from 0.29 to 40.33 d after the trigger are shown in Fig. 6 along with the XRT light curves (at 10 keV) in the observer frame. The magnitudes have been corrected for Galactic as well as the host galaxy extinction using E(B − V) = 0.049 mag and 1.04 mag, respectively. The host-galaxy extinction is adopted from the best-fit model of Chand et al. (2020) obtained for the Small Magellanic Cloud (SMC) extinction law. The plotted ugriz light curves of GRB 190829A/SN 2019oyw are contributions of the AG and the associated SN, whereas the constant flux contribution from the host galaxy has already been removed using the template subtraction technique. Late-time i-band (in black) data (up to ∼40 d after the burst) for GRB 190829A/SN 2019oyw clearly show the expected SN signature with a late-time bump peaking at ∼20 d. The light curves in the g, r, i, and z-filters up to ∼2.3 d post burst were individually fitted with a single power-law model. The temporal flux decay indices in each of the four filters were determined to be αg = 1.77 ± 0.08, αr = 1.45 ± 0.01, αi = 1.53 ± 0.13, and αz = 1.25 ± 0.01. To extract the afterglow contribution from the entire i-band GTC dataset, we used the flux temporal decay index determined in the i filter measured up to ∼2.3 d post burst. We also use the value of αi for subsequent analysis as this value is close to the average value of the decay indices obtained using all four individual filters.
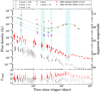 |
Fig. 6. 10.4 m GTC multi-band optical light curves (in flux density) of GRB 190829A/SN 2019oyw between 0.32 and 40.3 d post burst. The data are corrected for Galactic and host extinction, as discussed above. The i-band light curve of SN 2019oyw peaks around 20 d after the burst which appears to match with the late-time bump in the 10 keV Swift/XRT light curve (in red). The shaded vertical bars (in cyan) show the four epochs used to create the SED of the GRB 190829A afterglow. For comparison, the X-ray light curve (at 10 keV) of GRB 180728A (in grey) is also plotted; it has similar temporal features (including temporal decay indices, light-curve variability, late-time bump) to the X-ray light curve of GRB 190829A. Bottom panel: evolution of the XRT photon indices (ΓXRT) of the two GRBs discussed. The horizontal black dashed line shows ΓXRT equal to 2. The evolution of ΓXRT indicates late-time softening during the ‘SN phase’, and demands a detailed investigation using a larger subset of such events. |
4.1. Light-curve evolution
Using the temporal decay indices determined in Sect. 4, we extrapolated the AG contribution up to ∼41 d (see Fig. 6, cyan dashed line) and subtracted it from the i-band light curve to obtain the light curve of the associated SN (in lime green). SN 2019oyw appears to emerge at very early phases (from ∼3 d) and reaches peak magnitude at ∼20 d. The X-ray light curve (at 10 keV) shows a late-time bump at ∼20 d, contemporaneous with the SN bump (see Fig. 6 (in red)); however, we do not see any blackbody evolution at the four epochs of the joint spectral energy distributions (SEDs; see Fig. 7). Interestingly, such late time XRT bumps at 10 keV were also observed in the cases of GRB 171205A (Izzo et al. 2019) and GRB 180728A (Wang et al. 2019; Rueda et al. 2020). Based on observations, the progenitors and powering mechanisms for these nearby rare events are constrained to the plausible models such as ‘Collapsar’ (Woosley 1993) and the binary-driven hypernova model (Ruffini et al. 2001, 2016. A separate detailed investigation is underway to obtain a detailed understanding of this subclass of nearby bursts, namely GRB 171205A/SN 2017iuk, GRB 180728A/SN 2018fip, and GRB 190829A/SN 2019oyw, with noticeable late-time X-ray bumps (at 10 keV) along with evolution of the XRT photon indices (ΓXRT).
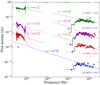 |
Fig. 7. Spectral energy distributions of the GRB 190829A afterglow using the optical-XRT data. (a) SED at ∼0.37 d (green), (b) SED at ∼2.2 d (magenta), (c) SED at ∼4.34 d (red), and (d) SED at ∼14.3 d (close to the i-band peak) showing the absence of thermal emission at XRT frequencies. In (b) and (c) optical SEDs and fitted BB contributions are also plotted in respective colours as described in Sect. 3.2. The derived values of the spectral indices are provided in Table 4. |
4.2. SED evolution of GRB 190829A
Near-simultaneous optical and X-ray SEDs were constructed at four different epochs covering the afterglow decay phase and the peak of SN 2019oyw; see times indicated by cyan shaded bands in Fig. 6. The SEDs at XRT frequencies were collected from the Swift/XRT page6 and modelled using XSPEC to determine the spectral indices. The 10.4 m GTC extinction corrected SEDs were fitted using a single power-law model as discussed above. The X-ray temporal decay index using data taken at 10 keV was found to be  between ∼3 × 10⁴ and ∼4 × 10⁵ s. This temporal index was used along with those estimated at optical frequencies αopt to study the evolution of the SEDs. The details of the four epochs of SEDs and their corresponding indices for the different segments of optical and X-ray data (SED 1- SED 4) are listed in Table 4. We used the closure relations αopt − βopt, αx − ray − βx − ray (Sari et al. 1998; Gompertz et al. 2018) to constrain the model and location of the cooling-break frequency (νc). Considering adiabatic cooling without energy injection from the central engine and a slow cooling case for an interstellar matter (ISM)-like environment as suggested by Chand et al. (2020) and Fraija et al. (2020), there are three possible scenarios from optical to X-ray frequencies (Gompertz et al. 2018):
(i) νc < νopt < νx − ray; in this case it is
 (1)
(1)
Best fit optical and X-ray spectral indices of SEDs at different epochs and the spectral regime that best describes them.
(ii) νopt < νc < νx − ray; in this case it is
 (2)
(2)
(iii) νopt < νx − ray < νc; in this case it is
 (3)
(3)
We calculated the electron distribution index (p) for each scenario mentioned above using the calculated value of αopt, x − ray and βopt, x − ray. For SED 1, we find that the afterglow can be described with the νopt < νc < νx − ray spectral regime. Later on, for SED 2, SED 3, and SED 4, νc, the spectral index decreases consistent with νc having crossed the optical/X-ray band, and indicating that at these epochs we are now in the νc < νopt < νx − ray spectral regime.
4.3. SN 2019oyw properties and comparisons
The extracted light curve of SN 2019oyw in absolute magnitude (in black) is plotted in the rest-frame; see Fig. 8. The absolute magnitudes are calculated from de-reddened apparent magnitudes and are corrected for cosmological expansion (Hogg et al. 2002) to get the rest-frame magnitudes, as described in Kumar et al. (2020). The i-band light-curve evolution of SN 2019oyw (see Fig. 8, black solid line) is compared with other well-studied low-redshift GRB-SNe such as SN 1998bw (in red; Galama et al. 1998), SN 2006aj (in blue; Bianco et al. 2014), and SN 2010bh (in green; Cano et al. 2011). The light curves of these comparison SNe have been corrected for Galactic as well as host galaxy extinction using values taken from Cano (2013) and references therein.
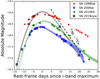 |
Fig. 8. i-band light curve of SN 2019oyw presented along with three other well-studied GRB-SN events: SN 1998bw, SN 2006aj, and SN 2010bh. Light curves for the given SNe have been de-reddened (Galactic + Host absorption) and also magnitude values and phase have been shifted to the rest-frame. The constrained value of the peak brightness of SN 2019oyw is close to that estimated in the case of SN 1998bw. SN 2019oyw exhibits a post-peak decay rate close to that expected for the radioactive decay of 56Ni–> 56Co (black dotted line). The shaded region marks the 1σ contour for the corresponding best-fit light curve. |
Light curves of the four SNe connected to GRBs (see Fig. 8) are fitted with low-order polynomials to estimate the peak absolute magnitudes (Mi) and the times taken by the SNe to rise and fall by 1 mag from the peak ( and
and  , respectively). The peak magnitude of SN 2019oyw is Mi = −19.04 ± 0.01 mag, which is brighter than SN 2006aj (Mi = −18.36 ± 0.13 mag) and SN 2010bh (Mi = −18.58 ± 0.08 mag), and more similar to the peak absolute magnitude of SN 1998bw (Mi ∼ −18.95 mag). The calculated value of
  for SN 2019oyw is found to be 13.32 ± 0.04 d, which is lower in comparison to those estimated for other GRB-SNe, namely SN 1998bw (∼24.8 d), SN 2006aj (∼20.3 d), and SN 2010bh (∼17.1 d). This indicates a steeper post-peak decay rate for SN 2019oyw as can also be inferred from the faster spectral evolution in Sect. 3.2. Examining the value of
  for SN 2019oyw (9.67 ± 0.02 d), we find it to be most similar to SN 2006aj (∼8.80 d) and SN 2010bh (∼9.0 d), whereas it is lower in comparison to that observed in the case of SN 1998bw (∼13.3 d). We also estimate the value of the ejected nickel mass (MNi) as 0.5 ± 0.1 M⊙ for GRB 190829A/SN 2019oyw using the relation between Mpeak and MNi given by Lyman et al. (2016). The discussed light curves of the four GRB-SNe have also been compared with the 56Ni − > 56Co theoretical decay curve. SN 2019oyw appears to be consistent with this decay curve (shown with a black dotted line) soon after the peak.
As studied by Wheeler et al. (2015) (see also Cano 2013), we can estimate the ejecta mass (Mej) and kinetic energy (Ek) of the SN using the photospheric velocity near to the peak and rise time (see Eqs. (1) and (3) of Wheeler et al. 2015). SN 2019oyw exhibits a rise time (tr i.e. the time taken from the GRB detection to the SN peak time in the i-band) of 19.19 ± 0.25 d. We are unable to estimate the photospheric velocity (vph) for SN 2019oyw due to the absence of late time spectral coverage. Therefore, we use the average value of photospheric velocity (∼20 000 ± 2500 km s−1) of GRB/XRF-SNe estimated by Cano (2013). For SN 2019oyw, using tr and vph we obtain Mej 5.67 ± 0.72 M⊙ and Ek (13.55 ± 5.08) × 1051 erg. For this analysis, the fiducial optical opacity κ = 0.1 cm2 g−1 and the fiducial gamma-ray opacity κγ = 0.03 cm2 g−1 are adopted as suggested by Wheeler et al. (2015). The estimated values of MNi, Mej and Ek for SN 2019oyw are in close agreement with those estimated for SN 1998bw by Nakamura et al. (2001). For SN 2019oyw, the Ek/Mej is also highly consistent with the values estimated by Lyman et al. (2016), Cano et al. (2017), and Pandey et al. (in prep.).
5. Results and discussion
The prompt emission light curve of GRB 190829A, consisting of two emission episodes separated by a quiescent gap, is found to be similar to that exhibited by another nearby GRB 180728A. A time-averaged and time-resolved spectral analysis of the double-episode prompt emission using Swift/BAT and Fermi/GBM data for GRB 190829A and GRB 180728A reveals diverse Ep and α evolution posing a challenge to the proposed progenitor models. For GRB 190829A, the low-energy spectral index (α) overshoots the synchrotron limits in later time bins, which poses a problem for synchrotron models, whereas for GRB 180728A the evolution of α remains within the synchrotron limit.
We also present 10.4 m GTC spectroscopy (0.32 to 4.09 d post burst, in the rest-frame) and the redshift determination for GRB 190829A, a VHE-detected GRB. Our spectrum taken as early as 0.32 d shows a featureless power-law behaviour as expected for GRB afterglows, whereas the spectrum taken at a later epoch (4.09 d post burst) shows the type Ic-BL broad absorption features (Si II and Ca II NIR lines) indicative of higher velocity outflows as reported by de Ugarte Postigo et al. (2019). Thermal evolution of the spectra at three later epochs shows decreasing photospheric temperatures from ∼5100–4575 K, typical of those observed in other similar SNe (Cano et al. 2017). Spectroscopically, around 4.09 d post burst, the underlying SN closely resembles GRB 980425/SN 1998bw.
The host-subtracted 10.4 m GTC ugriz band photometry was used to construct the light curves from 0.27 to 37.99 rest-frame days after burst. These clearly show a power-law decay nature typical of that observed in GRB afterglows until ∼2.3 d post burst. Using 10.4 m GTC multi-band optical data along with the XRT data, we were able to constrain the evolution of νc (between 0.32 to 4.09 d post-burst) and determine the electron energy index p, assuming the afterglow follows the model predictions in the case of an ISM-like ambient medium. However, photometrically, apart from showing a typical afterglow decay at early epochs, a deviation from the power law decay is clearly seen in all filters with a clear signature of a re-brightening peaking around ∼20 d post burst in the i-band. The peak brightness (Mi ∼ −19.04 mag) of SN 2019oyw confirms the SN as being one of the brightest GRBs/SNe and similar to SN 1998bw in terms of other estimated parameters such as MNi, Mej, and Ek. While the values of Mej and Ek are higher than usual, their ratio is closer to those seen in other type Ibc-BL and GRB/SNe (Lyman et al. 2016; Cano et al. 2017). The low value of  , and the post-peak decay rate are indicative of 56Ni as a possible powering source for SN 2019oyw.
It is also notable that Wang et al. (2019) attempted to explain the nature of the prompt emission of GRB 180728A in terms of the type II binary-driven hypernova (BdHN II) model (Rueda et al. 2020) for the observed underlying SN as an alternative to the ‘Collapsar’ model (Woosley 1993; Hjorth & Bloom 2012). In the near future, with more observations of events of this kind, it would be very interesting to decipher whether or not such nearby GRBs, with two emission episodes in their prompt emission phase, have underlying SN features.
T90 is the burst duration defined as the time interval over which 5% to 95% of the counts are accumulated.
Acknowledgments
Based on observations made with the GTC telescope, in the Spanish Observatorio del Roque de los Muchachos of the Instituto de Astrofísica de Canarias, part of them under Director’s Discretionary Time. This work has made use of data obtained from the High Energy Astrophysics Science Archive Research Center (HEASARC) and the Leicester Database and Archive Service (LEDAS), provided by NASA’s Goddard Space Flight Center and the Department of Physics and Astronomy, Leicester University, UK, respectively. Y.-D.H., A.J.C.-T., I.A. and D.A.K. acknowledge financial support from the State Agency for Research of the Spanish MCIU through the ‘Center of Excellence Severo Ochoa’ award to the Instituto de Astrofísica de Andalucía (SEV-2017-0709). R.G, S.B.P., and A.A. acknowledge BRICS grant DST/IMRCD/BRICS/PilotCall1/ProFCheap/2017(G) for part of the work. V.A.F. was supported by RFBR 18-29-21030 grant. S.B.P. also acknowledges DST/INT/JSPS/P/281/2018 for the present work. B.-B.Z. acknowledges the supported by the Fundamental Research Funds for the Central Universities (14380035). This work is supported by National Key Research and Development Programs of China (2018YFA0404204), the National Natural Science Foundation of China (Grant Nos. 11833003) and the Program for Innovative Talents, Entrepreneur in Jiangsu. D.A.K. acknowledges support from Spanish research project RTI2018-098104-J-I00 (GRBPhot). Finally, the authors extend their thanks to the anonymous referee for their valuable comments that helped to improve the manuscript substantially.
References
- Alam, S., Albareti, F. D., Allende Prieto, C., et al. 2015, ApJS, 219, 12 [NASA ADS] [CrossRef] [Google Scholar]
- Band, D., Matteson, J., Ford, L., et al. 1993, ApJ, 413, 281 [NASA ADS] [CrossRef] [Google Scholar]
- Bianco, F. B., Modjaz, M., Hicken, M., et al. 2014, ApJS, 213, 19 [NASA ADS] [CrossRef] [Google Scholar]
- Bolmer, J., Greiner, J., & Chen, T.-W. 2019, GRB Coordinates Network, Circular Service No. 25651 [Google Scholar]
- Bufano, F., Pian, E., Sollerman, J., et al. 2012, ApJ, 753, 67 [NASA ADS] [CrossRef] [Google Scholar]
- Cano, Z. 2013, MNRAS, 434, 1098 [NASA ADS] [CrossRef] [Google Scholar]
- Cano, Z., Bersier, D., Guidorzi, C., et al. 2011, ApJ, 740, 41 [NASA ADS] [CrossRef] [Google Scholar]
- Cano, Z., de Ugarte Postigo, A., Pozanenko, A., et al. 2014, A&A, 568, A19 [NASA ADS] [CrossRef] [EDP Sciences] [Google Scholar]
- Cano, Z., Wang, S. Q., Dai, Z. G., & Wu, X. F. 2017, AdAst, 2017E, 5 [Google Scholar]
- Chand, V., Banerjee, A., Gupta, R., et al. 2020, ApJ, 898, 42 [Google Scholar]
- Chandra, P. 2019, GRB Coordinates Network, Circular Service No. 25627 [Google Scholar]
- Chornock, R., Berger, E., Levesque, E. M., et al. 2010, ArXiv e-prints [arXiv:1004.2262] [Google Scholar]
- Coppin, P., de Vries, K. D., & van Eijndhoven, N. 2020, Phys. Rev. D, 102, 103014 [Google Scholar]
- Davies, M. B., Levan, A. J., Larsson, J., et al. 2007, Gamma-Ray Bursts: Prospects for GLAST, 906, 69 [Google Scholar]
- D’Elia, V., Pian, E., Melandri, A., et al. 2015, A&A, 577, A116 [NASA ADS] [CrossRef] [EDP Sciences] [Google Scholar]
- de Naurois, M., & H. E. S. S. Collaboration 2019, GRB Coordinates Network, Circular Service No. 25566 [Google Scholar]
- Dessart, L., Hillier, D. J., Yoon, S. C., et al. 2017, A&A, 603, A51 [NASA ADS] [CrossRef] [EDP Sciences] [Google Scholar]
- de Ugarte Postigo, A., Izzo, L., Thoene, C. C., et al. 2019, GRB Coordinates Network, Circular Service No. 25677 [Google Scholar]
- Dichiara, S., Bernardini, M. G., Burrows, D. N., et al. 2019, GRB Coordinates Network, Circular Service No. 25552 [Google Scholar]
- Evans, P. A., Goad, M. R., Osborne, J. P., et al. 2019, GRB Coordinates Network, Circular Service No. 25567 [Google Scholar]
- Fermi GBM Team 2019, GRB Coordinates Network, Circular Service No. 25551 [Google Scholar]
- Fraija, N., Veres, P., Beniamini, P., et al. 2020, ApJ, submitted [arXiv:2003.11252] [Google Scholar]
- Galama, T. J., Vreeswijk, P. M., van Paradijs, J., et al. 1998, Nature, 395, 670 [NASA ADS] [CrossRef] [Google Scholar]
- Galama, T. J., Vreeswijk, P. M., van Paradijs, J., et al. 1999, A&AS, 138, 465 [NASA ADS] [CrossRef] [EDP Sciences] [Google Scholar]
- Georgy, C., Meynet, G., Walder, R., et al. 2009, A&A, 502, 611 [NASA ADS] [CrossRef] [EDP Sciences] [Google Scholar]
- Gompertz, B. P., Fruchter, A. S., & Pe’er, A. 2018, ApJ, 866, 162 [Google Scholar]
- Hjorth, J., & Bloom, J. S. 2012, Chapter 9 in Gamma-Ray Bursts, 169 [Google Scholar]
- Hogg, D. W., Baldry, I. K., Blanton, M. R., et al. 2002, ArXiv e-prints [arXiv:astro-ph/0210394] [Google Scholar]
- Hu, Y.-D., Liang, E.-W., Xi, S.-Q., et al. 2014, ApJ, 789, 145 [NASA ADS] [CrossRef] [Google Scholar]
- Izzo, L., Rossi, A., Malesani, D. B., et al. 2018, GRB Coordinates Network, Circular Service, No. 23142 #1 (2018/August-0) [Google Scholar]
- Izzo, L., de Ugarte Postigo, A., Maeda, K., et al. 2019, Nature, 565, 324 [Google Scholar]
- Jarosik, N., Bennett, C. L., Dunkley, J., et al. 2011, ApJS, 192, 14 [NASA ADS] [CrossRef] [Google Scholar]
- Kumar, A., Pandey, S. B., Konyves-Toth, R., et al. 2020, ApJ, 892, 28 [Google Scholar]
- Lan, L., Lü, H.-J., Zhong, S.-Q., et al. 2018, ApJ, 862, 155 [Google Scholar]
- Laskar, T., Bhandari, S., Schroeder, G., et al. 2019, GRB Coordinates Network, Circular Service No. 25676 [Google Scholar]
- Lesage, S., Poolakkil, S., Fletcher, C., et al. 2019, GRB Coordinates Network, Circular Service No. 25575 [Google Scholar]
- Lien, A. Y., Barthelmy, S. D., Cummings, J. R., et al. 2019, GRB Coordinates Network, Circular Service No. 25579 [Google Scholar]
- Lipunov, V., Balakin, F., Gorbovskoy, E., et al. 2019a, GRB Coordinates Network, Circular Service No. 25652 [Google Scholar]
- Lipunov, V., Gorbovskoy, E., & Kornilov, V. 2019b, Transient Name Server Discovery Report 2019-1657 [Google Scholar]
- Lyman, J. D., Bersier, D., James, P. A., et al. 2016, MNRAS, 457, 328 [NASA ADS] [CrossRef] [Google Scholar]
- Malesani, D., Tagliaferri, G., Chincarini, G., et al. 2004, ApJ, 609, L5 [NASA ADS] [CrossRef] [Google Scholar]
- Meegan, C., Lichti, G., Bhat, P. N., et al. 2009, ApJ, 702, 791 [NASA ADS] [CrossRef] [Google Scholar]
- Mirabal, N., Halpern, J. P., An, D., et al. 2006, ApJ, 643, L99 [NASA ADS] [CrossRef] [Google Scholar]
- Modjaz, M., Stanek, K. Z., Garnavich, P. M., et al. 2006, ApJ, 645, L21 [NASA ADS] [CrossRef] [Google Scholar]
- Nakamura, T., Mazzali, P. A., Nomoto, K., et al. 2001, ApJ, 550, 991 [NASA ADS] [CrossRef] [Google Scholar]
- Pandey, S. B. 2013, JApA, 34, 157 [Google Scholar]
- Patat, F., Cappellaro, E., Danziger, J., et al. 2001, ApJ, 555, 900 [NASA ADS] [CrossRef] [Google Scholar]
- Perley, D. A., & Cockeram, A. M. 2019, GRB Coordinates Network, Circular Service No. 25623 [Google Scholar]
- Pian, E., Mazzali, P. A., Masetti, N., et al. 2006, Nature, 442, 1011 [NASA ADS] [CrossRef] [PubMed] [Google Scholar]
- Quimby, R. M., De Cia, A., Gal-Yam, A., et al. 2018, ApJ, 855, 2 [NASA ADS] [CrossRef] [Google Scholar]
- Rhodes, L., van der Horst, A. J., Fender, R., et al. 2020, MNRAS, 496, 3326 [Google Scholar]
- Rueda, J. A., Ruffini, R., Karlica, M., et al. 2020, ApJ, 893, 148 [Google Scholar]
- Ruffini, R., Bianco, C. L., Fraschetti, F., et al. 2001, ApJ, 555, L117 [Google Scholar]
- Ruffini, R., Rueda, J. A., Muccino, M., et al. 2016, ApJ, 832, 136 [NASA ADS] [CrossRef] [Google Scholar]
- Sahu, S., & Fortín, C. E. L. 2020, ApJ, 895, L41 [Google Scholar]
- Sari, R., Piran, T., & Narayan, R. 1998, ApJ, 497, L17 [NASA ADS] [CrossRef] [Google Scholar]
- Scargle, J. D. 1998, ApJ, 504, 405 [NASA ADS] [CrossRef] [Google Scholar]
- Schlafly, E. F., & Finkbeiner, D. P. 2011, ApJ, 737, 103 [NASA ADS] [CrossRef] [Google Scholar]
- Selsing, J., Izzo, L., Rossi, A., et al. 2018, GRB Coordinates Network, Circular Service, No. 23181, #1 (2018/August-0) [Google Scholar]
- Stanek, K. Z., Matheson, T., Garnavich, P. M., et al. 2003, ApJ, 591, L17 [NASA ADS] [CrossRef] [Google Scholar]
- Terreran, G., Fong, W., Margutti, R., et al. 2019, GRB Coordinates Network, Circular Service No. 25664 [Google Scholar]
- Tsvetkova, A., Golenetskii, S., Aptekar, R., et al. 2019, GRB Coordinates Network, Circular Service No. 25660 [Google Scholar]
- Valeev, A. F., Castro-Tirado, A. J., Hu, Y.-D., et al. 2019, GRB Coordinates Network, Circular Service No. 25565 [Google Scholar]
- Volnova, A., Rumyantsev, V., Pozanenko, A., et al. 2019, GRB Coordinates Network, Circular Service No. 25682 [Google Scholar]
- Wang, Y., Rueda, J. A., Ruffini, R., et al. 2019, ApJ, 874, 39 [Google Scholar]
- Wheeler, J. C., Johnson, V., & Clocchiatti, A. 2015, MNRAS, 450, 1295 [NASA ADS] [CrossRef] [Google Scholar]
- Woosley, S. E. 1993, ApJ, 405, 273 [Google Scholar]
- Woosley, S. E., & Bloom, J. S. 2006, ARA&A, 44, 507 [Google Scholar]
All Tables
Comparison between different models used for the episode-wise time-averaged joint spectral analysis of Fermi/GBM and Swift/BAT data of GRB 180728A and GRB 190829A.
Optical and photometric data of GRB 190829A/SN 2019oyw in SDSS u, g, r, i, and z-bands obtained with the 10.4 m GTC.
Best fit optical and X-ray spectral indices of SEDs at different epochs and the spectral regime that best describes them.
All Figures
|
Fig. 1. Prompt emission light curves of GRB 190829A (blue) and GRB 180728A (red). Two upper panels: gamma-ray light curves of GRB 190829A (1 s bins) whereas the two bottom panels show the gamma-ray light curves of GRB 180728A (64 ms bins). The energy channels are given in the legend. Solid blue and red vertical lines represent the Fermi trigger times. The red and blue dashed vertical lines indicate the time interval used for the joint time-averaged spectral analysis for each episode of the two bursts. The peak energy evolution of the first episode of GRB 190829A shows a trend from hard to soft whereas the second episode is more disordered. The behaviour of this second episode is contrary to the Ep behaviour observed for GRB 180728A which tracks intensity. The insets for GRB 190829A (blue) and GRB 180728A (red) show the evolution of the low-energy spectral index (α) with the red-dashed and the black-solid lines representing the synchrotron fast cooling spectral index (−3/2) and the line of death of synchrotron emission (−2/3), respectively. Interestingly, α in the case of GRB 190829A seems to overshoot the synchrotron limits in later bins whereas for GRB 180728A, α remains within the synchrotron limit throughout its evolution. |
| In the text | |
|
Fig. 2. Best-fit time-integrated energy spectra of GRB 190829A (blue) and GRB 180728A (red) in model space using joint spectral analysis with different combinations of detectors (see Table 1). Panel a: first pulse of GRB 190829A is modelled with a Cut-off power-law model. Panel b: second pulse of GRB 190829A is best described with a Band function. Panel c: first pulse of GRB 180728A is modelled with a Power law model. Panel d: second pulse of GRB 180728A is described by a combination of Band and BB functions. The shaded regions mark the 1σ contour for the corresponding best fit model. |
| In the text | |
|
Fig. 3. Optical spectrum from the 10.4 m GTC in the range 3500 − 7000 Å, which provides the redshift of GRB 190829A. The CaII lines are shown in absorption (see Inset) and the emission lines of the underlying host galaxy are found at the same redshift. |
| In the text | |
|
Fig. 4. Spectroscopic evolution of GRB 190829A/SN 2019oyw from 0.32 to 4.09 d after the burst. The flux density as a function of the rest-frame wavelength is plotted after correcting spectra for Galactic and host extinctions. All the spectra presented in the upper panel have been corrected for grism losses and scaled to the observed photometric flux density values shown with black circles, wherever possible. Atmospheric features are indicated with green arrows in the spectrum at 4.09 d. The emission lines: Si II (λ6355 Å) and Ca II NIR (λ8498 Å, 8542 Å, and 8662 Å) are indicated by blue arrows. For clarity, random offsets in the Y-axis are applied to the smoothed spectra. An unusual bluer excess in the early spectrum taken at 0.32 d deviating from the overall power-law nature is also noticeable. Bottom panel: we display the spectrum of SN 2019oyw taken at ∼4.09 d (in black, smoothed) along with other GRB/SNe spectra: SN 1998bw (red), SN 2006aj (blue), and SN 2010bh (green). |
| In the text | |
|
Fig. 5. Sloan gri-band false colour image of the field of GRB 190829A taken with the 10.4 m GTC on 29 August 2019. Two perpendicular lines indicate the afterglow position. The associated host galaxy, J025810.28-085719.2, is clearly seen. North is up and east to the left. |
| In the text | |
|
Fig. 6. 10.4 m GTC multi-band optical light curves (in flux density) of GRB 190829A/SN 2019oyw between 0.32 and 40.3 d post burst. The data are corrected for Galactic and host extinction, as discussed above. The i-band light curve of SN 2019oyw peaks around 20 d after the burst which appears to match with the late-time bump in the 10 keV Swift/XRT light curve (in red). The shaded vertical bars (in cyan) show the four epochs used to create the SED of the GRB 190829A afterglow. For comparison, the X-ray light curve (at 10 keV) of GRB 180728A (in grey) is also plotted; it has similar temporal features (including temporal decay indices, light-curve variability, late-time bump) to the X-ray light curve of GRB 190829A. Bottom panel: evolution of the XRT photon indices (ΓXRT) of the two GRBs discussed. The horizontal black dashed line shows ΓXRT equal to 2. The evolution of ΓXRT indicates late-time softening during the ‘SN phase’, and demands a detailed investigation using a larger subset of such events. |
| In the text | |
|
Fig. 7. Spectral energy distributions of the GRB 190829A afterglow using the optical-XRT data. (a) SED at ∼0.37 d (green), (b) SED at ∼2.2 d (magenta), (c) SED at ∼4.34 d (red), and (d) SED at ∼14.3 d (close to the i-band peak) showing the absence of thermal emission at XRT frequencies. In (b) and (c) optical SEDs and fitted BB contributions are also plotted in respective colours as described in Sect. 3.2. The derived values of the spectral indices are provided in Table 4. |
| In the text | |
|
Fig. 8. i-band light curve of SN 2019oyw presented along with three other well-studied GRB-SN events: SN 1998bw, SN 2006aj, and SN 2010bh. Light curves for the given SNe have been de-reddened (Galactic + Host absorption) and also magnitude values and phase have been shifted to the rest-frame. The constrained value of the peak brightness of SN 2019oyw is close to that estimated in the case of SN 1998bw. SN 2019oyw exhibits a post-peak decay rate close to that expected for the radioactive decay of 56Ni–> 56Co (black dotted line). The shaded region marks the 1σ contour for the corresponding best-fit light curve. |
| In the text | |
Current usage metrics show cumulative count of Article Views (full-text article views including HTML views, PDF and ePub downloads, according to the available data) and Abstracts Views on Vision4Press platform.
Data correspond to usage on the plateform after 2015. The current usage metrics is available 48-96 hours after online publication and is updated daily on week days.
Initial download of the metrics may take a while.