Fig. 1.
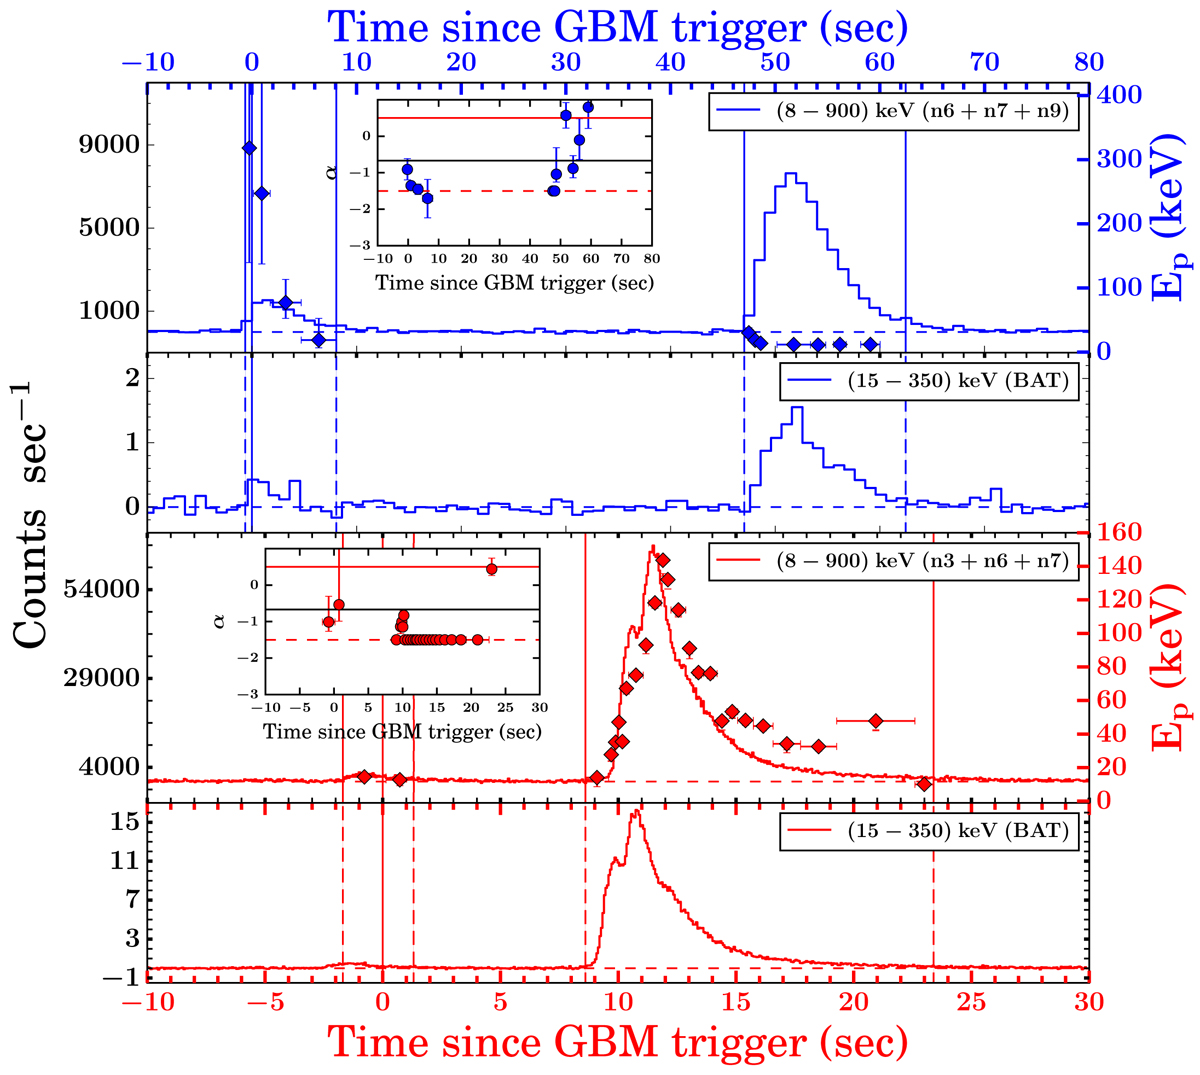
Prompt emission light curves of GRB 190829A (blue) and GRB 180728A (red). Two upper panels: gamma-ray light curves of GRB 190829A (1 s bins) whereas the two bottom panels show the gamma-ray light curves of GRB 180728A (64 ms bins). The energy channels are given in the legend. Solid blue and red vertical lines represent the Fermi trigger times. The red and blue dashed vertical lines indicate the time interval used for the joint time-averaged spectral analysis for each episode of the two bursts. The peak energy evolution of the first episode of GRB 190829A shows a trend from hard to soft whereas the second episode is more disordered. The behaviour of this second episode is contrary to the Ep behaviour observed for GRB 180728A which tracks intensity. The insets for GRB 190829A (blue) and GRB 180728A (red) show the evolution of the low-energy spectral index (α) with the red-dashed and the black-solid lines representing the synchrotron fast cooling spectral index (−3/2) and the line of death of synchrotron emission (−2/3), respectively. Interestingly, α in the case of GRB 190829A seems to overshoot the synchrotron limits in later bins whereas for GRB 180728A, α remains within the synchrotron limit throughout its evolution.
Current usage metrics show cumulative count of Article Views (full-text article views including HTML views, PDF and ePub downloads, according to the available data) and Abstracts Views on Vision4Press platform.
Data correspond to usage on the plateform after 2015. The current usage metrics is available 48-96 hours after online publication and is updated daily on week days.
Initial download of the metrics may take a while.