Fig. 8.
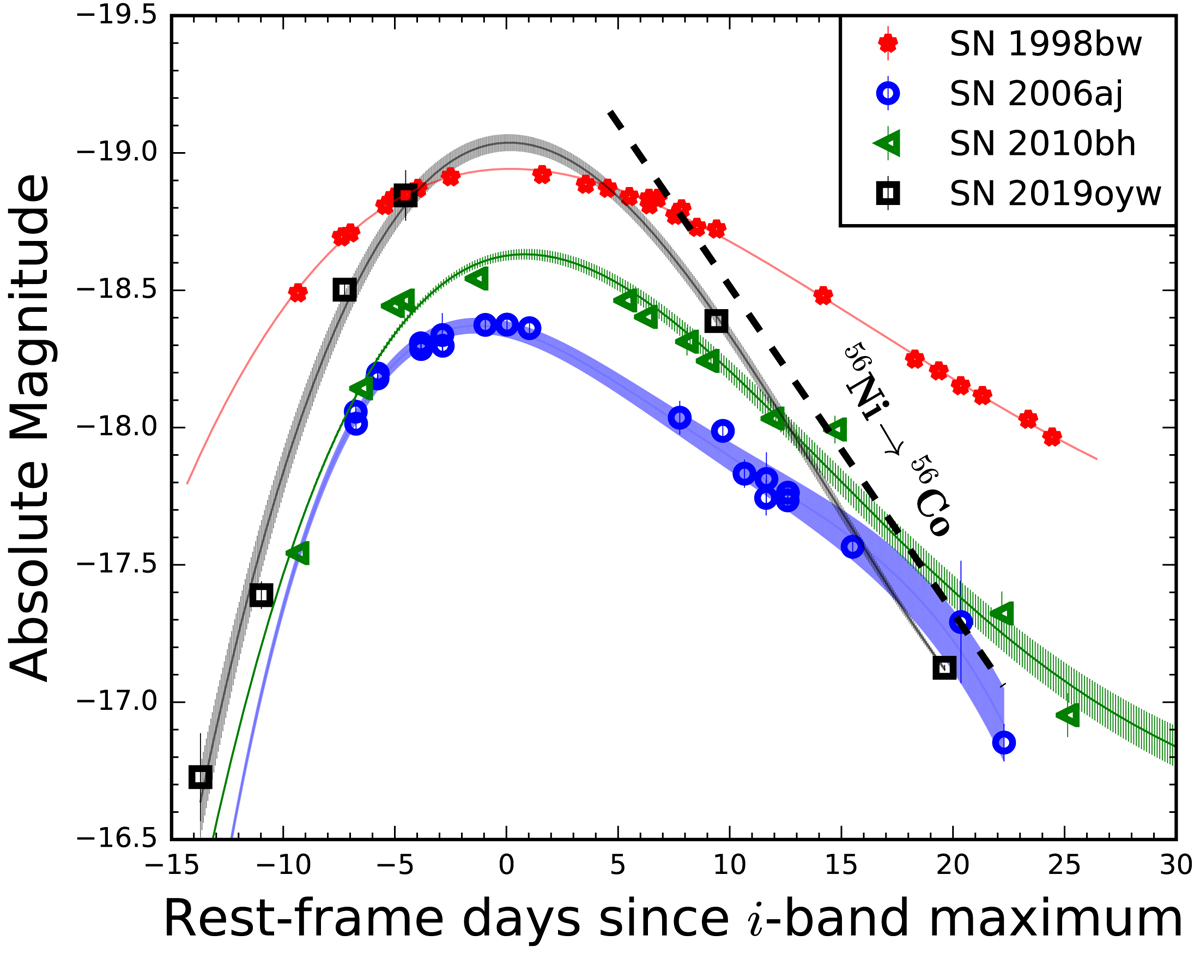
i-band light curve of SN 2019oyw presented along with three other well-studied GRB-SN events: SN 1998bw, SN 2006aj, and SN 2010bh. Light curves for the given SNe have been de-reddened (Galactic + Host absorption) and also magnitude values and phase have been shifted to the rest-frame. The constrained value of the peak brightness of SN 2019oyw is close to that estimated in the case of SN 1998bw. SN 2019oyw exhibits a post-peak decay rate close to that expected for the radioactive decay of 56Ni–> 56Co (black dotted line). The shaded region marks the 1σ contour for the corresponding best-fit light curve.
Current usage metrics show cumulative count of Article Views (full-text article views including HTML views, PDF and ePub downloads, according to the available data) and Abstracts Views on Vision4Press platform.
Data correspond to usage on the plateform after 2015. The current usage metrics is available 48-96 hours after online publication and is updated daily on week days.
Initial download of the metrics may take a while.