Fig. 2.
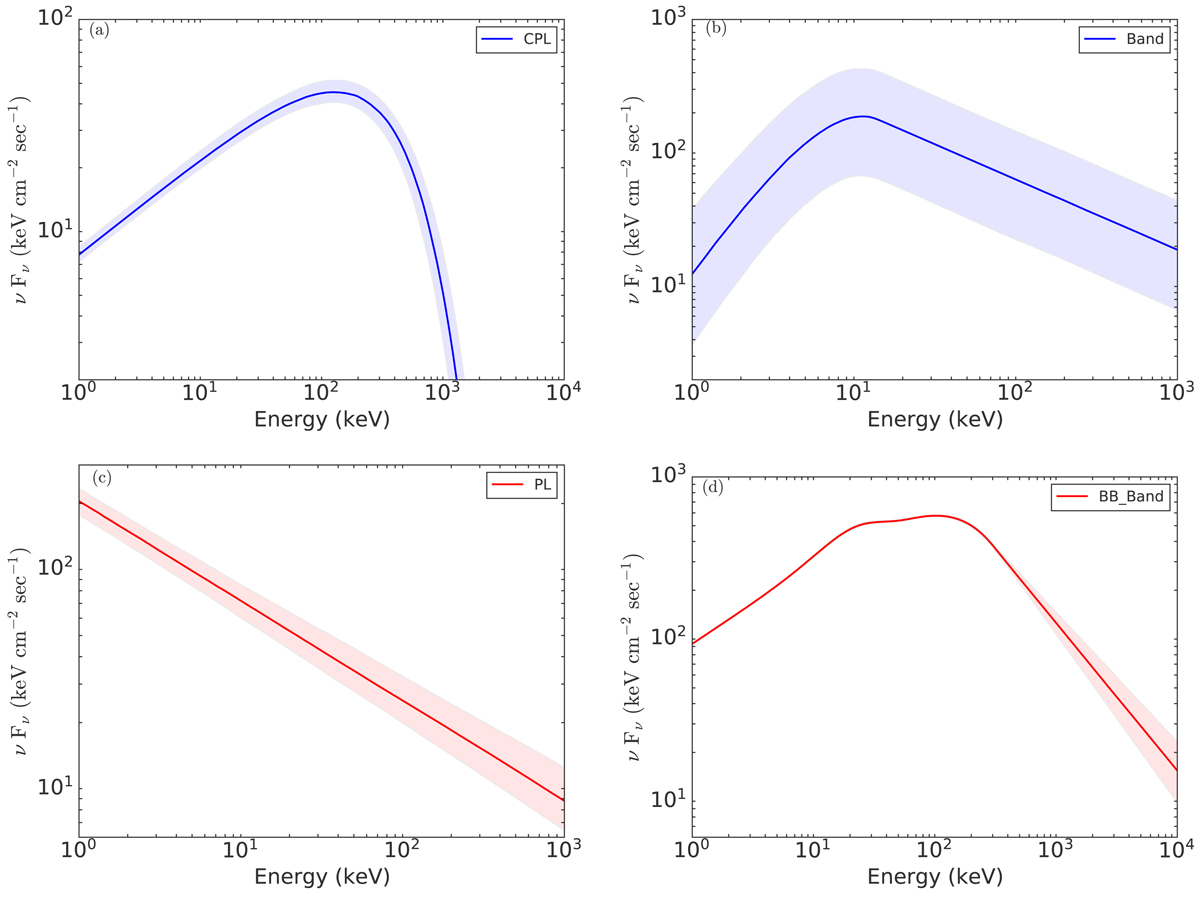
Best-fit time-integrated energy spectra of GRB 190829A (blue) and GRB 180728A (red) in model space using joint spectral analysis with different combinations of detectors (see Table 1). Panel a: first pulse of GRB 190829A is modelled with a Cut-off power-law model. Panel b: second pulse of GRB 190829A is best described with a Band function. Panel c: first pulse of GRB 180728A is modelled with a Power law model. Panel d: second pulse of GRB 180728A is described by a combination of Band and BB functions. The shaded regions mark the 1σ contour for the corresponding best fit model.
Current usage metrics show cumulative count of Article Views (full-text article views including HTML views, PDF and ePub downloads, according to the available data) and Abstracts Views on Vision4Press platform.
Data correspond to usage on the plateform after 2015. The current usage metrics is available 48-96 hours after online publication and is updated daily on week days.
Initial download of the metrics may take a while.