Fig. 7.
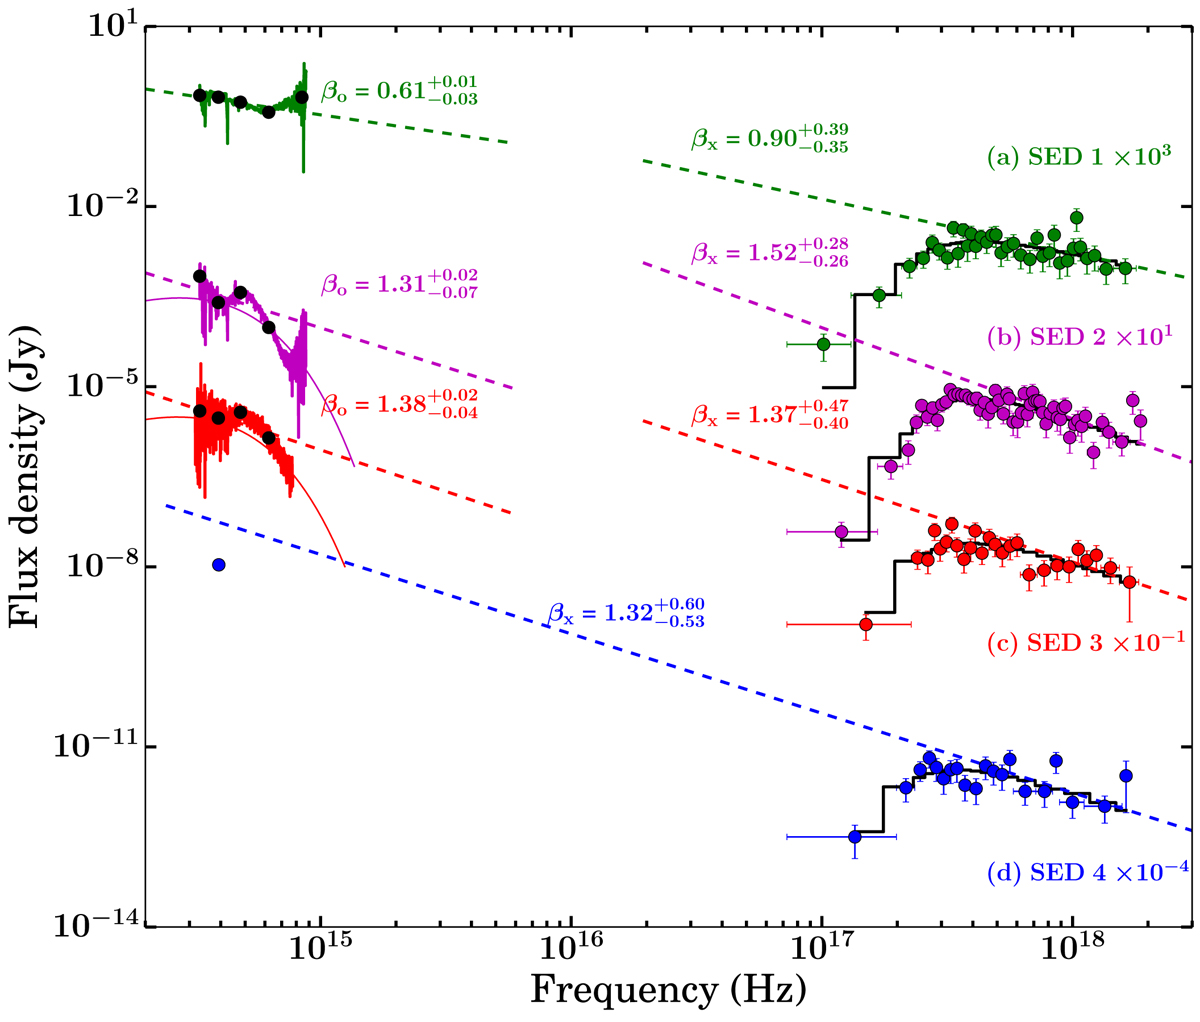
Spectral energy distributions of the GRB 190829A afterglow using the optical-XRT data. (a) SED at ∼0.37 d (green), (b) SED at ∼2.2 d (magenta), (c) SED at ∼4.34 d (red), and (d) SED at ∼14.3 d (close to the i-band peak) showing the absence of thermal emission at XRT frequencies. In (b) and (c) optical SEDs and fitted BB contributions are also plotted in respective colours as described in Sect. 3.2. The derived values of the spectral indices are provided in Table 4.
Current usage metrics show cumulative count of Article Views (full-text article views including HTML views, PDF and ePub downloads, according to the available data) and Abstracts Views on Vision4Press platform.
Data correspond to usage on the plateform after 2015. The current usage metrics is available 48-96 hours after online publication and is updated daily on week days.
Initial download of the metrics may take a while.