Fig. 6.
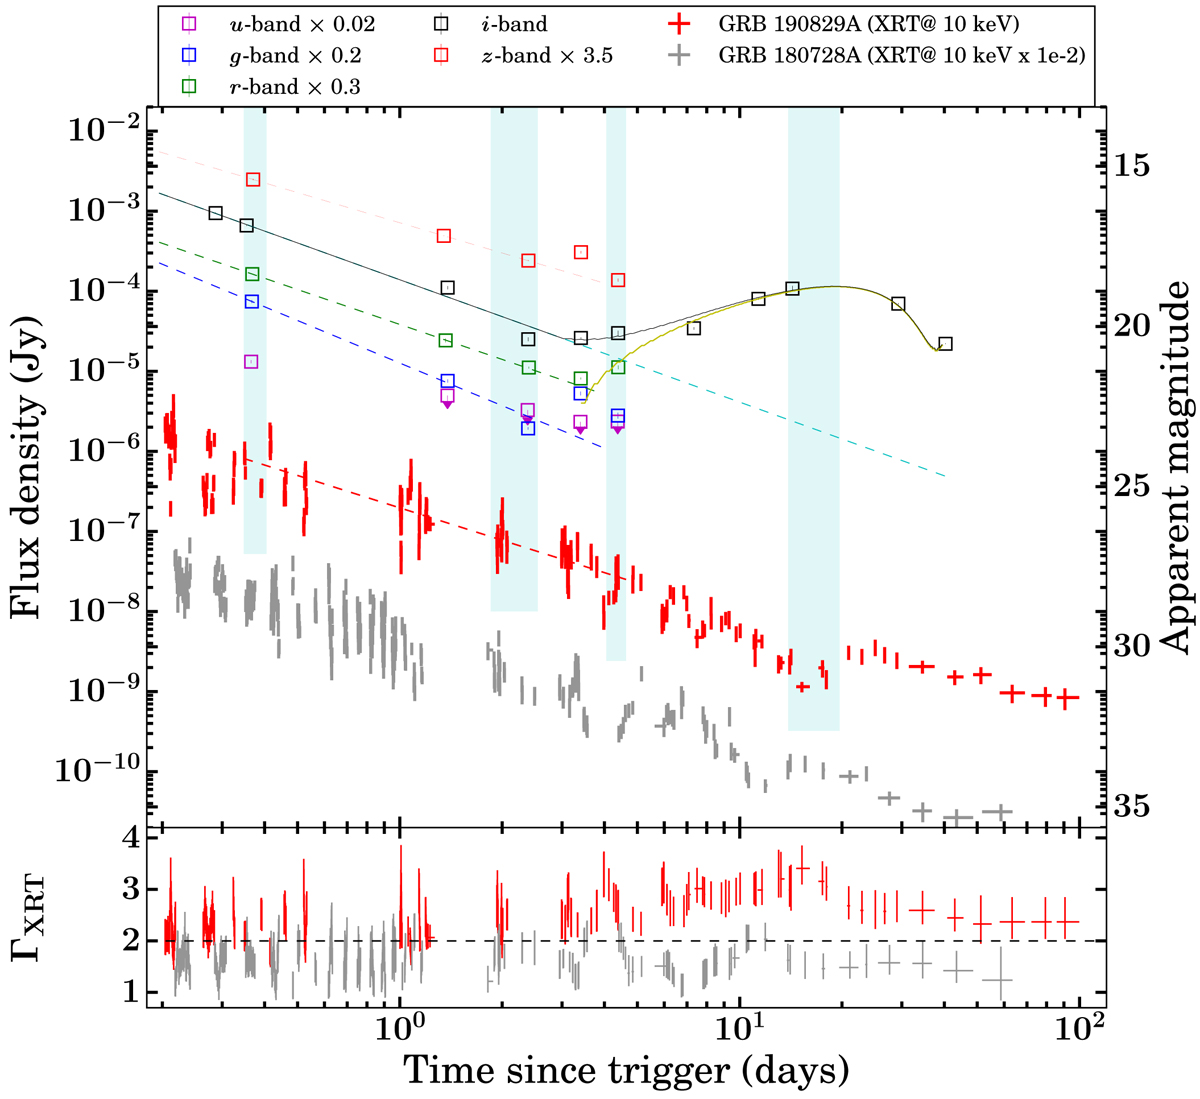
10.4 m GTC multi-band optical light curves (in flux density) of GRB 190829A/SN 2019oyw between 0.32 and 40.3 d post burst. The data are corrected for Galactic and host extinction, as discussed above. The i-band light curve of SN 2019oyw peaks around 20 d after the burst which appears to match with the late-time bump in the 10 keV Swift/XRT light curve (in red). The shaded vertical bars (in cyan) show the four epochs used to create the SED of the GRB 190829A afterglow. For comparison, the X-ray light curve (at 10 keV) of GRB 180728A (in grey) is also plotted; it has similar temporal features (including temporal decay indices, light-curve variability, late-time bump) to the X-ray light curve of GRB 190829A. Bottom panel: evolution of the XRT photon indices (ΓXRT) of the two GRBs discussed. The horizontal black dashed line shows ΓXRT equal to 2. The evolution of ΓXRT indicates late-time softening during the ‘SN phase’, and demands a detailed investigation using a larger subset of such events.
Current usage metrics show cumulative count of Article Views (full-text article views including HTML views, PDF and ePub downloads, according to the available data) and Abstracts Views on Vision4Press platform.
Data correspond to usage on the plateform after 2015. The current usage metrics is available 48-96 hours after online publication and is updated daily on week days.
Initial download of the metrics may take a while.