Fig. 4.
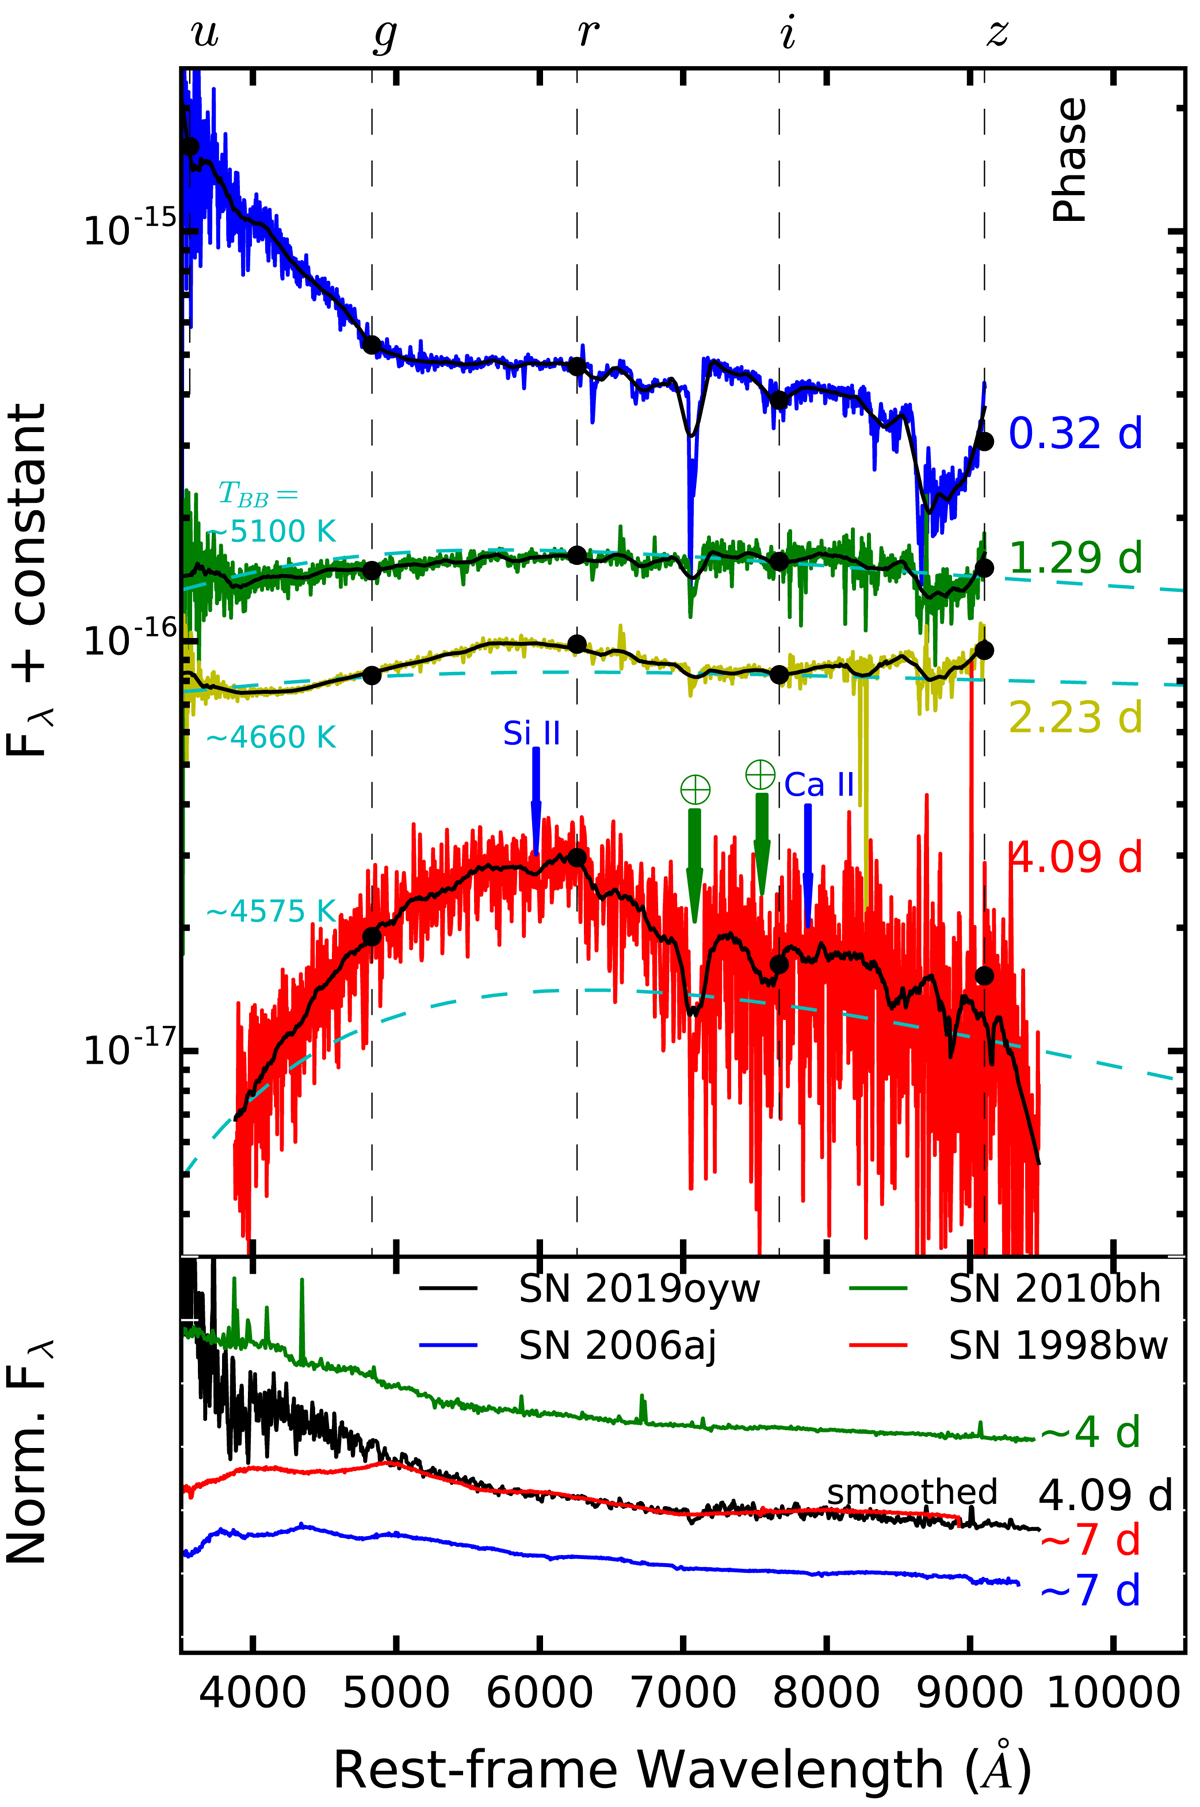
Spectroscopic evolution of GRB 190829A/SN 2019oyw from 0.32 to 4.09 d after the burst. The flux density as a function of the rest-frame wavelength is plotted after correcting spectra for Galactic and host extinctions. All the spectra presented in the upper panel have been corrected for grism losses and scaled to the observed photometric flux density values shown with black circles, wherever possible. Atmospheric features are indicated with green arrows in the spectrum at 4.09 d. The emission lines: Si II (λ6355 Å) and Ca II NIR (λ8498 Å, 8542 Å, and 8662 Å) are indicated by blue arrows. For clarity, random offsets in the Y-axis are applied to the smoothed spectra. An unusual bluer excess in the early spectrum taken at 0.32 d deviating from the overall power-law nature is also noticeable. Bottom panel: we display the spectrum of SN 2019oyw taken at ∼4.09 d (in black, smoothed) along with other GRB/SNe spectra: SN 1998bw (red), SN 2006aj (blue), and SN 2010bh (green).
Current usage metrics show cumulative count of Article Views (full-text article views including HTML views, PDF and ePub downloads, according to the available data) and Abstracts Views on Vision4Press platform.
Data correspond to usage on the plateform after 2015. The current usage metrics is available 48-96 hours after online publication and is updated daily on week days.
Initial download of the metrics may take a while.