Free Access
Fig. 3.
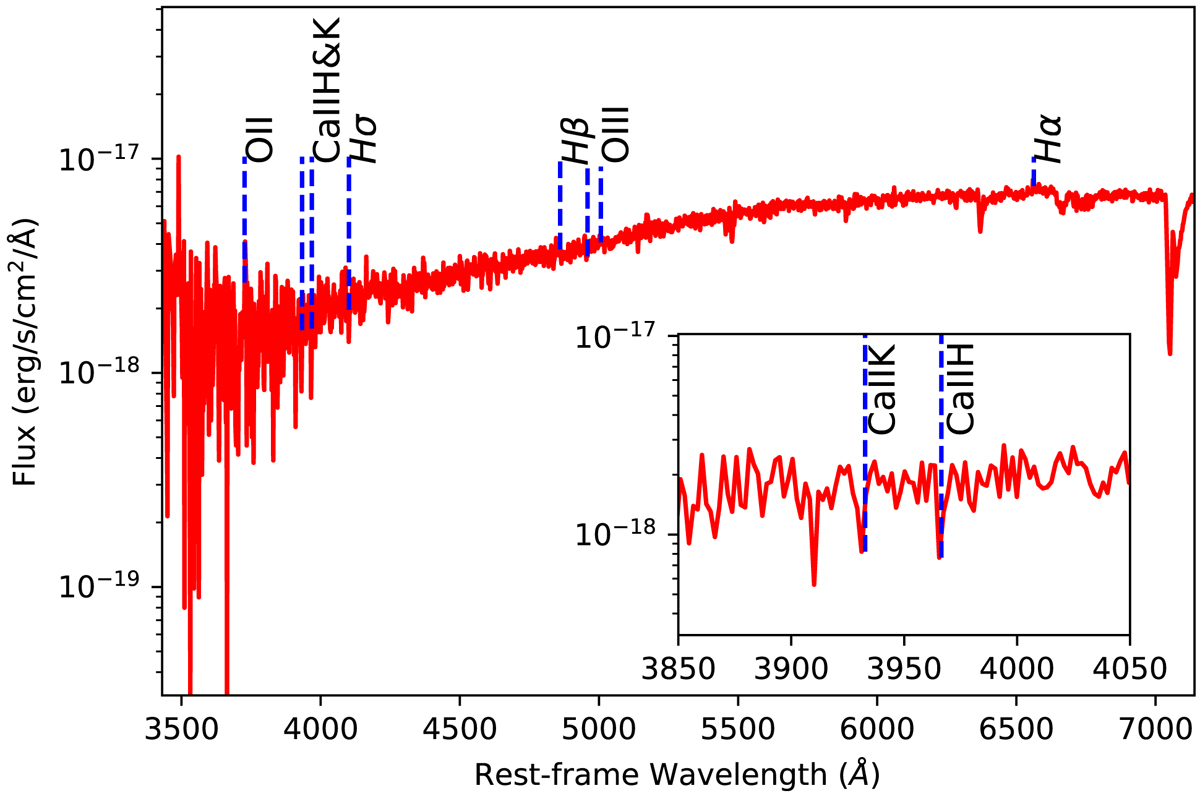
Optical spectrum from the 10.4 m GTC in the range 3500 − 7000 Å, which provides the redshift of GRB 190829A. The CaII lines are shown in absorption (see Inset) and the emission lines of the underlying host galaxy are found at the same redshift.
Current usage metrics show cumulative count of Article Views (full-text article views including HTML views, PDF and ePub downloads, according to the available data) and Abstracts Views on Vision4Press platform.
Data correspond to usage on the plateform after 2015. The current usage metrics is available 48-96 hours after online publication and is updated daily on week days.
Initial download of the metrics may take a while.