| Issue |
A&A
Volume 646, February 2021
|
|
|---|---|---|
| Article Number | A98 | |
| Number of page(s) | 13 | |
| Section | Stellar structure and evolution | |
| DOI | https://doi.org/10.1051/0004-6361/202039236 | |
| Published online | 16 February 2021 | |
The nature of VX Sagitarii
Is it a TŻO, a RSG, or a high-mass AGB star?⋆,⋆⋆
1
Instituto de Astrofísica e Ciências do Espaço, Universidade do Porto, CAUP, Rua das Estrelas, 4150-762 Porto, Portugal
e-mail: This email address is being protected from spambots. You need JavaScript enabled to view it.
2
Departamento de Física, Ingeniería de Sistemas y Teoría de la Señal, Universidad de Alicante, Carretera de San Vicente s/n, 03690 San Vicente del Raspeig, Spain
3
Instituto de Astrofísica de Canarias (IAC), 38205 La Laguna, Tenerife, Spain
4
Universidad de La Laguna (ULL), Departamento de Astrofísica, 38206 La Laguna, Tenerife, Spain
5
Departamento de Física Aplicada, Facultad de Ciencias, Universidad de Alicante, Carretera de San Vicente s/n, 03690 San Vicente del Raspeig, Spain
6
Departamento de Física de la Tierra y Astrofísica & IPARCOS-UCM (Instituto de Física de Partículas y del Cosmos de la UCM), Facultad de Ciencias Físicas, Universidad Complutense de Madrid, 28040 Madrid, Spain
Received:
22
August
2020
Accepted:
17
November
2020
Abstract
Aims. We present a spectroscopic analysis of the extremely luminous red star VX Sgr based on high-resolution observations combined with AAVSO light curve data. Given the puzzling characteristics of VX Sgr, we explore three scenarios for its nature: a massive red supergiant (RSG) or red hypergiant (RHG), a Thorne Żytkow object, and an extreme asymptotic giant branch (AGB) star.
Methods. Sampling more than one whole cycle of photometric variability, we derive stellar atmospheric parameters by using state-of-the-art PHOENIX atmospheric models. We compare them to optical and near-infrared spectral types. We report on some key features due to neutral elemental atomic species such as Li I, Ca I, and Rb I.
Results. We provide new insights into its luminosity, its evolutionary stage, and its pulsation period. Based on all the data, there are two strong reasons to believe that VX Sgr is some sort of extreme AGB star. Firstly, it has Mira-like behaviour during active phases. VX Sgr shows light variation with amplitude that is much larger than any known RSG and clearly larger than all RHGs. In addition, it displays Balmer line emission and, as shown here for the first time, line doubling of its metallic spectrum at maximum light, both characteristics typical of Miras. Secondly, unlike any known RSG or RHG, VX Sgr displays strong Rb I lines. In addition to the photospheric lines that are sometimes seen, it always shows circumstellar components whose expansion velocity is compatible with that of the OH masers in the envelope, demonstrating a continuous enrichment of the outer atmosphere with s-process elements, a behaviour that can only be explained by a third dredge-up during the thermal pulse phase.
Key words: stars: massive / stars: late-type / stars: fundamental parameters / stars: AGB and post-AGB / supergiants
Based (partly) on data obtained with the STELLA robotic telescopes in Tenerife, an AIP facility jointly operated by AIP and IAC.
Based (partly) on observations collected at the European Southern Observatory under ESO programme 298.D-5004(A).
© ESO 2021
1. Introduction
VX Sgr is an extremely luminous red star that exhibits fluctuating spectral veiling and semi-regular photometric and spectroscopic variations (Aller & Keenan 1951) shaped by quiescent and active variation phases. Due to the presence of SiO, OH, and H2O masers, it is believed to be wrapped inside a large molecular envelope. However, its nature is still unclear as its initial mass and evolutionary state are poorly constrained. For instance, while most of the analyses available in the literature consider VX Sgr a high-mass (M ≳ 10 M⊙) red supergiant (RSG) or even a red hypergiant (RHG; see Schuster et al. 2006), other authors (e.g. Chiavassa et al. 2010) instead suggest that the atmosphere of VX Sgr appears to be more similar to an oxygen-rich asymptotic giant branch (AGB; see Herwig 2005) star, with M ∼ 4–10 M⊙.
The high mass of VX Sgr is supported by its high luminosity, which critically depends on the distance adopted. According to the distance values determined during the last decades (see the briefing presented by Chen et al. 2007, and their Table 1), its luminosity has been estimated in the range −9.3 mag ≤ Mbol ≤ −7.8 mag (Lockwood & Wing 1982; Chen et al. 2007; Arroyo-Torres et al. 2013; Chiavassa et al. 2010; Liu et al. 2017). Therefore, according to most luminosity estimates, VX Sgr seems to be brighter than the most luminous AGB stars observed to date (Mbol ∼ −8 mag; Groenewegen et al. 2009; García-Hernández et al. 2009). However, it remains uncertain whether RSGs can actually reach such high luminosities. For example, Geneva evolutionary tracks (Ekström et al. 2012) predict that RSGs cannot simultaneously attain the high luminosity and the low effective temperature (Teff) seen in VX Sgr, although such stars are known to exist (i.e. RHGs). Moreover, RSGs with high initial masses (25 < M/M⊙ < 40) present luminosities up to Mbol ∼ −9.0 mag (Davies & Beasor 2018), but they quickly evolve back towards higher Teff.
After a careful analysis of the outer atmosphere of VX Sgr through spectro-interferometric imaging, Chiavassa et al. (2010) concluded that it qualitatively resembles a Mira-like star. In addition, they found that its H2O layers resemble those of an AGB, although they noted that their Mira model takes stellar parameters (i.e. M = 1.2 M⊙, Mbol ∼ −4.5 mag) that are not consistent with the expected parameters for VX Sgr. Similarly, the spectral and photometric variations of VX Sgr present more analogies to AGB stars with Mira-like variability than to most RSGs. Its visual magnitude exhibits peak-to-peak changes of up to 6 mag (see AAVSO1), whereas typical RSGs show changes no larger than 2 mag (Kiss et al. 2006). Even extreme RHGs (e.g. S Per, UY Sct, and VY CMa; Schuster et al. 2006) show a maximum peak-to-peak variation of only 4 mag, according to AAVSO photometric data. In the I band RSGs present variation amplitudes smaller than 0.45 mag, while AGB stars have larger amplitudes (Groenewegen et al. 2009). In contrast, VX Sgr has a peak-to-peak variation of 1.2 mag (Lockwood & Wing 1982) in that photometric band. We also note that the spectral variation of VX Sgr is unique among RSGs since it spans six spectral subtypes (from M4 to M10; Humphreys 1974; Lockwood & Wing 1982). Most Galactic RSG have variations of one subtype or less (White & Wing 1978), whereas the RHGs change by no more than two or three subtypes.
The veiling of VX Sgr (Humphreys 1974), which manifests itself as a weakening of all spectral features probably as a result of the scattering induced by the circumstellar shell (Massey et al. 2009), provides further evidence that VX Sgr does not match the hallmarks of RSGs. Veiling has been reported for Mira stars (e.g. Merrill et al. 1962) and extreme RHGs such as S Per or VY CMa, but not for RSGs, as far as we know. The sample of approximately 600 stars studied by Dorda et al. (2016) included only two veiled stars, S Per and UY Sct, which were already well-known RHGs.
After revisiting the information available in the literature about VX Sgr, we found a significant spread in distance determinations, with some authors placing VX Sgr much closer to us than usually assumed, which in turn translates into lower luminosity estimations, compatible with those of an AGB star. However, many features of VX Sgr do not match those of an AGB star. Firstly, when not veiled, the spectrum of VX Sgr has been classified as very luminous (luminosity class Ia; Humphreys 1974) independently from the distance adopted. Secondly, the circumstellar envelope of VX Sgr is not expected for a typical AGB star. For example, Richards et al. (2012) estimated the radius of the H2O maser cloud in VX Sgr to be an order of magnitude larger than those around known AGB stars. Arroyo-Torres et al. (2013), based on data from Chiavassa et al. (2010) and Su et al. (2012), also found that the SiO masers of VX Sgr are located at ∼3 stellar radii, while the SiO masers in AGB stars are mostly located at ∼2 stellar radii. On the other hand, these results for VX Sgr are consistent with those obtained for other RHGs, for example S Per (Richards et al. 2012) and AH Sco (Arroyo-Torres et al. 2013). Finally, we note that VX Sgr is by no means unique, in the sense that other RHGs share some of the features of VX Sgr. In addition, their extremely high luminosities, derived from accurate distances, are close to that of VX Sgr (Schuster et al. 2006; Arroyo-Torres et al. 2013).
In principle, some of the characteristics of VX Sgr, such as its high luminosity and its variability, could be more easily explained in a binary scenario. However, Kamohara et al. (2005) did not find a long secondary period in the AAVSO light curve caused by a tentative stellar companion to VX Sgr. Furthermore, they found that the circumstellar envelope of VX Sgr is nearly spherical. This result was later confirmed by Yoon et al. (2018), thus discarding signs of interaction with potential companions.
At this point, a question arises: What is the nature of VX Sgr? To find an answer we adopted a strategy different from previous studies. For several decades studies of VX Sgr have focused on either its circumstellar envelope or its structure since these features can be resolved by interferometric methods. VX Sgr has not been specifically studied through optical spectroscopy since the 1980s. Spectroscopic analysis tools and spectral classification techniques have significantly improved since then, and now it is possible to explore new scenarios for this fundamentally challenging star. In this work we discussed the possibilities of VX Sgr being a RSG/RHG, an AGB, or even a Thorne Żytkow object (TŻO). These purely hypothetical stars are red giants or supergiants that have engulfed their companion neutron star inside their cores and can thus theoretically reach the luminosities of RSGs. In addition, they will produce an overabundance of some chemical species such as Li (Podsiadlowski et al. 1995), as well as Ca or Rb (see Biehle 1994). Although their existence was first suggested by Thorne & Zytkow (1977), very few candidates have been proposed since then. One candidate is HV 2112, an extremely luminous OH/IR star located in the Small Magellanic Cloud (Levesque et al. 2014). However, Beasor et al. (2018) only found signs of an overabundance of Li, and concluded that HV 2112 is a thermally pulsing AGB star rather than a TŻO.
This manuscript is divided into seven different sections. In Sect. 2 we describe how the observations were obtained. In Sect. 3 we describe how the star was characterised. We report on different spectral features of the spectrum of VX Sgr in Sect. 4. We analyse the historical light curve of VX Sgr in Sect. 5. We discuss our findings in Sect. 6. Finally, the conclusions of this manuscript can be found in Sect 7.
2. Observations
We observed VX Sgr on 11 different epochs between 04-04-2016 and 06-06-2018. We used the STELLA echelle spectrograph (SES) at the 1.2 m robotic telescope STELLA (Izaña Observatory, Tenerife; see Weber et al. 2012) and the Ultraviolet and Visual Echelle Spectrograph (UVES) at the Very Large Telescope (VLT; Paranal Observatory; see Dekker et al. 2000). Most of our programme was done using SES (eight epochs), while only three epochs were obtained with UVES, under ESO proposal 298.D-5004(A). The spectral coverage of SES ranges from 3900 to 8700 Å with a spectral resolution of 55 000, whereas the red arm of UVES covers from 6800 to 11 000 Å with a spectral resolution of about 110 000. The UVES data were reduced using the corresponding ESO reduction pipeline2, whereas the SES data are automatically reduced on-site. We give further details of these spectroscopic observations in Table 1. Finally, as complementary data to our spectroscopic observations, we downloaded the photometric measurements registered by AAVSO. These data covers a time span of about 85 years from 1935-05-25 (BJD = 2427948) to 2020-07-27 (BJD = 2459055), which corresponds to the whole historical record available for VX Sgr in the AAVSO database.
Observations log, radial velocities and stellar parameters for VX Sgr.
3. Physical parameters
3.1. Distance to VX Sgr
The first distance estimation was inferred by Humphreys et al. (1972), who assumed that VX Sgr belongs to the OB association Sgr OB1, located at 1.5–1.7 kpc (Morgan et al. 1953; Humphreys 1975). Later, Humphreys (1974) derived a distance of 0.8 kpc using the photometry given by Lee (1970). A few years later Lockwood & Wing (1982) reported a photometric distance of 1.5 kpc. The trigonometric parallaxes obtained by HIPPARCOS led to distances even shorter than any previous estimations: ∼0.3 ± 0.2 kpc (van Leeuwen 2007). We believe that these measurements are, to a large extent, highly unreliable and not statistically significant (e.g. Pourbaix et al. 2003). This is caused by the combination of a large angular diameter (∼8.8 mas; see Monnier et al. 2004; Chiavassa et al. 2010), far larger than the parallax calculated, and the presence of convective bright spots which vary over time (Chiavassa et al. 2011; Pasquato et al. 2011). More recently, the Gaia Data Release 2 (GDR2; Gaia Collaboration 2018) has provided a parallax of π = 0.79 ± 0.23 for VX Sgr; from this value, Bailer-Jones et al. (2018) calculated a distance of  kpc, a value with a very high uncertainty, especially towards its upper limit.
In the past twenty years, with the exception of the GDR2, all the distances to VX Sgr have been calculated through the masers in its circumstellar structure. Marvel et al. (1998), Murakawa et al. (2003), and Xu et al. (2018) used H2O masers, and they all obtained similar distances: 1.7 ± 0.3, 1.8 ± 0.5, and  kpc, respectively. Likewise, Chen et al. (2007) and Su et al. (2018) derived a distance (using SiO masers) of 1.57 ± 0.27 and 1.10 ± 0.11 kpc, respectively. All these values, except that by Su et al. (2018), are in excellent agreement. Xu et al. (2018) showed that all the astrometric parameters (parallax, radial velocity, and proper motions) for VX Sgr are in good agreement with those found in the literature for Sgr OB1.
3.2. Radial velocities
We calculated the RVs following the cross-match algorithm described in Pepe et al. (2002), which computes the cross-correlation function (CCF) by using line masks around previously selected spectral features. Since the spectrum of VX Sgr is dominated by TiO molecular bands that cover both the optical and the near-infrared, we decided to use them to compute the RVs by employing a list of TiO vibro-rotational transitions from the Vienna Atomic Line Database3 (VALD3; Ryabchikova et al. 2015). Of these lines we selected only those transitions with wavelengths accurately measured in the laboratory. In particular, we sampled the CCF from −100 to 100 km s−1 with a step of 0.5 km s−1, using masks that are 1 km s−1 wide and proportionally weighted to their normalised intensity with respect to the stellar continuum. We assigned each individual weight according to the VALD3 extract stellar option using the coolest model available in the database (Teff = 3500 K and log g = 0.0 dex). Finally, we fitted a Gaussian profile to each individual CCF to obtain the corresponding RVs. Uncertainties in the RVs were calculated by means of the scheme described in Zucker (2003) using the implementation of Blanco-Cuaresma et al. (2014).
The uncertainties of our calculated radial velocities are smaller than the standard deviation of the individual measurements. Thus, we compared the radial velocities against the AAVSO light curve in Fig. 1. We found that our values are shifted with respect to the light curve. This behaviour has already been reported for pulsating Mira stars by Jorissen et al. (2016) and supported by the theoretical predictions of Liljegren et al. (2018). According to these two studies the maximum light occurs when the atmosphere reaches its maximum contraction, shortly after the maximum velocity is reached. This is precisely the behaviour we observed (see Fig. 1). Therefore, the velocity range that we observed in the individual measurements (see Table 1) is only due to the Mira-like behaviour of VX Sgr.
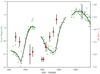 |
Fig. 1. Light curve of VX Sgr between February 2016 and October 2018, with our spectroscopic data superimposed. Green dots indicate individual photometric points, measured in visual magnitudes (left-y axis). The black line represents the smoothed light curve (i.e. 30 d binning). Red circles indicate the radial velocity of the corresponding spectrum (right-y axis). |
3.3. Stellar atmospheric parameters
We used the automatic tool STEPARSYN (Tabernero et al. 2018) to calculate the stellar parameters of VX Sgr. The latest version of STEPARSYN relies on emcee (Foreman-Mackey et al. 2013), a Markov chain Monte Carlo (MCMC) method used to fully sample the underlying distribution of the stellar atmospheric parameters. STEPARSYN has been used to infer stellar atmospheric parameters using atomic features (see e.g. Lohr et al. 2018; Negueruela et al. 2018; Tabernero et al. 2018; Alonso-Santiago et al. 2019). Unfortunately, the optical spectrum of VX Sgr is dominated by molecular absorptions. In consequence we must rely on an alternative indicator to the atomic lines; in particular, the TiO bands are a good proxy to model a star like VX Sgr (see e.g. García-Hernández et al. 2006, 2009). Thus, we selected the TiO band system at 7050 Å, as these molecular bands dominate the optical spectrum of VX Sgr. In addition, this TiO-band system is available in both the UVES and SES wavelength ranges.
We employed the state-of-the-art PHOENIX-ACES model grid (Husser et al. 2013) to fit our observations. Each synthetic spectrum in the PHOENIX grid is characterised by its effective temperature (Teff), surface gravity (log g), and metallicity ([M/H]). Among the spectra available in the grid, we selected those with Teff between 2300 and 4000 K. Metallicity and log g are known to be degenerate, but in almost all cases our best fit resulted in metallicity values very close to solar and log g below zero. Therefore, we fixed log g to −0.5 dex, following the prescription described in Zamora et al. (2014) and Pérez-Mesa et al. (2017), and fixed [M/H] to solar, which is also the expected metallicity for young stars in the disc of the Milky Way. In addition, we took into account the resolution and any remaining sources of broadening by means of a Gaussian kernel spanning from 1 to 20 km s−1 in full width at half maximum (FWHM). The Gaussian broadening accounts for both the macro-turbulence and the instrumental broadening. Given its size, we do not expect VX Sgr to have a large rotational velocity, and therefore any broadening that is not explained by the instrumental profile can be explained to a large extent by macroturbulence (ζ). Finally, our derived stellar parameters and their uncertainties can be found in Table 1; the best fits to the data are shown in Fig. A.1.
3.4. Luminosity
Several authors have inferred the luminosity of VX Sgr (as Mbol) by means of different methods alongside the distance measurements available to them. Lockwood & Wing (1982) derived Mbol from their photometric data. Assuming a distance of 1.5 kpc, they estimated a Mbol in the range −8.4 mag ≤ Mbol ≤ −7.8 mag. Chiavassa et al. (2010) used interferometric observations to calculate an angular diameter of Θ = 8.82 ± 0.5 mas. They assumed an Teff in the range from 3200 to 3400 K and a distance of 1.7 kpc to obtain a Mbol = −8.4 mag. Arroyo-Torres et al. (2013) later calculated the bolometric flux of VX Sgr through their spectro-interferometric observations. They used this value along with the angular diameter from Chiavassa et al. (2010) and a distance of 1.57 ± 0.27 kpc from Chen et al. (2007). Their results were Mbol = −9.3 mag and Teff ∼ 3750 K. Finally, Liu et al. (2017) modelled its SED from the optical to the infrared and obtained Mbol = −9.1 mag and Teff ∼ 3150 K.
The data currently available give room to two different methodologies for calculating the bolometric magnitude. On the one hand, a photometric method can be used, by calculating the bolometric magnitude through 2MASS magnitudes, but this compels us to assume an extinction (AV), which is by no means an easy task. Firstly, the calculation of AV to VX Sgr requires prior knowledge of the intrinsic colours of this star. In addition, the spectral variability of VX Sgr is extreme, ranging from M3 up to M10. Very luminous (Ia) M stars are also particularly scarce. In consequence, the calibrations available (e.g. Elias et al. 1985) extend only down to spectral type M4. Alternatively, we calculated the luminosity of VX Sgr by means of the following equation:
 (1)
(1)
The expression for Mbol given by Eq. (1) depends on three observable quantities: angular diameter (Θ), distance (d), and effective temperature (Teff). The measured angular sizes of VX Sgr can be found in the literature: 8.7 ± 0.3 and 8.82 ± 0.5 mas from Monnier et al. (2004) and Chiavassa et al. (2010), respectively. We averaged these two values into a single angular diameter of 8.76 ± 0.4 mas. In addition, we computed an average distance from the literature values listed in Sect. 3.1 by weighting each distance value with the inverse of its uncertainty, which yielded 1.44 ± 0.19 kpc. Finally, our measurements showed an average effective temperature of 3370 ± 100 K. We used these three quantities (namely Θ, d, and Teff) to calculate a Mbol of −8.6 ± 0.6 mag. The luminosity thus calculated is above the estimations for the most luminous AGB stars (Mbol − 8.2 mag) calculated by Doherty et al. (2015). In addition, our calculated Mbol is brighter than the maximum luminosity observed in a confirmed AGB (Mbol ∼ −8 mag; see Groenewegen et al. 2009; García-Hernández et al. 2009). However, the high luminosity in itself does not rule out an AGB nature for VX Sgr. Theoretical models for stars at the end of the AGB and super-AGB phases have convergence issues (see e.g. Lau et al. 2012) that currently make it impossible to produce any theoretical predictions to compare with the observational data.
3.5. Association membership
Traditionally, VX Sgr has been considered a member of Sgr OB1. This is a very large OB association that extends between l = 4° and l = 14° on both sides of the Galactic plane, corresponding to a size of ∼300 × 120 pc, at an estimated distance of 1.7 kpc (Humphreys 1978). Nevertheless, Sgr OB1 does not seem to be a homogeneous grouping. Mel’Nik & Efremov (1995) identified different spatial and kinematic subgroups. There is also a sizeable age spread. The open clusters NGC 6530 and NGC 6514 (M 20) are embedded in bright nebulosity (M 8 in the case of NGC 6530) and still forming stars, while the nearby NGC 6531 (M 21) has an estimated age of 12 Ma (McSwain & Gies 2005). Gaia DR2 data have confirmed this lack of homogeneity. The proper motions of NGC 6530 (∼ + 1.3 mas a−1, ∼ − 2.0 mas a−1; Damiani et al. 2019, Kuhn et al. 2019) are quite different from those of NGC 6514 (∼ + 0.4 mas a−1, ∼ − 1.7 mas a−1; Kuhn et al. 2019), which is less than  away in the sky and has approximately the same age. Conversely, the proper motions of NGC 6514 are very similar to those of the much older NGC 6531 (∼ + 0.5 mas a−1, ∼ − 1.5 mas a−1; Cantat-Gaudin et al. 2018).
The distances to these clusters, believed to be the core of the association, are lower than assumed forty years ago. Damiani et al. (2019) measure 1325 pc for NGC 6530, with a 9 % error. Kuhn et al. (2019) obtain  pc for NGC 6530 and
  pc for NGC 6514. No specific study has been conducted for NGC 6531, but a simple inversion of the average parallax found by Cantat-Gaudin et al. (2018) gives 1250 pc. All these values seem to agree on a distance of ∼1.3 kpc for the association. VX Sgr is located about one degree to the northeast of NGC 6531, the oldest cluster in the association. The proper motions derived by Xu et al. (2018), μα cos δ = 0.36 ± 0.76 mas a−1 and μδ = −2.92 ± 0.78 mas a−1, can be considered consistent with those of the cluster. There are very few studies aimed at NGC 6531. Using Strömgren photometry, McSwain & Gies (2005) derive an age of 12 Ma. This is roughly consistent with the value of ∼8 Ma found by Forbes (1996), as he was using earlier isochrones without overshooting, which result in younger ages. The brightest stars in the cluster are B1 V, with the exception of HD 164863, which is slightly earlier (Forbes 1996). With a mean E(B − V) = 0.28, Forbes (1996) finds a distance of 1.38 ± 0.08 kpc, consistent with the Gaia values for the association.
In all, the very likely membership of VX Sgr in Sgr OB1 suggests that its distance should be close to 1.3 kpc, which is marginally in tension with the values derived from H2O masers although not fully inconsistent, and lower than our weighted average value of 1.44 kpc although in agreement with its GDR2 parallax. Assuming a distance of only 1.3 kpc for VX Sgr would reduce its bolometric luminosity to −8.4 mag, still brighter than any known AGB star, but now roughly compatible within the errors with theoretical values.
On the other hand, membership offers little constraint on its mass. It is obvious that an evolved red star is not directly connected to any of the star-forming clusters. Claiming a connection to NGC 6531 would imply a mass of 12–14 M⊙ for standard evolution and ≲25 M⊙ for the product of a merger (as B1 V stars have around 10 M⊙; Harmanec 1988). Although the halo of NGC 6531 does not extend to the location of VX Sgr, the published spectral types of the early-type stars in its immediate vicinity, HD 165857 (B2 III), HD 165689 (B2 IV), or HD 165595 (B5 III), do not suggest an earlier age. Conversely, no known star in the neighbourhood of VX Sgr suggests a massive (M* ≳ 20 M⊙) population, while its interpretation as a RSG requires a mass close to 40 M⊙ (Arroyo-Torres et al. 2015).
4. Spectral features
4.1. Spectral classification
We provided two different sets of SpTs, determined by using classification in the optical range (4800–7700 Å) and in the near-infrared (7800–8900 Å). Firstly, we performed the optical classification using the procedure detailed in Dorda et al. (2018) to derive the SpTs from the SES spectra. Unfortunately, the spectra from UVES do not cover any wavelength bluer than 6750 Å, and in consequence we employed only the TiO band systems located at 7050 Å and at 7600 Å. Next, we performed the near-infrared classification according to the criteria proposed by Sharpless (1956) and Solf (1978). To that end, we employed the atlases published by Ginestet et al. (1994) and Carquillat et al. (1997) following the classification procedure presented in Negueruela et al. (2011, 2012) in the calcium triplet range (8500–8900 Å).
We present the calculated SpTs in Table 1, all of which are accurate down to one spectral subtype. These two classification methods lead to divergent SpTs, depending on the wavelength region considered. Our spectral types in the near-infrared are later than those obtained by using the optical range (already reported for VX Sgr by Humphreys 1974). Only the spectrum observed on 2018-06-06 is compatible in both spectral ranges; it is M3 in the optical and M4 in the near-infrared.
As spectral type and temperature show a large degree of correlation for earlier types (up to M3; see Tabernero et al. 2018, and references therein), we checked for a correlation between Teff and SpT for both the optical and near-infrared spectral types derived in this work. We calculated a correlation of r = −0.74 ± 0.22 for the infrared classification and r = −0.59 ± 0.27 for the optical. Thus, there is a correlation between the SpTs and Teff regardless of the spectral classification criteria employed, albeit with a weaker correlation in the case of the optical classification. In addition, we found that our effective temperatures follow the variations of the light curve (see Fig 2). In consequence, we would expect the SpTs to follow the variations in the light curve to some extent, although VX Sgr changes over a wide range of SpTs that are not well connected to Teff by any modern temperature scale. Nevertheless, these results support the idea that the light variation is linked to changes in the opacity of molecular layers in the upper part of the atmosphere (Humphreys 1974; Kamohara et al. 2005) caused by changes in the Teff.
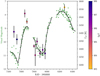 |
Fig. 2. Same as Fig. 1, but now circles indicate the Teff of the corresponding spectrum (right y-axis) while their colour indicates the optical SpT classification. |
4.2. Atomic features
We explored our spectra and looked for the presence of Li I, Ca I, and Rb I. The presence of these lines would be connected to internal processes at work inside VX Sgr. Following Pérez-Mesa et al. (2019) we inspected the Li I at 6707.76 Å and the Ca I line at 6462.58 Å. We did not find any signs of Li I, and the Ca I line is barely present in our observations (see Fig. 3).
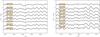 |
Fig. 3. Spectrum of VX Sgr around the Ca I line at 6462.58 Å (left) and the Li I line at 6707.76 Å (right). The spectra are labelled with the dates given in Table 1; the centre of the line is indicated by a black vertical line. |
The presence of Rb I in the spectrum of VX Sgr was already reported by García-Hernández et al. (2006). Consequently, we confirm that two Rubidium lines, 7800.26 Å and 7947.60 Å, are visible in the spectrum of VX Sgr (see Fig. 4). We found that these two lines were equally blueshifted with respect to their rest-frame wavelengths. We measured an average blueshift of −21.5 ± 0.9 km s−1 for both Rb I lines (see Table 2), which is consistent with the expansion velocities derived from OH masers already reported in the literature (19.8 and 23.0 km s−1 in te Lintel Hekkert et al. 1989; Chen et al. 2007, respectively). This agreement suggests that these blueshifted profiles are circumstellar, which is also the interpretation given by García-Hernández et al. (2006). Unfortunately, García-Hernández et al. (2006) did not provide any value for the Rb abundance of VX Sgr. However, the circumstellar component of VX Sgr is one of the strongest in their sample, which suggests a fair amount of Rb enhancement. To visualise it, we compare the Rb I lines of VX Sgr to those of the well-known RHGs BI Cyg and UY Sct (see Humphreys 1983; Arroyo-Torres et al. 2013) in Fig. 5. The plot shows that no Rb I lines (either photospheric or circumstellar) are present in the spectra of UY Sct and BI Cyg.
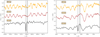 |
Fig. 5. Comparison of the spectrum of VX Sgr (2018-06-06, black) to the spectrum of UY Sct amd BI Cyg observed with the SES spectrograph around the Rb I lines at 7800.26 Å (left) and 7947.60 Å (right). The vertical line indicates the position of the Rb I lines, and the dashed vertical line indicate the position of the circumstellar Rb I component. |
Measured line centres of the circumstellar Rb I features.
Interestingly, two of our spectra (2016-04-04 and 2016-05-21; see Fig. 4) showed both photospheric and circumstellar components of the Rb I lines. According to the radiative transfer simulations of Zamora et al. (2014), their shape is connected to changes in the density of the circumstellar medium with respect to other epochs. A strong P Cygni profile develops, hiding the photospheric companion and resulting in the observed blueshift. Given that these two spectra are the first we acquired, we cannot know how long these double features were present. However, we know that in the next spectrum, taken four months later, the photospheric Rb component is missing. There is no trace of the photospheric Rb I lines in any of our spectra after these two, although they cover most of the magnitude range along the AAVSO light curve.
Finally, we examined the Balmer lines in the spectra for any signs of stellar activity. We found that Balmer lines are in emission on the two epochs close to the maximum brightness (see Table 1). A close-up view of the spectra around the Balmer lines up to Hδ is shown in Fig. A.2. We note that emission lines at light maxima had already been reported by Humphreys (1974).
4.3. Line-doubling
In the spectrum obtained during the second maximum light (2018-06-06; see Fig. 6), the last in our series, most atomic lines (mainly those of Ti I and Fe I) appear double. This effect is not observed on any other epoch. Line doubling effects have been reported for all types of luminous cool stars (Alvarez et al. 2001), and are believed to be caused by convective movements in the stellar atmosphere. This type of line doubling is unrelated to the presence of the circumstellar components observed in the Rb I lines.
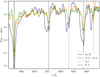 |
Fig. 6. Example of the line doubling of atomic features observed on the 2018-06-06 spectrum (green). For comparison, two other spectra obtained during the first light maximum (2016-09-22 in blue, and 2016-10-25 in orange) are shown. |
Line doubling has been observed in both RSGs and Mira stars, but its cause is different in each case, resulting in its appearance at different phases of the light curve (Jorissen et al. 2016). In Mira stars this effect is caused by the ascending movement of a shock wave through the atmosphere, in what is known as the Schwarzschild scenario. This shock wave is connected to the stellar pulsation, and thus line-doubling is seen around the maximum light of the photometric curve. On the contrary, in RSGs the duplication is caused by the rising of a new large convective cell (Kravchenko et al. 2019). In consequence, when observed, this effect takes place during the ascending part of the light curve.
5. Period analysis
The light curve of VX Sgr has been continuously registered by the AAVSO since 1935. This allowed Kukarkin et al. (1969) first, and Kamohara et al. (2005) later, to calculate the main photometric period of VX Sgr at 732 d and ∼750 d, respectively. We calculated the main period again through the Lomb-Scargle periodogram (see Fig. 7). We obtained a period at 757 d, which is similar to that obtained by Kamohara et al. (2005). Interestingly enough, our data show a peak at 28 279 d (∼77 a) that has never been reported before. Previous studies, such as Kukarkin et al. (1969) lacked enough data coverage, while Kamohara et al. (2005) dismissed periods above 12 000 d. Suggestively, a sinusoidal with this long period is in good agreement with the smoothed light curve shown in Fig. 8. However, this putative period at 28 279 d has roughly the same time span as the whole AAVSO lightcurve for VX Sgr, while at least two complete periods are required to confirm it. Finally, the third period found at 246 d is spurious (757−1 + 365−1 ≈ 246−1 d−1) and should be discarded altogether.
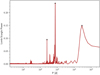 |
Fig. 7. Lomb-Scargle periodogram generated using the AAVSO light curve. The black crosses show the three signals found at 246 d, 757 d, and 28 279 d. |
Although the periodogram of VX Sgr exhibits a well-defined main period of 757 d, its light curve shows shows two different behaviours that have not been previously studied in detail. VX Sgr sometimes exhibits large photometric variability with peak-to-peak amplitudes between 4 and 6 mag, whereas at another times the peak-to-peak amplitudes are at about 2 mag. We refer to the first as active phases, and the second as quiescent phases. To study these two different photometric behaviours, we partitioned the light curve into nine different phases, four characterised by quiescence and five by activity. These phases are shown in Fig. 8 and described in Table 3. We calculated individual periodograms for each of the active phases (A1–A5) and quiescent phases (Q1–Q4) defined. We found a period of ∼770 d for phases A1, A3, and A4, whereas active phase A2 gave a shorter period of 720 d. In contrast, the current active phase (A5) displays a longer period of ∼931 d. However, this value must be considered with caution, as the present phase (A5) has not spanned two full periods yet and, as the phase progresses, the final period may result in a different value. Moreover, the start of the current phase is not well defined. The faintest minimum since the A4 and the maximum observed in 2016 have an appearance typical of active phases, but the variations are too fast compared with active phases, and so we left them out of A5. The time elapsed between the 2016 minimum and the next one, in 2017, is only ∼390 d, while the time between the 2016 maximum until the next in 2018 is only ∼500 d. These values are more typical of the variations seen during quiescent phases, and fit well with the rest of the phase Q4.
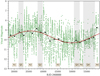 |
Fig. 8. Light curve of VX Sgr, from 1935-05-25 (BJD 2427948) to 2020-07-27 (BJD 2459055). Green dots indicate the visual magnitudes that make up the light curve. The black dots represent a 1514 d binning of the light curve (i.e. two periods of 757 d). The red curve is a sinusoidal toy model with a 28 279 d (∼77 a) period. The quiescent phases are shaded in grey, and are labelled at the bottom (see Table 3). |
Partition of the light curve of VX Sgr into five active (A1–A5) and four quiescent (Q1–Q4) phases.
The quiescent phases reveal a different periodic behaviour. Not only does the amplitude of the light curve decrease significantly, but the well-defined periodicity also seems to disappear. We obtained periods at 583, 652, and 624d for quiescent phases Q1, Q2, and Q4, respectively, whereas Q3 revealed three roughly equally tall peaks at 239, 685, and 1527 d. The signal at 1527 d should be taken with care because Q3 does not cover the time span necessary to fully sample it, whereas the 239 d signal is spurious (685−1 + 365−1 ≈ 239−1 d−1) and should be discarded. In the light of these results, we investigated the periodogram for the whole historical record of VX Sgr (see Fig. 7) and found a weak peak at roughly ∼602 d, which in turn is similar to the periodic signals that we found for quiescent phases.
6. Discussion
6.1. The nature of VX Sgr
VX Sgr is a fundamentally challenging star, given its characteristics. We consider first the possibility that VX Sgr might be a TŻO because these hypothetical stars can theoretically reach the luminosities of RSGs and they can produce a distintict chemical signature in their spectra. However, the Li I line at 6707.76 Å is not seen and the Ca I line at 6462.58 Å is barely present in our observations (see Fig. 3), while they are expected in a TŻO. Thus, we should rule out the TŻO scenario in favour of other possibilities such as VX Sgr being either a RSG/RHG or an AGB.
The key feature for understanding VX Sgr is the presence of strong Rb I lines in its spectrum, indicative of Rb overabundance when compared to other RHGs, as shown in Fig. 5 (BI Cyg and UY Sct; see Sect. 4.2). These Rb I lines are regularly detected in the spectra of candidate high-mass AGB stars (with masses ≥3 M⊙; García-Hernández et al. 2006, 2007). However, an enhanced Rb, as well as any other s-element, is completely unexpected in RSGs or RHGs as there are no theoretical mechanisms capable of producing a Rb overabundance in the atmosphere of these stars. These lines have not been observed in RSGs (e.g. Smith et al. 1995; Kuchner et al. 2002, see also Fig. 5). Thus, we should rule out the RSG/RHG scenario.
The Rb overabundance in AGB stars is a direct consequence of the s-process taking place in the stellar interior. Rubidium is dragged out to the surface later, during the third dredge-up that happens between thermal pulses (TPs; Herwig 2005). The efficient production of Rb only takes place in massive AGB stars (≳4–5 M⊙; see García-Hernández et al. 2006; Karakas et al. 2012; van Raai et al. 2012). In parallel, the Cameron-Fowler mechanism (Cameron & Fowler 1971; Mazzitelli et al. 1999) also happens in the stellar interior, and results in a lithium enrichment of the surface. However, while the enrichment of s-process elements (such as Rb) increases slowly over time, Li production is much faster, reaching a maximum early in the TP phase and then slowly decaying (Mazzitelli et al. 1999; van Raai et al. 2012). The presence of Rb together with the absence of Li (as is the case of VX Sgr) is expected in AGB stars at the end of their TP phase. Alternatively, this situation can happen, according to models (van Raai et al. 2012; Doherty et al. 2014), in some AGB stars earlier in the TP phase, due to temporary drops in Li abundance. However, Li drops are predicted to be smaller at higher stellar masses. An example of this can be seen in García-Hernández et al. (2013). Thus, a drop that results in non-detection of Li can only happen in intermediate-mass AGB stars (between ∼4–7 M⊙).
The high luminosity of VX Sgr is simply incompatible with an intermediate mass (∼4–7 M⊙). In addition, a number of factors hint at the idea that VX Sgr has depleted its Li because it is close to the end of its TP phase. Firstly, the abundance of Rb grows slowly over time, and does not experience significant drops during the TP phase. In consequence, the higher the abundance, the more evolved the AGB star must be. Although we cannot obtain a precise measurement of the Rb abundance, there is a strong reason to believe that the abundance of Rb is very high. García-Hernández et al. (2006) found that the Rb abundance is strongly correlated to the expansion velocity of the circumstellar envelope derived from OH masers (vexp(OH)). All the AGB stars with measured [Rb/Fe] in the sample of García-Hernández et al. (2006) have vexp(OH) < 16 km s−1. Those with the highest velocities have [Rb/Fe] values slightly below 2.5 dex. In the case of VX Sgr its vexp(OH) is even higher. te Lintel Hekkert et al. (1989) measured a vexp(OH) = 19.8 km s−1, while Chen et al. (2007) obtained vexp(OH) = 23.0 km s−1. These extreme values suggest that the Rb abundance of VX Sgr is higher than any other in the sample of García-Hernández et al. (2006). Secondly, according to García-Hernández et al. (2007), vexp(OH) is also correlated to the Li abundance. However, two of the three stars in their sample with vexp(OH) > 16 km s−1 have no Li (including VX Sgr), which suggests that they are evolved enough to have depleted their Li. Thirdly, the pulsation periods of AGB stars increase during the TP phase (Vassiliadis & Wood 1993; Doherty et al. 2014). VX Sgr has the longest period in the stellar sample studied by García-Hernández et al. (2007), and it is the only star among them with a pulsation period above 500 d that has no lithium, which is indicative of a more evolved stage. Thus, the presence of a significant circumstellar Rb strong absorption (García-Hernández et al. 2006) suggests that VX Sgr had enough time since the TP phase started to accumulate such a high abundance of Rb in its circumstellar envelope.
At this point it seems that VX Sgr is a massive AGB star close to the end of its TP phase. Nevertheless, there is a major objection to this scenario. In comparison with the most extreme TP AGB stars, VX Sgr seems to have a short main photometric period and a low circumstellar reddening. Moreover, these behaviours are linked. Theoretical models (Vassiliadis & Wood 1993; Doherty et al. 2014) predict that during the TP phase the photometric period becomes longer. Vassiliadis & Wood (1993) proposed that once the AGB reaches P = 500 d the mass-loss rate undergoes a sudden increase, which according to the most recent evidence can reach 3 × 10⁻⁵ M⊙ a−1 (Decin et al. 2019). This effect is known as superwind and should take place at some point during the TP phase. After the onset of the superwind, the photometric period grows very quickly (up to 2000 d). Observations show that the Rb-rich AGB stars with the longest periods (500–1500 d) are also those with the largest circumstellar reddenings and all of them have mass-loss rates around 10−5 M⊙ a−1 (García-Hernández et al. 2006; Pérez-Mesa et al. 2017).
A partial answer to this objection may be found in the work of Karakas et al. (2012). The abundance of Rb and the ratio [Zr/Rb] obtained by theoretical models are significantly lower than those measured in observations (Pérez-Mesa et al. 2017). The reason for this discrepancy lies in a property of the theoretical models: the activation of the superwind causes a dramatic slowdown in the s-process enhancement (see Karakas et al. 2012). In order to obtain the s-process element enhancement needed to match the observations Karakas et al. (2012) delayed the superwind phase until a period of 700–800 d was reached. The abundances predicted by these superwind models (for intermediate-mass stars of 5, 6, and 7 M⊙) have been validated with observational data by García-Hernández et al. (2013).
García-Hernández et al. (2007) showed that the IRAS colours of VX Sgr ([12]−[25]= − 0.74 and [25]−[60]= − 1.8) are a similar blue to those of AGB stars whose superwind has not started (those with short, < 400 d, and intermediate, < 700 d, periods). In contrast, the vast majority of AGB stars with long periods (> 700 d) exhibit much redder colours. Thus, VX Sgr has a comparatively thin envelope. This supports the delayed superwind scenario as an explanation for the characteristics of VX Sgr. Moreover, the lack of a thick circumstellar envelope in VX Sgr despite its high mass-loss rate, 1–6 × 10⁻⁵ M⊙ a−1 (Knapp et al. 1989; De Beck et al. 2010; Mauron & Josselin 2011; Liu et al. 2017; Gordon et al. 2018) suggests that its superwind phase may have started very recently. This is coherent with the typical delay in the superwind assumed by Karakas et al. (2012).
6.2. Mass of VX Sgr
Although the nature of VX Sgr, a massive AGB star close to the end of its TP-phase seems to be clear, there are two elements that must be adressed. Firstly, its likely membership to Sgr OB1 suggest its mass can be above 10 M⊙ (if directly associated with NGC 6531), which is at odds with the upper mass limit for AGB stars obtained by some authors (e.g. Doherty et al. 2015). However, models for single stars as massive as 12 M⊙ entering the AGB exist, given choices on semi-convection and convective stability (Poelarends et al. 2008; Siess 2006). Secondly, the high luminosity we derived for VX Sgr (Mbol = −8.6 ± 0.6 mag) is above the highest luminosities predicted for AGB stars of 9 to 10 M⊙ (Karakas et al. 2012; Doherty et al. 2015). Thus, assuming that the mass VX Sgr is higher than 10 M⊙ would explain its extraordinarily high luminosity. The alternative would imply that theoretical models are underestimating the luminosities that AGB stars with slightly below 10 M⊙ can reach.
6.3. What drives the variations in VX Sgr?
The mechanisms that drive Teff variations in VX Sgr have not been analysed in previous studies. The photometric periodic behaviour has been described as Mira-like pulsations (e.g. Humphreys 1974; Gordon et al. 2018). This is consistent with our conclusion that VX Sgr is an AGB star and is also supported by the duplication of atomic lines observed during the second light maximum. We thus confirm the Mira-pulsation nature of the main period of VX Sgr. Interestingly, line duplication is not seen in any of the two spectra obtained during the first maximum that we observed, even in the specra taken with UVES at much higher spectral resolution. In Sect. 5 we argued that this weak maximum and its precedent minimum belong to the quiescent phase. Therefore, the absence of line duplication during this maximum indicates that the variation during quiescent phases is not driven by shock-wave pulsations, as it is during active phases.
Additional information on the photometric variability of VX Sgr can be found in the data of the Diffuse Infrared Background Experiment (DIRBE; Price et al. 2010). They observed VX Sgr on a weekly basis from September 1989 to July 1993 (which corresponds to active phase A3) in the infrared bands at 1.25 μm, 2.2 μm, 3.5 μm, and 4.9 μm. From these observations, they derived the variation period for each band. They obtained 622 d for 1.25 μm and 3.5 μm bands, whereas the 3.5 μm band had a period of 625 d. In contrast, the reddest band at 4.9 μm exhibited a significantly longer period of 808 d, which is similar to the 770 d period found for the optical light during active phase A3. As circumstellar dust emission becomes significant at wavelengths longer than ∼3 μm (Woolf & Ney 1969), we can expect that the 4.9 μm band is dominated by the dust emission. Thus, its period is connected to the pulsations, as they affect the circumstellar envelope (by shock waves and by radiation due to the significant Teff variations). The other three bands, which are likely dominated by the stellar flux, do not seem to be connected to the pulsation but to the same signal which dominates the quiescent phases. This suggests that the process behind the variations seen in the quiescent phases are present during the active phases. However, when the pulsations responsible for the periodic behaviour of the active phases are present, they completely dominate the visual variation, obscuring the signals from the quiescent-type variability in that band.
In a large and evolved star, such as VX Sgr, the usual suspect for variability when pulsations are absent is the presence of large convective cells (Gray 2008; Stothers 2010; Kravchenko et al. 2019). The variations in VX Sgr during quiescent phases, with amplitudes of ∼2 mag in the visual band (see Fig. 8), are remarkably similar to those observed in typical RSGs (Kiss et al. 2006). This is not surprising as VX Sgr is of a similar size (between 1000 and 2000 R⊙, depending on the distance assumed; e.g. Monnier et al. 2004; Xu et al. 2018) to the luminous RSGs (Arroyo-Torres et al. 2015). Thus, the behaviour of the quiescent phases may well be caused by large convective cells. The RV curve before the first light maximum that we covered seems to anticipate it, although this maximum is likely not caused by a pulsation. This relation between the RV and the light curve has also been observed in RSGs and it is believed to be caused by large convective cells (see Kravchenko et al. 2019). However, the data available do not allow a final answer about the nature of the quiescent phases. Further observations during a quiescent phase will be necessary for that.
6.4. Thermal pulses in VX Sgr
As we have concluded that VX Sgr is a very massive TP AGB star, a possible explanation can be advanced for the signal likely found at 28 279 d. When a thermal pulse takes place the luminosity oscillates significantly (e.g. Vassiliadis & Wood 1993; Doherty et al. 2014; Pignatari et al. 2016). There are variations in luminosity as large as 75% (1.5 bolometric magnitudes), but also as small as 5%. As can be seen in Fig. 8, the 28 279 d signal has an amplitude of ∼1 mag, which is compatible with the observable effect of a thermal pulse. The time between individual thermal pulses in AGB stars is highly dependent on the mass of the star (Wood & Zarro 1981; Karakas et al. 2012; Doherty et al. 2015). It is about 104 at 5 M⊙, but at the highest masses explored by Doherty et al. (2015), above 9.5 M⊙, it can be as short as several decades, which is compatible with the signal of 28 279 d. This also would be in agreement with our previous conclusions about the mass of VX Sgr being close to the RSG limit. Interestingly, the smoothed light curve in Fig. 8 is nearly sinusoidal in shape. This shape is different from that predicted in the literature (see e.g. Wood & Zarro 1981; Iben & Renzini 1983) for low-mass AGBs. However, the shapes shown in Wood & Zarro (1981) are heavily dependent on the stellar mass, and in consequence they should be interpreted with care. It should be noted, however, that this scenario is purely speculative, and the nature of this signal at 28 279 d cannot be proved by our current data.
6.5. Is VX Sgr a super-AGB star?
We must consider the possibility that VX Sgr is a super-AGB star. These objects are AGB stars that can ignite their carbon cores prior to the TP phase. This ignition depends on several physical parameters, but mainly on the stellar mass and metallicity. According to theoretical models of Doherty et al. (2015), at metallicity Z = 0.02 we should expect a minimum mass of 8 M⊙ to ignite the carbon core. Since super-AGB stars are expected to possess higher masses, in addition to the presence of Li I or Rb I, the main observational factor used to propose a super-AGB candidate is the stellar luminosity (van Loon 2017). However, an enhanced Rb and a high luminosity are not enough to distinguish a high-mass AGB star from a super-AGB star (Doherty et al. 2015). Consequently, no super-AGB has been fully confirmed to the present date (van Loon 2017). On the other hand, O’Grady et al. (2020) have recently reported on a population of super-AGB candidates in the Magellanic Clouds. These authors find these stars to have overall characteristics (i.e. luminosity, mass, pulsation period) compatible with the expected properties of super-AGB stars, provided that they are burning carbon in their cores and have not reached the super-wind phase yet. VX Sgr shares some characteristics with these objects, but it is brighter than the upper luminosity range of the candidate super-AGB stars reported by O’Grady et al. (2020). The higher luminosity of VX Sgr, and other differences with respect to the candidates found by O’Grady et al. (2020) (e.g. the presence of Rb, the absence of Li, a significantly higher mass-loss) can be easily explained by the higher mass of VX Sgr, and perhaps also by a more advanced evolutionary stage. Of particular interest is the very luminous star HV 838, in the SMC (SMC-3 in O’Grady et al. 2020). This object presents a huge photometric variability (almost 3 mag in the I band) with a period of ∼660 d and extreme spectral type variability, ranging from late K to M8 (González-Fernández et al. 2015). These properties are similar to those of VX Sgr, with the earlier spectral types displayed attributable to the lower metallicity of the SMC. O’Grady et al. (2020) conclude that HV 838 is most likely a super-AGB star of 8–9 M⊙. However, with an estimated luminosity log(L*/L⊙) ≈ 4.8, HV 838 is still significantly fainter than VX Sgr. In the case of VX Sgr, the requisites of enhanced Rb and high luminosity are met, and the available hints support the idea that its mass may be above 10 M⊙. In this situation, with such a high mass, the probability of VX Sgr being a super-AGB is as high as it can be from a theoretical standpoint. Thus, we think that VX Sgr can be considered the first strong candidate to super-AGB star in the Milky Way.
7. Conclusions
In this work, we have calculated the stellar atmospheric parameters and radial velocities for VX Sgr on 11 different epochs. We summarise the conclusions below:
-
The presence of Rb together with the line-doubling during the maximum light confirm that VX Sgr is not a RSG. As it lacks strong line absorption due to Li I or Ca I, features expected in a TŻO, we conclude that it is an AGB star. If so, its observed characteristics imply that its initial mass is high, at least above 7 M⊙. Moreover, the extraordinary luminosity of VX Sgr combined with its likely membership to Sgr OB1 suggest that its mass is extraordinarily high (between 10 and 12 M⊙). This makes VX Sgr a strong candidate to be a super-AGB star.
-
Most of the distances calculated for VX Sgr result in Mbol brighter than the most luminous AGB stars already identified (Mbol ∼ −8 mag; Groenewegen et al. 2009; García-Hernández et al. 2009). The luminosity for the average of distance estimates, Mbol ∼ −8.6 ± 0.6 mag, is clearly above that limit. Thus, we conclude that VX Sgr actually is the most luminous AGB known to date.
-
The line-doubling of atomic lines during the second maximum that we observed confirms the Mira-like pulsational nature of the variations seen in VX Sgr during active phases. The presence of emission in the Balmer lines at maximum light is also typical of this type of star. On the other hand, the absence of this duplication during the previous maximum, the last peak in the previous quiescent phase, suggests that the pulsation of VX Sgr is not the drive behind the variations seen during quiescent phases. This second driving mechanism is at work during both active and quiescent active phases, but is obscured by the much more powerful pulsation during the former. After analysing the available data, we think that convective cells are a solid candidate to be this drive.
-
We have computed stellar parameters and SpTs for VX Sgr and found a good agreement between them. More observations are required to correctly sample these late SpTs, although we consider that a good correlation exists even though we only have 11 points to assess it. More points will be required to properly sample the Teff scale at these late SpTs, as demonstrated by Tabernero et al. (2018).
-
We observed two epochs in which we see a photospheric Rb I component, whereas a blueshifted circumstellar component is always present in both Rb I lines. This is the first time that such behaviour has been observed in an evolved star. The variation of these lines implies strong changes in the circumstellar envelope, probably related to the end of the last and extraordinarily long quiescent phase. The circumstellar components display expansion velocities compatible with those observed in OH masers. This outflow requires a regular supply of s-process elements to the stellar atmosphere.
-
We calculate a main period of 757 d, similar to the value obtained by Kamohara et al. (2005). However, this main period is the product of the overlap between the different main periods of the different phases that VX Sgr has been going through. In addition, we found a signal at 28 279 d (∼77 a) that provides a good overall fit to the AAVSO light curve. To our best knowledge this signal has never been reported before. Although the data available are insufficient to demonstrate whether this is a true periodic behaviour, we speculate that this variation may be connected with the thermal pulses expected for a very massive AGB star.
The American Association of Variable Star Observers; see their light curve generator at https://www.aavso.org/
Acknowledgments
We thank Dr. D. Aníbal García-Hernández for our fruitful conversations about VX Sgr and the advice about the methodology to analyse AGB spectral data. We gratefully acknowledge the variable star observations from the AAVSO International Database with contributions of observers worldwide and used in this research. This work has made use of data from the European Space Agency (ESA) mission Gaia (https://www.cosmos.esa.int/gaia), processed by the Gaia Data Processing and Analysis Consortium (DPAC, https://www.cosmos.esa.int/web/gaia/dpac/consortium). Funding for the DPAC has been provided by national institutions, in particular the institutions participating in the Gaia Multilateral Agreement. This research is partially supported by the Spanish Government Ministerio de Ciencia e Innovación (MICI) under grants FJCI-2014-23001, AYA2015-68012-C2-2-P, PGC2018-093741-B-C21/C22 (MICI/AEI/FEDER, UE). This work was also supported by Fundação para a Ciência e a Tecnologia (FCT) through the research grants UID/FIS/04434/2019, UIDB/04434/2020 and UIDP/04434/2020. HMT also acknowledges support from the FCT – Fundação para a Ciência e a Tecnologia through national funds (PTDC/FIS-AST/28953/2017) and by FEDER – Fundo Europeu de Desenvolvimento Regional through COMPETE2020 – Programa Operacional Competitividade e Internacionalização (POCI-01-0145-FEDER-028953). R. D. acknowledges support from the Spanish Government Ministerio de Ciencia e Innovación (MICI) through Grants PGC-2018-091 3741-B-C22 and SEV 2015-0548, and from the Canarian Agency for Research, Innovation and Information Society (ACIISI), of the Canary Islands Government, and the European Regional Development Fund (ERDF), under grant with reference ProID2017010115. EM acknowledges financial support from the Spanish Ministerio de Ciencia e Innovación through fellowship FPU15/01476.
References
- Aller, L. H., & Keenan, P. C. 1951, ApJ, 113, 72 [Google Scholar]
- Alonso-Santiago, J., Negueruela, I., Marco, A., et al. 2019, A&A, 631, A124 [Google Scholar]
- Alvarez, R., Jorissen, A., Plez, B., et al. 2001, A&A, 379, 305 [NASA ADS] [CrossRef] [EDP Sciences] [Google Scholar]
- Arroyo-Torres, B., Wittkowski, M., Marcaide, J. M., & Hauschildt, P. H. 2013, A&A, 554, A76 [NASA ADS] [CrossRef] [EDP Sciences] [Google Scholar]
- Arroyo-Torres, B., Wittkowski, M., Chiavassa, A., et al. 2015, A&A, 575, A50 [NASA ADS] [CrossRef] [EDP Sciences] [Google Scholar]
- Bailer-Jones, C. A. L., Rybizki, J., Fouesneau, M., Mantelet, G., & Andrae, R. 2018, AJ, 156, 58 [NASA ADS] [CrossRef] [Google Scholar]
- Beasor, E. R., Davies, B., Cabrera-Ziri, I., & Hurst, G. 2018, MNRAS, 479, 3101 [Google Scholar]
- Biehle, G. T. 1994, ApJ, 420, 364 [Google Scholar]
- Blanco-Cuaresma, S., Soubiran, C., Heiter, U., & Jofré, P. 2014, A&A, 569, A111 [NASA ADS] [CrossRef] [EDP Sciences] [Google Scholar]
- Cameron, A. G. W., & Fowler, W. A. 1971, ApJ, 164, 111 [Google Scholar]
- Cantat-Gaudin, T., Jordi, C., Vallenari, A., et al. 2018, A&A, 618, A93 [NASA ADS] [CrossRef] [EDP Sciences] [Google Scholar]
- Carquillat, M. J., Jaschek, C., Jaschek, M., & Ginestet, N. 1997, A&AS, 123, 5 [NASA ADS] [CrossRef] [EDP Sciences] [Google Scholar]
- Chen, X., Shen, Z.-Q., & Xu, Y. 2007, Chin. J. Astron. Astrophys., 7, 531 [Google Scholar]
- Chiavassa, A., Lacour, S., Millour, F., et al. 2010, A&A, 511, A51 [NASA ADS] [CrossRef] [EDP Sciences] [Google Scholar]
- Chiavassa, A., Pasquato, E., Jorissen, A., et al. 2011, A&A, 528, A120 [NASA ADS] [CrossRef] [EDP Sciences] [Google Scholar]
- Damiani, F., Prisinzano, L., Micela, G., & Sciortino, S. 2019, A&A, 623, A25 [NASA ADS] [CrossRef] [EDP Sciences] [Google Scholar]
- Davies, B., & Beasor, E. R. 2018, MNRAS, 474, 2116 [Google Scholar]
- De Beck, E., Decin, L., de Koter, A., et al. 2010, A&A, 523, A18 [NASA ADS] [CrossRef] [EDP Sciences] [Google Scholar]
- Decin, L., Homan, W., Danilovich, T., et al. 2019, Nat. Astron., 3, 408 [NASA ADS] [CrossRef] [Google Scholar]
- Dekker, H., D’Odorico, S., Kaufer, A., Delabre, B., & Kotzlowski, H. 2000, Proc. SPIE, 4008, 534 [Google Scholar]
- Doherty, C. L., Gil-Pons, P., Lau, H. H. B., Lattanzio, J. C., & Siess, L. 2014, MNRAS, 437, 195 [NASA ADS] [CrossRef] [Google Scholar]
- Doherty, C. L., Gil-Pons, P., Siess, L., Lattanzio, J. C., & Lau, H. H. B. 2015, MNRAS, 446, 2599 [Google Scholar]
- Dorda, R., González-Fernández, C., & Negueruela, I. 2016, A&A, 595, A105 [NASA ADS] [CrossRef] [EDP Sciences] [Google Scholar]
- Dorda, R., Negueruela, I., González-Fernández, C., & Marco, A. 2018, A&A, 618, A137 [Google Scholar]
- Ekström, S., Georgy, C., Eggenberger, P., et al. 2012, A&A, 537, A146 [NASA ADS] [CrossRef] [EDP Sciences] [Google Scholar]
- Elias, J. H., Frogel, J. A., & Humphreys, R. M. 1985, ApJS, 57, 91 [NASA ADS] [CrossRef] [Google Scholar]
- Forbes, D. 1996, AJ, 112, 1073 [NASA ADS] [CrossRef] [Google Scholar]
- Foreman-Mackey, D., Hogg, D. W., Lang, D., & Goodman, J. 2013, PASP, 125, 306 [Google Scholar]
- Gaia Collaboration (Brown, A. G. A., et al.) 2018, A&A, 616, A1 [NASA ADS] [CrossRef] [EDP Sciences] [Google Scholar]
- García-Hernández, D. A., García-Lario, P., Plez, B., et al. 2006, Science, 314, 1751 [NASA ADS] [CrossRef] [Google Scholar]
- García-Hernández, D. A., García-Lario, P., Plez, B., et al. 2007, A&A, 462, 711 [NASA ADS] [CrossRef] [EDP Sciences] [Google Scholar]
- García-Hernández, D. A., Manchado, A., Lambert, D. L., et al. 2009, ApJ, 705, L31 [NASA ADS] [CrossRef] [Google Scholar]
- García-Hernández, D. A., Zamora, O., Yagüe, A., et al. 2013, A&A, 555, L3 [NASA ADS] [CrossRef] [EDP Sciences] [Google Scholar]
- Ginestet, N., Carquillat, J. M., Jaschek, M., & Jaschek, C. 1994, A&AS, 108, 359 [NASA ADS] [Google Scholar]
- González-Fernández, C., Dorda, R., Negueruela, I., & Marco, A. 2015, A&A, 578, A3 [NASA ADS] [CrossRef] [EDP Sciences] [Google Scholar]
- Gordon, M. S., Humphreys, R. M., Jones, T. J., et al. 2018, AJ, 155, 212 [Google Scholar]
- Gray, D. F. 2008, AJ, 135, 1450 [Google Scholar]
- Groenewegen, M. A. T., Sloan, G. C., Soszyński, I., & Petersen, E. A. 2009, A&A, 506, 1277 [NASA ADS] [CrossRef] [EDP Sciences] [Google Scholar]
- Harmanec, P. 1988, Bull. astr. Inst. Czechosl., 39, 329 [Google Scholar]
- Herwig, F. 2005, ARA&A, 43, 435 [NASA ADS] [CrossRef] [Google Scholar]
- Humphreys, R. M. 1974, ApJ, 188, 75 [Google Scholar]
- Humphreys, R. M. 1975, PASP, 87, 433 [NASA ADS] [CrossRef] [Google Scholar]
- Humphreys, R. M. 1978, ApJS, 38, 309 [NASA ADS] [CrossRef] [EDP Sciences] [Google Scholar]
- Humphreys, R. M. 1983, ApJ, 269, 335 [NASA ADS] [CrossRef] [Google Scholar]
- Humphreys, R. M., Strecker, D. W., & Ney, E. P. 1972, ApJ, 172, 75 [Google Scholar]
- Husser, T. O., Wende-von Berg, S., Dreizler, S., et al. 2013, A&A, 553, A6 [NASA ADS] [CrossRef] [EDP Sciences] [Google Scholar]
- Iben, I., & Renzini, A. 1983, ARA&A, 21, 271 [NASA ADS] [CrossRef] [Google Scholar]
- Jorissen, A., Van Eck, S., & Kravchenko, K. 2016, Astrophys. Space Sci. Lib., 439, 137 [NASA ADS] [CrossRef] [Google Scholar]
- Kamohara, R., Deguchi, S., Miyoshi, M., & Shen, Z.-Q. 2005, PASJ, 57, 341 [Google Scholar]
- Karakas, A. I., García-Hernández, D. A., & Lugaro, M. 2012, ApJ, 751, 8 [NASA ADS] [CrossRef] [Google Scholar]
- Kiss, L. L., Szabó, G. M., & Bedding, T. R. 2006, MNRAS, 372, 1721 [Google Scholar]
- Knapp, G. R., Sutin, B. M., Phillips, T. G., et al. 1989, ApJ, 336, 822 [NASA ADS] [CrossRef] [Google Scholar]
- Kravchenko, K., Chiavassa, A., Van Eck, S., et al. 2019, A&A, 632, A28 [NASA ADS] [CrossRef] [EDP Sciences] [Google Scholar]
- Kuchner, M. J., Vakil, D., Smith, V. V., et al. 2002, ASP Conf. Ser., 263, 131 [Google Scholar]
- Kuhn, M. A., Hillenbrand, L. A., Sills, A., Feigelson, E. D., & Getman, K. V. 2019, ApJ, 870, 32 [Google Scholar]
- Kukarkin, B. V., Kholopov, P. N., Efremov,, Y. N., et al. 1969, General Catalogue of Variable Stars. Volume_1. Constellations Andromeda - Grus [Google Scholar]
- Lau, H. H. B., Gil-Pons, P., Doherty, C., & Lattanzio, J. 2012, A&A, 542, A1 [NASA ADS] [CrossRef] [EDP Sciences] [Google Scholar]
- Lee, T. A. 1970, ApJ, 162, 217 [NASA ADS] [CrossRef] [Google Scholar]
- Levesque, E. M., Massey, P., Żytkow, A. N., & Morrell, N. 2014, MNRAS, 443, L94 [Google Scholar]
- Liljegren, S., Höfner, S., Freytag, B., & Bladh, S. 2018, A&A, 619, A47 [NASA ADS] [CrossRef] [EDP Sciences] [Google Scholar]
- Liu, J., Jiang, B. W., Li, A., & Gao, J. 2017, MNRAS, 466, 1963 [Google Scholar]
- Lockwood, G. W., & Wing, R. F. 1982, MNRAS, 198, 385 [NASA ADS] [Google Scholar]
- Lohr, M. E., Negueruela, I., Tabernero, H. M., et al. 2018, MNRAS, 478, 3825 [Google Scholar]
- Marvel, K. B., Diamond, P. J., & Kemball, A. J. 1998, ASP Conf. Ser., 154, 1621 [Google Scholar]
- Massey, P., Silva, D. R., Levesque, E. M., et al. 2009, ApJ, 703, 420 [NASA ADS] [CrossRef] [Google Scholar]
- Mauron, N., & Josselin, E. 2011, A&A, 526, A156 [NASA ADS] [CrossRef] [EDP Sciences] [Google Scholar]
- Mazzitelli, I., D’Antona, F., & Ventura, P. 1999, A&A, 348, 846 [NASA ADS] [Google Scholar]
- McSwain, M. V., & Gies, D. R. 2005, ApJS, 161, 118 [Google Scholar]
- Mel’Nik, A. M., & Efremov, Y. N. 1995, Astron. Lett., 21, 10 [Google Scholar]
- Merrill, P. W., Deutsch, A. J., & Keenan, P. C. 1962, ApJ, 136, 21 [Google Scholar]
- Monnier, J. D., Millan-Gabet, R., Tuthill, P. G., et al. 2004, ApJ, 605, 436 [NASA ADS] [CrossRef] [Google Scholar]
- Morgan, W. W., Whitford, A. E., & Code, A. D. 1953, ApJ, 118, 318 [Google Scholar]
- Murakawa, K., Yates, J. A., Richards, A. M. S., & Cohen, R. J. 2003, MNRAS, 344, 1 [NASA ADS] [CrossRef] [EDP Sciences] [Google Scholar]
- Negueruela, I., González-Fernández, C., Marco, A., & Clark, J. S. 2011, A&A, 528, A59 [Google Scholar]
- Negueruela, I., Marco, A., González-Fernández, C., et al. 2012, A&A, 547, A15 [NASA ADS] [CrossRef] [EDP Sciences] [Google Scholar]
- Negueruela, I., Monguió, M., Marco, A., et al. 2018, MNRAS, 477, 2976 [Google Scholar]
- O’Grady, A. J. G., Drout, M. R., Shappee, B. J., et al. 2020, ApJ, 901, 135 [CrossRef] [Google Scholar]
- Pasquato, E., Pourbaix, D., & Jorissen, A. 2011, A&A, 532, A13 [NASA ADS] [CrossRef] [EDP Sciences] [Google Scholar]
- Pepe, F., Mayor, M., Galland, F., et al. 2002, A&A, 388, 632 [NASA ADS] [CrossRef] [EDP Sciences] [Google Scholar]
- Pérez-Mesa, V., Zamora, O., García-Hernández, D. A., et al. 2017, A&A, 606, A20 [NASA ADS] [CrossRef] [EDP Sciences] [Google Scholar]
- Pérez-Mesa, V., Zamora, O., García-Hernández, D. A., et al. 2019, A&A, 623, A151 [CrossRef] [EDP Sciences] [Google Scholar]
- Pignatari, M., Herwig, F., Hirschi, R., et al. 2016, ApJS, 225, 24 [Google Scholar]
- Podsiadlowski, P., Cannon, R. C., & Rees, M. J. 1995, MNRAS, 274, 485 [NASA ADS] [CrossRef] [EDP Sciences] [Google Scholar]
- Poelarends, A. J. T., Herwig, F., Langer, N., & Heger, A. 2008, ApJ, 675, 614 [Google Scholar]
- Pourbaix, D., Platais, I., Detournay, S., et al. 2003, A&A, 399, 1167 [Google Scholar]
- Price, S. D., Smith, B. J., Kuchar, T. A., Mizuno, D. R., & Kraemer, K. E. 2010, ApJS, 190, 203 [NASA ADS] [CrossRef] [Google Scholar]
- Richards, A. M. S., Etoka, S., Gray, M. D., et al. 2012, A&A, 546, A16 [NASA ADS] [CrossRef] [EDP Sciences] [Google Scholar]
- Ryabchikova, T., Piskunov, N., Kurucz, R. L., et al. 2015, Phys. Scr., 90, 054005 [Google Scholar]
- Schuster, M. T., Humphreys, R. M., & Marengo, M. 2006, AJ, 131, 603 [NASA ADS] [CrossRef] [Google Scholar]
- Sharpless, S. 1956, ApJ, 124, 342 [Google Scholar]
- Siess, L. 2006, A&A, 448, 717 [NASA ADS] [CrossRef] [EDP Sciences] [Google Scholar]
- Smith, V. V., Plez, B., Lambert, D. L., & Lubowich, D. A. 1995, ApJ, 441, 735 [NASA ADS] [CrossRef] [Google Scholar]
- Solf, J. 1978, A&AS, 34, 409 [Google Scholar]
- Stothers, R. B. 2010, ApJ, 725, 1170 [Google Scholar]
- Su, J. B., Shen, Z.-Q., Chen, X., et al. 2012, ApJ, 754, 47 [NASA ADS] [CrossRef] [Google Scholar]
- Su, J. B., Shen, Z.-Q., Chen, X., & Jiang, D. R. 2018, ApJ, 853, 42 [Google Scholar]
- Tabernero, H. M., Dorda, R., Negueruela, I., & González-Fernández, C. 2018, MNRAS, 476, 3106 [Google Scholar]
- te Lintel Hekkert, P., Versteege-Hensel, H. A., Habing, H. J., & Wiertz, M. 1989, A&AS, 78, 399 [NASA ADS] [Google Scholar]
- Thorne, K. S., & Zytkow, A. N. 1977, ApJ, 212, 832 [NASA ADS] [CrossRef] [EDP Sciences] [Google Scholar]
- van Leeuwen, F. 2007, A&A, 474, 653 [NASA ADS] [CrossRef] [EDP Sciences] [Google Scholar]
- van Loon, J. T. 2017, Mem. Soc. Astron. It., 88, 354 [Google Scholar]
- van Raai, M. A., Lugaro, M., Karakas, A. I., García-Hernández, D. A., & Yong, D. 2012, A&A, 540, A44 [Google Scholar]
- Vassiliadis, E., & Wood, P. R. 1993, ApJ, 413, 641 [Google Scholar]
- Weber, M., Granzer, T., & Strassmeier, K. G. 2012, Proc. SPIE, 8451, 84510K [CrossRef] [Google Scholar]
- White, N. M., & Wing, R. F. 1978, ApJ, 222, 209 [NASA ADS] [CrossRef] [Google Scholar]
- Wood, P. R., & Zarro, D. M. 1981, ApJ, 247, 247 [Google Scholar]
- Woolf, N. J., & Ney, E. P. 1969, ApJ, 155, L181 [NASA ADS] [CrossRef] [Google Scholar]
- Xu, S., Zhang, B., Reid, M. J., et al. 2018, ApJ, 859, 14 [Google Scholar]
- Yoon, D.-H., Cho, S.-H., Yun, Y., et al. 2018, Nat. Commun., 9, 2534 [Google Scholar]
- Zamora, O., García-Hernández, D. A., Plez, B., & Manchado, A. 2014, A&A, 564, L4 [NASA ADS] [CrossRef] [EDP Sciences] [Google Scholar]
- Zucker, S. 2003, MNRAS, 342, 1291 [Google Scholar]
Appendix A: Additional figures
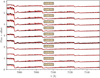 |
Fig. A.1. Best fit PHOENIX-ACES models (red) to our spectroscopic observations (black). |
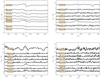 |
Fig. A.2. VX Sgr around the lines of the Balmer series (from Hα to Hδ). |
All Tables
Partition of the light curve of VX Sgr into five active (A1–A5) and four quiescent (Q1–Q4) phases.
All Figures
|
Fig. 1. Light curve of VX Sgr between February 2016 and October 2018, with our spectroscopic data superimposed. Green dots indicate individual photometric points, measured in visual magnitudes (left-y axis). The black line represents the smoothed light curve (i.e. 30 d binning). Red circles indicate the radial velocity of the corresponding spectrum (right-y axis). |
| In the text | |
|
Fig. 2. Same as Fig. 1, but now circles indicate the Teff of the corresponding spectrum (right y-axis) while their colour indicates the optical SpT classification. |
| In the text | |
|
Fig. 3. Spectrum of VX Sgr around the Ca I line at 6462.58 Å (left) and the Li I line at 6707.76 Å (right). The spectra are labelled with the dates given in Table 1; the centre of the line is indicated by a black vertical line. |
| In the text | |
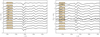 |
Fig. 4. Same as Fig. 3, but for the Rb I lines at 7800.26 Å (left) and 7947.60 Å (right). |
| In the text | |
|
Fig. 5. Comparison of the spectrum of VX Sgr (2018-06-06, black) to the spectrum of UY Sct amd BI Cyg observed with the SES spectrograph around the Rb I lines at 7800.26 Å (left) and 7947.60 Å (right). The vertical line indicates the position of the Rb I lines, and the dashed vertical line indicate the position of the circumstellar Rb I component. |
| In the text | |
|
Fig. 6. Example of the line doubling of atomic features observed on the 2018-06-06 spectrum (green). For comparison, two other spectra obtained during the first light maximum (2016-09-22 in blue, and 2016-10-25 in orange) are shown. |
| In the text | |
|
Fig. 7. Lomb-Scargle periodogram generated using the AAVSO light curve. The black crosses show the three signals found at 246 d, 757 d, and 28 279 d. |
| In the text | |
|
Fig. 8. Light curve of VX Sgr, from 1935-05-25 (BJD 2427948) to 2020-07-27 (BJD 2459055). Green dots indicate the visual magnitudes that make up the light curve. The black dots represent a 1514 d binning of the light curve (i.e. two periods of 757 d). The red curve is a sinusoidal toy model with a 28 279 d (∼77 a) period. The quiescent phases are shaded in grey, and are labelled at the bottom (see Table 3). |
| In the text | |
|
Fig. A.1. Best fit PHOENIX-ACES models (red) to our spectroscopic observations (black). |
| In the text | |
|
Fig. A.2. VX Sgr around the lines of the Balmer series (from Hα to Hδ). |
| In the text | |
Current usage metrics show cumulative count of Article Views (full-text article views including HTML views, PDF and ePub downloads, according to the available data) and Abstracts Views on Vision4Press platform.
Data correspond to usage on the plateform after 2015. The current usage metrics is available 48-96 hours after online publication and is updated daily on week days.
Initial download of the metrics may take a while.