Fig. 8.
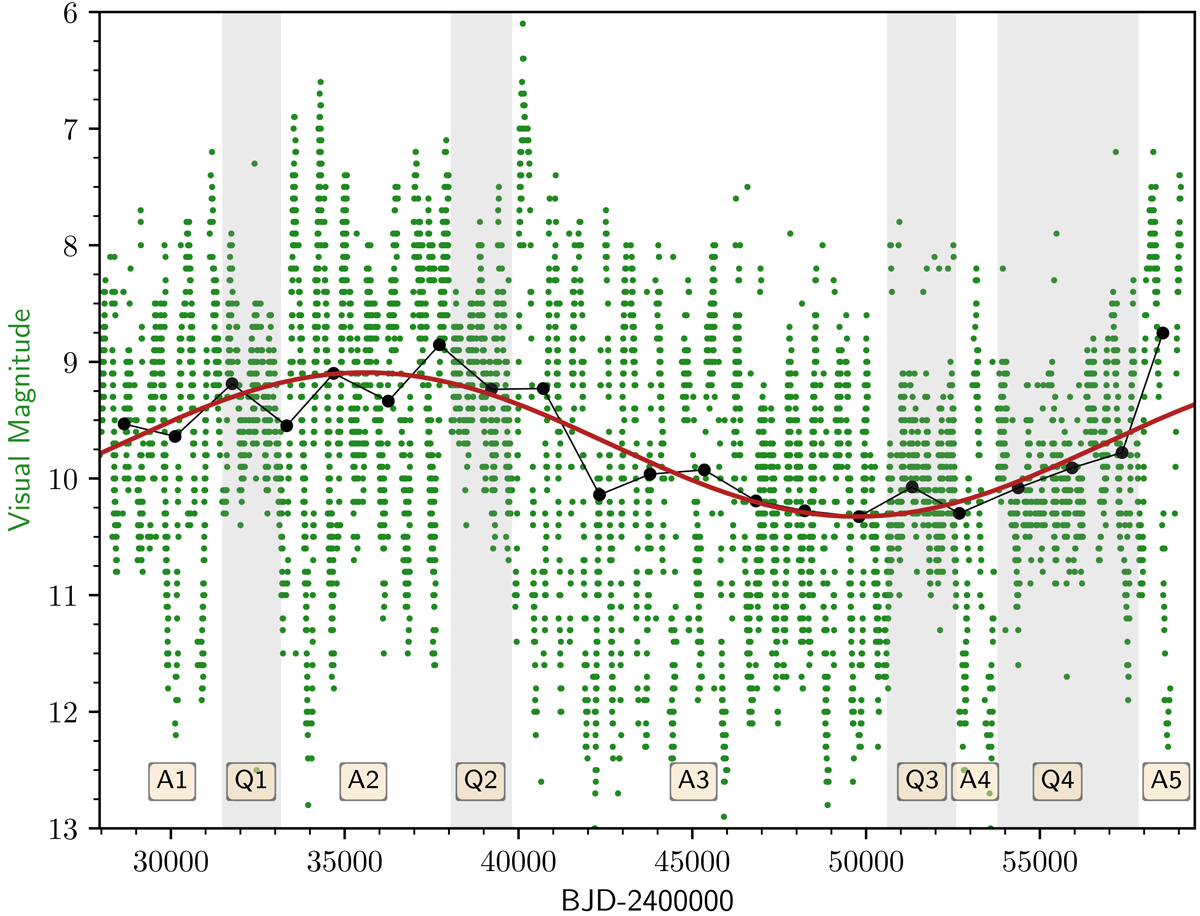
Light curve of VX Sgr, from 1935-05-25 (BJD 2427948) to 2020-07-27 (BJD 2459055). Green dots indicate the visual magnitudes that make up the light curve. The black dots represent a 1514 d binning of the light curve (i.e. two periods of 757 d). The red curve is a sinusoidal toy model with a 28 279 d (∼77 a) period. The quiescent phases are shaded in grey, and are labelled at the bottom (see Table 3).
Current usage metrics show cumulative count of Article Views (full-text article views including HTML views, PDF and ePub downloads, according to the available data) and Abstracts Views on Vision4Press platform.
Data correspond to usage on the plateform after 2015. The current usage metrics is available 48-96 hours after online publication and is updated daily on week days.
Initial download of the metrics may take a while.