Fig. 5.
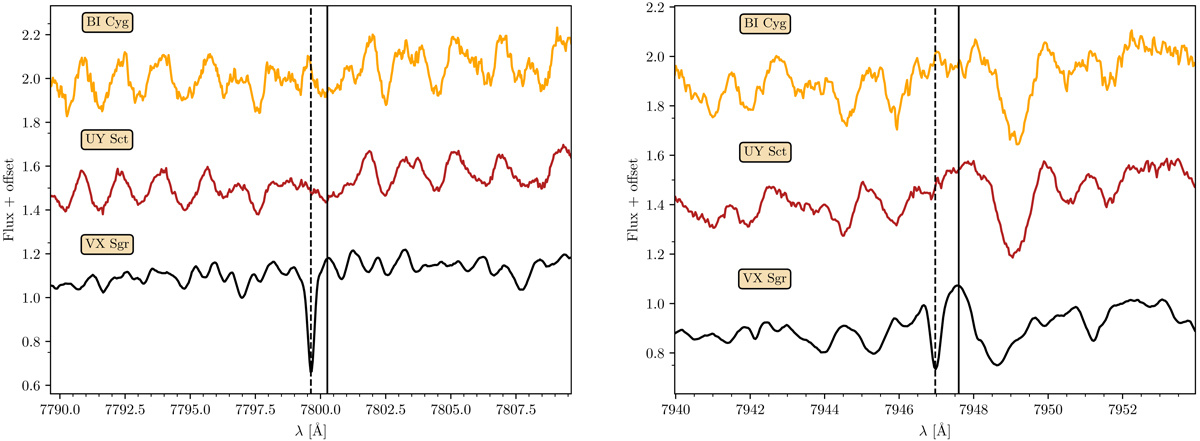
Comparison of the spectrum of VX Sgr (2018-06-06, black) to the spectrum of UY Sct amd BI Cyg observed with the SES spectrograph around the Rb I lines at 7800.26 Å (left) and 7947.60 Å (right). The vertical line indicates the position of the Rb I lines, and the dashed vertical line indicate the position of the circumstellar Rb I component.
Current usage metrics show cumulative count of Article Views (full-text article views including HTML views, PDF and ePub downloads, according to the available data) and Abstracts Views on Vision4Press platform.
Data correspond to usage on the plateform after 2015. The current usage metrics is available 48-96 hours after online publication and is updated daily on week days.
Initial download of the metrics may take a while.