| Issue |
A&A
Volume 644, December 2020
|
|
|---|---|---|
| Article Number | A118 | |
| Number of page(s) | 15 | |
| Section | Astrophysical processes | |
| DOI | https://doi.org/10.1051/0004-6361/202038721 | |
| Published online | 09 December 2020 | |
Nucleosynthesis imprints from different Type Ia supernova explosion scenarios and implications for galactic chemical evolution
1
Heidelberger Institut für Theoretische Studien, Schloss-Wolfsbrunnenweg 35, 69118 Heidelberg, Germany
e-mail: This email address is being protected from spambots. You need JavaScript enabled to view it.
2
Zentrum für Astronomie der Universität Heidelberg, Astronomisches Rechen-Institut, Mönchhofstr. 12-14, 69120 Heidelberg, Germany
3
Zentrum für Astronomie der Universität Heidelberg, Institut für Theoretische Astrophysik, Philosophenweg 12, 69120 Heidelberg, Germany
4
School of Science, University of New South Wales, Australian Defence Force Academy, Canberra, ACT 2600, Australia
5
Konkoly Observatory, Research Centre for Astronomy and Earth Sciences, MTA Centre for Excellence, Konkoly Thege Miklos 15-17, 1121 Budapest, Hungary
6
ELTE Eötvös Lorénd University, Institute of Physics, Pázmány Péter Sétány 1/A, Budapest 1117, Hungary
7
National Superconducting Cyclotron Laboratory, Michigan State University, East Lansing, MI 48824, USA
Received:
23
June
2020
Accepted:
19
October
2020
Abstract
We analyze the nucleosynthesis yields of various Type Ia supernova explosion simulations including pure detonations in sub-Chandrasekhar mass white dwarfs; double detonations and pure helium detonations of sub-Chandrasekhar mass white dwarfs with an accreted helium envelope; a violent merger model of two white dwarfs; and deflagrations and delayed detonations in Chandrasekhar mass white dwarfs. We focus on the iron peak elements Mn, Zn, and Cu. To this end, we also briefly review the different burning regimes and production sites of these elements, as well as the results of abundance measurements and several galactic chemical evolution studies. We find that super-solar values of [Mn/Fe] are not restricted to Chandrasekhar mass explosion models. Scenarios including a helium detonation can significantly contribute to the production of Mn, in particular the models proposed for calcium-rich transients. Although Type Ia supernovae are often not accounted for as production sites of Zn and Cu, our models involving helium shell detonations can produce these elements in super-solar ratios relative to Fe. Our results suggest a re-consideration of Type Ia supernova yields in galactic chemical evolution models. A detailed comparison with observations can provide new insight into the progenitor and explosion channels of these events.
Key words: nuclear reactions, nucleosynthesis, abundances / methods: numerical / stars: abundances / supernovae: general / white dwarfs / Galaxy: abundances
© ESO 2020
1. Introduction
Over the past two decades Type Ia supernovae (SNe Ia) have been the focus of interest of astrophysical studies primarily because of their application as distance indicators (Riess et al. 1998; Perlmutter et al. 1999) via the Phillips relation (Phillips 1993). As one of the signifcant sources for heavy elements in the Universe, however, they are also important as a main contributor to cosmic nucleosynthesis (Matteucci & Greggio 1986; Matteucci & Recchi 2001; Matteucci et al. 2006; Kobayashi et al. 2006, 2015, 2020; Kobayashi & Nomoto 2009). Although SNe Ia have been intensely studied in observational and theoretical approaches, the questions concerning their progenitors and explosion mechanisms remain open.
There is broad agreement that SNe Ia originate from the thermonuclear explosions of carbon-oxygen white dwarf (WD) stars (Hoyle & Fowler 1960). In some cases, however, also oxygen-neon WDs (Marquardt et al. 2015) or hybrid carbon-oxygen-neon WDs (Kromer et al. 2015; Willcox et al. 2016) may give rise to similar events. In most scenarios the explosion is triggered by the interaction with a binary companion. This rather unsharp characterization leaves room for a “zoo” of possible progenitor (e.g., Wang & Han 2012) and explosion scenarios (see, e.g., Hillebrandt & Niemeyer 2000; Hillebrandt et al. 2013). Potential progenitors can be subdivided into the single-degenerate (SD) scenario involving one WD accompanied by a main sequence, giant, or helium star (Whelan & Iben 1973) and the double-degenerate (DD) scenario consisting of a binary system of two WDs (Iben & Tutukov 1984). Another possibility, the core-degenerate scenario, has been proposed by Kashi & Soker (2011). Here a WD merges with a post-asymptotic giant branch (AGB) core already during the common envelope phase, and forms a new WD above the Chandrasekhar mass (MCh) that is stabilized by rotation. As the rotation slows down it might explode as a SN Ia.
From the explosion modeling point of view and the implied nucleosynthesis output, however, the mass of the WD at the time of explosion is the fundamental parameter (Seitenzahl et al. 2017). Generally, near-MCh models are distinguished from models in which the exploding WDs are significantly below the Chandrasekhar mass limit of approximately 1.4 M⊙. Finally, the characteristics of the explosion is governed by the combustion mechanism. A thermonuclear combustion wave is formed via a runaway process during convective burning, due to dynamical interaction in a WD merger, or by converging shock waves. In the first case a subsonic deflagration propagates via heat conduction. The two other cases may lead to the formation of a supersonic detonation where, in contrast, the fuel is heated and burned by the compression of a shock wave (see, e.g., Röpke et al. 2017 for a review of thermonuclear combustion in SNe Ia).
It is not clear yet which of the various possible explosion mechanisms can account for SNe Ia. In addition to the bulk of normal SNe Ia obeying the Phillips relation, a variety of subclasses of SNe Ia have been identified (see Taubenberger 2017 for a review), and therefore it is plausible that more than one scenario contributes to the overall class of SNe Ia.
One approach to check the validity of a certain scenario is to conduct multidimensional hydrodynamical simulations of the explosion phase together with the subsequent calculation of synthetic observables, such as light curves and spectra. These can then be compared to observations of SNe Ia and the initial model can be accepted, discarded, or adjusted accordingly. This exercise has been carried out during the past years for a variety of explosion scenarios, and although suitable explanations of subclasses could be identified, there is no fully convincing model for the bulk of normal SNe Ia yet (Blinnikov et al. 2006; Kasen & Plewa 2007; Blondin et al. 2011; Röpke et al. 2012; Seitenzahl et al. 2013a; Sim et al. 2013; Fink et al. 2014; Kromer et al. 2013; Townsley et al. 2019; Gronow et al. 2020).
Another test of the realization of specific explosion scenarios are abundance measurements in stars combined with galactic chemical evolution (GCE) models (Matteucci et al. 2006; Travaglio et al. 2014; Kobayashi et al. 2011). Among other ingredients, these models assume certain rates, delay-time distributions, and nucleosynthesis yields for various kinds of SNe Ia and core-collapse supernovae (CCSNe). The enrichment of the investigated stellar population or galaxy with metals is then compared to stellar abundances derived from spectroscopy and thus allows us to infer the origin of a particular element or group of elements. This is the reason why the characteristic imprints of a certain explosion scenario are of great interest.
A prominent example is the case of the element manganese. It is widely accepted that the primary contribution to Mn stems from SNe Ia since the observed values of [Mn/Fe] in the Galaxy increase from [Fe/H] ≈ − 1 to the solar value, and CCSN yields predict sub-solar values for [Mn/Fe] (Timmes et al. 1995; McWilliam 1997; Kobayashi et al. 2006, 2011, 2020; Kobayashi & Nomoto 2009; Weinberg et al. 2019). This “SN Ia knee” has already been explained by Tinsley (1979), Greggio & Renzini (1983), and Matteucci & Greggio (1986) since it coincides nicely with the decrease in the α-elements (i.e., [α/Fe]) produced by CCSNe from their super-solar plateau at lower [Fe/H]. Seitenzahl et al. (2013b) picked this up arguing that Mn is produced at high burning densities in normal freeze-out from nuclear statistical equilibrium (NSE; see Sect. 2), and therefore it predominantly originates from MCh explosions. The best agreement with the data is achieved if SNe Ia arise equally from sub-MCh and MCh progenitors. These results have been further refined in the recent work of Eitner et al. (2020). Their non-LTE measurements of Mn in a sample of 42 stars in the Galaxy show a rather flat evolution of [Mn/Fe] near the solar value lowering the contribution of MCh SNe Ia to about 25%. The trend in [Mn/Fe] is not so clear in dwarf spheroidal galaxies (dSphs), but various works also find that a SN Ia contribution to Mn is required to explain observations (Cescutti et al. 2008; North et al. 2012; Cescutti & Kobayashi 2017). Another study carried out by McWilliam et al. (2018) claims that the most metal-rich star in Ursa Minor, COS 171, was enriched by a low-metallicity, low-mass sub-MCh detonation. In particular, its low [Mn/Fe] and [Ni/Fe] values exclude a MCh origin. Furthermore, the sub-solar amounts of Cu and Zn in COS 171 are also a hint for a low-mass progentior of the SN explosion which has enriched the star since these elements are produced in strong α-rich freeze-out. Moreover, de los Reyes et al. (2020) attribute different [Mn/Fe] values in dSphs to their specific star formation history. The combination of sub-solar [Mn/Fe] and a short star burst, as seen in Sculptor, indicates a dominant role of sub-MCh explosions. In contrast, Fornax and Leo I show a long-lasting star formation and [Mn/Fe] around the solar value, which points to an increasing enrichment via near-MCh SNe Ia.
Our work analyzes the nucleosynthetic yields of various models for SNe Ia, namely pure deflagrations and delayed detonations in MCh WDs, as well as pure detonations and double detonations of sub-MCh WDs. The aim is not to go into detail about the observational implications of specific isotopes or to evaluate whether the model matches any observed SN Ia, but to identify specific abundance patterns that are characteristic for particular explosion scenarios, and therefore to constrain whether this scenario is required to produce the observed elemental and isotopic abundances. The key discriminant is the initial mass of the WD that sets its central density, mainly determining the freeze-out regime reached by the burning region. Normal freeze-out from NSE, for instance, requires high densities only reached in MCh WDs, and the presence of a helium detonation yields unique abundance patterns not produced in explosive carbon-oxygen burning. Moreover, electron capture significantly reduces the electron fraction at high densities, and therefore shifts the nucleosynthesis yields in NSE to more neutron rich isotopes (see Sect. 2.2). Thus, the occurrence of iron group elements (IGEs) with a considerable neutron excess suggests the Chandrasekhar mass scenario (Yamaguchi et al. 2015).
This work is structured in the following way. In Sect. 2 we first review the different burning regimes and then summarize the explosion models investigated. Section 3 presents the results of our nucleosynthesis analysis, and we discuss the implications of these results for the nature of the progenitor for SNe Ia. The elements Mn, Zn, and Cu are of particular interest. Because we find substantial amounts of the unstable radionuclides 68Ge, 68Ga, and 65Zn, we briefly test their potential impact on the observables. In Sect. 4 we summarize our findings.
2. Explosion models and burning regimes
2.1. Explosive silicon burning
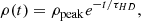
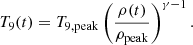
In a thermonuclear supernova explosion the innermost (i.e., densest) part of the WD star reaches temperatures sufficiently high for silicon burning, and thus significantly contributes to the production of IGEs. Woosley et al. (1973) divide the parameter space of this burning regime into three regions: the regime of incomplete silicon burning, alpha-rich freeze-out, and normal freeze-out from NSE (see Fig. 1). In NSE all the abundances from protons, neutrons, and α-particles up to the iron peak have reached an equilibrium (i.e., the forward and reverse reactions cancel each other). In addition to the peak temperature Tpeak and density ρpeak, the timescale on which a particular fluid element cools after the crossing of the burning front also determines the nucleosynthesis yields. Adiabatic cooling can be written as (Woosley et al. 1973)
 (1)
(1)
 (2)
(2)
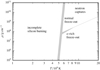 |
Fig. 1. Burning regimes in the T − ρ plane according to Woosley et al. (1973). Below a certain temperature the burning of silicon is incomplete. At high temperatures the state of nuclear statistical equilibrium is achieved and silicon is transformed into iron peak elements. This region is subdivided in the regime of normal freeze-out and α-rich freeze-out. The shaded area covers values of χ between 1 and 10 according to Eqs. (3) and (4). |
Here γ denotes the adiabatic exponent and  is the hydrodynamical timescale. With the help of the scaling parameter χ, the dependence of the results on the timescale can be examined.
Meakin et al. (2009) present an updated prescription for the density evolution in SNe Ia. They employ an exponential temperature decay and ensure adiabaticity by fixing the entropy to the post-burning state. The entropy S is a function of temperature, density, and averaged values of the mass number  and the proton number
  . Thus, the density can be obtained from
  . However, for demonstration purposes we stick to the formulation of Woosley et al. (1973) in the following since the main statements about freeze-out from NSE are not affected by the exact choice of the expansion prescription.
Incomplete silicon burning is characterized by the presence of two quasi-equilibrium clusters, i.e., only certain regions in the chart of nuclei that have reached equilibrium states, centered around 28Si and 56Ni, respectively. They are separated by the bottleneck at a mass number of A ≈ 45 (e.g., Ti and Sc). These elements are weakly bound compared to Ca and are therefore low in abundance. Hence, there is only little flow of material through the bottleneck and intermediate-mass elements (IMEs), and IGEs remain present after the burning is quenched. At higher temperatures the bottleneck is removed. The equilibrium clusters merge and matter achieves the state of NSE, ultimately converting silicon to IGEs almost completely. The temperature necessary for silicon exhaustion, X(28Si) ≲ 5 × 10⁻³, can be approximated by (Woosley et al. 1973)
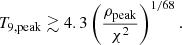 (3)
(3)
In NSE, the abundance distribution is uniquely determined by density, temperature, and electron fraction Ye. The composition changes as soon as the first reactions drop out of equilibrium due to decreasing temperature. At high densities matter is characterized by a low fraction of light and of free particles such as neutrons, protons, and α-particles. Therefore, the composition during this normal freeze-out or particle-poor freeze-out is not altered significantly by the capture of light particles during expansion. At lower densities, in contrast, light particles are more abundant and thus react with the prevailing iron group nuclei and bring matter out of NSE composition. Due to the high mass fraction of α-particles, this drop-out of equilibrium is called alpha-rich freeze-out. Woosley et al. (1973) derive the approximate relation
 (4)
(4)
for the density separating α-rich freeze-out and normal freeze-out using γ = 4/3 in Eqs. (1) and (2).
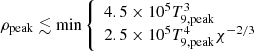
Therefore, the Tpeak − ρpeak-plane is split into three regions by Eqs. (3) and (4), as illustrated in Fig. 1 (see also Fig. 20 of Woosley et al. 1973). These regions produce different chemical compositions after the last reactions have frozen out. This is also visualized in Fig. 2 for the different explosion models explained in the next section. The separation of the different regions can be shifted continuously by a variation of the scaling parameter χ. The gray shaded areas in Figs. 1 and 2 cover values of χ between 1 and 10.
 |
Fig. 2. Distribution of the tracer particles in the Tpeak − ρpeak plane with color-coded mass fraction of 56Ni 100 s after triggering the explosion. The panels show (a) PD081, (b) PD115, (c) VM, (d) CSDD-S, (e) CSDD-L, (f) M2a⊙, (g) R60, (h) N100ddt. The gray shaded regions separate incomplete (left) from complete silicon burning (right) and normal freeze-out (upper right) from α-rich freeze-out (lower right) according to Eqs. (3) and (4). The area covered corresponds to a varying scaling parameter: 1 < χ < 10. |
2.2. Neutronization in high-density material
We discuss in the previous section how the NSE composition is altered in the two different freeze-out regimes, but the NSE composition itself is determined by the electron fraction Ye (related to the neutron excess η = 1 − 2Ye). In NSE, but also in quasi-statistical equilibrium (QSE), the most abundant nuclei after freeze-out are those with the highest binding energy and an electron fraction close to that of the initial fuel. For symmetric matter (i.e., Ye = 0.5) the most abundant nucleus is 56Ni. As Ye decreases, isotopes like 57 − 60Ni and 54 − 58Fe become more abundant depending on the actual electron fraction and their binding energies. The value of Ye is determined and altered by three mechanisms.
First, the electron fraction of the WD is set by the metallicity Z of the progenitor main sequence star. Most important are the abundances of 56Fe and CNO nuclei which are mostly converted to 14N in hydrogen burning (CNO cycle) and subsequently to 22Ne in helium burning. These two isotopes, 56Fe and 22Ne, provide the dominant part of the surplus of neutrons in the exploding WD. Timmes et al. (2003) derive an approximate relation for the mass of 56Ni as a function of metallicity. It shows a decreasing trend for 56Ni with increasing Z, and a variation of 25% if Z is varied by a factor of three.
Second, the initial Ye of the WD is altered during convective carbon burning (“simmering”) preceding the thermonuclear runaway in a MCh WD. The number of neutrons is increased via the capture of free electrons onto the highly ionized atoms (Bahcall 1964):
 (5)
(5)
These endoergic reactions require high electron energies, and therefore only become important at high densities. Chamulak et al. (2008) study the behavior of Ye during carbon burning and find that the reaction chain 12C(p, γ)13N(e−, ν)13C is the dominant mechanism for reducing Ye for densities of approximately 1 × 10⁹ g cm−3. The electron capture on 13N is gradually replaced by 12C(12C, p)23Na(e−, ν)23Ne for ρ > 1.7 × 10⁹ g cm−3. Chamulak et al. (2008) estimate a maximum reduction in Ye by 6.3 × 10⁻⁴, and Piro & Bildsten (2008) suggest a carbon-dependent value of |ΔYe, max| = 1.7 × 10−3 X(12C).
Finally, the most dramatic changes to the electron fraction happen during the explosion itself. In NSE, electrons are mostly captured by free protons at high temperatures. Subsequently, as the temperature drops, IGEs capture most of the electrons. This leads to a decrease in Ye to Ye ≈ 0.44 in the most extreme cases in the central regions of the exploding WD star. Therefore, the regions with the highest density do not contribute significantly to the production of 56Ni (Brachwitz et al. 2000), but to more neutron-rich IGEs. In general, the nucleosynthesis results then depend on the central density and the corresponding density gradient. Detailed studies of the nucleosynthesis in Chandrasekhar-mass models and the effect of neutronization have been carried out by Thielemann et al. (1986), Iwamoto et al. (1999), and, with updated electron capture rates (Langanke & Martinez-Pinedo 2000), by Brachwitz et al. (2000) and Bravo (2019). When 3D effects in deflagration models are taken into account the final abundance stratification are smoothed out compared to the theoretical prediction based on density, metallicity, and neutronization (Seitenzahl et al. 2013a).
In summary, the neutronization due to electron capture is an effect restricted to the high densities reached only in WDs close to MCh, and hence the abundances of very neutron-rich isotopes are a hint to the Chandrasekhar-mass scenario. The abundance ratio of nickel to iron, for instance, measured in late-time spectra of SNe Ia can be taken as a proxy for the quotient 58Ni/56Ni, and thus for neutronization. This is used by Flörs et al. (2020) to infer the contribution of sub-MCh progenitors to SNe Ia in relation to MCh progenitors.
2.3. Explosive helium burning
In addition to explosive silicon burning, the burning of helium is another source of nucleosynthesis products in the double-detonation scenario (see Sect. 1). Explosive helium burning was studied by Khokhlov (1984) and Khokhlov & Érgma (1985). They found that in general the burning is characterized by a competition between the triple-α reaction and α-captures on heavier nuclei. First, 12C is synthesized by the reaction 3α→12C, and subsequently heavier α-elements (16O, 20Ne, 24Mg, 28Si, 32S, 36Ar, 40Ca, 44Ti, ...) are produced. The timescale for the capture of an α-particle increases for higher mass numbers A due to the higher Coulomb barriers. These are penetrated more easily at higher particle energies, and the timescale is therefore temperature dependent. Consequently, the α-chain stops as soon as the timescale for the triple-α-reaction is shorter than for the next α-capture. However, above a certain density-dependent temperature of approximately 2 × 10⁹ K at ρ = 5 × 10⁶ g cm−3, 56Ni is always the most abundant isotope since it has the highest binding energy at Ye = 0.5 (see Sect. 2.1). These temperatures are usually surpassed in helium detonations, and therefore most of the material is converted to 56Ni. Nevertheless, there is a way to stop the α-chain before 56Ni is reached, even at high temperatures. If the initial fuel is polluted with carbon, oxygen, or nitrogen, for instance, the slow triple-α reaction is bypassed by α-capture on these seed nuclei. This leads to a very fast depletion of α-particles and the nucleosynthesis stops below A = 56 once the material runs out of α-particles (see also Woosley & Kasen 2011, Shen & Moore 2014; Gronow et al. 2020).
Beyond A = 56, the reverse reactions become increasingly important and start to balance the α-captures to some extent. Nevertheless, a high abundance of α-particles results in an enhanced production of elements beyond Ni, such as Cu and Zn, compared to their NSE abundance. The timescale to reach NSE is about 1 s at a temperature of 5 × 10⁹ K. However, conditions necessary for NSE are not achieved in most of the helium detonations, and thus nucleosynthesis exhibits interesting differences in the burning products of the CO core.
2.4. Models
In this work we investigate three distinct kinds of explosion models. The first class consists of pure detonations of sub-Chandrasekhar mass CO WDs. We closely examine the violent merger (VM) of a 0.9 M⊙ with a 1.1 M⊙ WD simulated by
Pakmor et al. (2012a). In addition, two pure detonations of CO WDs with total masses of the progenitor of 0.81 (PD081) and 1.15 M⊙ (PD115) of Sim et al. (2010) are included in our analysis.
We then study models including a detonation of a helium shell on top of a sub-MCh mass WD (also labeled “.Ia-SN”, Bildsten et al. 2007; Shen & Bildsten 2009; Shen et al. 2010) eventually triggering a second detonation burning the CO core (double detonation). Two models are taken from Sim et al. (2012) that follow the explosion of low-mass CO cores (0.58 and 0.45 M⊙) with a prominent helium shell of 0.21 M⊙ (hereafter CSDD-S and CSDD-L, respectively). The second detonation is triggered via the converging shock mechanism not far from the center of the WD (Fink et al. 2007). The HeD-S model follows the same setup as CSDD-S, but the detonation of the core is suppressed. These pure helium detonations are a possible explosion mechanism for Ca-rich transients (e.g., Inserra et al. 2015). Moreover, a double detonation in the core of a 1.05 M⊙ WD with a carbon-enriched helium shell of 0.073 M⊙ (Model M2a of Gronow et al. 2020) is included. In this case, a detonation in the core is triggered at its outer edge when the helium detonation front converges on the far side of its ignition. In addition, an equivalent model to M2a at solar metallicity M2a⊙ is investigated. This model is set up as a WD with a total mass of 1.06 M⊙. Its core consists of 12C, 16O, and, to reproduce the metallicity, 1.34% of 22Ne. In the 4He shell (Mshell = 0.075 M⊙) an admixture of 0.34% by mass of 14N accounts for solar metallicity in the hydrodynamical explosion simulation.
Finally, the MCh scenario is analyzed. We add the N5def model of Fink et al. (2014) as an example of a pure deflagration, the N100ddt delayed detonation identical with model N100 of Seitenzahl et al. (2013a), as well as a pure deflagration in a MCh WD with central density of 2.6 × 10⁹ g cm−3. The latter (R60) is ignited in a single spot 60 km off-center and, like N5def, does not disrupt the whole star but leaves behind a bound remnant. The model produces a very faint explosion ejecting only 0.018 M⊙ of 56Ni and 0.049 M⊙ of material in total. Moreover, the kinetic energy of the ejecta amounts to 8.17 × 1048 erg and an intact WD of 1.33 M⊙ is left behind after the explosion. This model has been calculated for this paper with methods similar to Fink et al. (2014) but with an updated equation of state (Timmes & Arnett 1999) and a gravity solver based on fast Fourier transforms.
More details concerning the individual setups and the employed codes can be found in the references above. Moreover, data for the models VM, CSDD-S, CSDD-L, HeD-S, N5def, N100ddt, and M2a have been made publicly available in the online model database HESMA (Kromer et al. 2017). It should be noted that all hydrodynamic explosion simulations were done using the LEAFS code (Reinecke et al. 1999, 2002; Röpke 2005) except for the double detonations M2a and M2a⊙, which were computed with AREPO (Springel 2010).
Because solving a large nuclear network in parallel with the actual explosion simulation goes beyond the scope of the current computational resources, the nucleosynthesis yields are calculated in a post-processing step. To this end, virtual tracer particles are placed into the exploding WD star and advected passively with the fluid flow recording their thermodynamic history. Subsequently, this data is used to determine the isotopic abundances produced by the explosion.
Because we partially work with models from HESMA but also add new explosion simulations, the postprocessing and the treatment of metallicity in it follows different approaches: Models CSDD-L, CSDD-S, HeD-S, PD081, and PD115 were post-processed at zero metallicity and VM, N100ddt, and N5def at solar metallicity using the methods described in Travaglio et al. (2004). In the latter models, solar metallicity was mimicked by including 2.5% of 22Ne to approximately adjust Ye to the solar value (see also Seitenzahl et al. 2013a). All other simulations, i.e., M2a, M2a⊙, and R60, use the YANN code (Pakmor et al. 2012b) for postprocessing. The metallicity of the material in M2a is assumed to be zero, while M2a⊙ and R60 apply solar metallicity. To this end, the abundances of all isotopes in the core material (carbon and oxygen) are set according to Asplund et al. (2009) except for elements lighter than fluorine. While H and He are ignored, all CNO isotopes are converted to 22Ne, thus accounting for their processing in H and He burning. In the shell material of M2a⊙ carbon and oxygen are instead converted to 14N. To check the effect of the different metallicity implementations we also post-processed R60 and M2a⊙ with the appropriate amounts of 22Ne in CO material and 14N in the helium shell, but no other isotopes present. These variants are labeled R60Ne and M2aNe. In all cases the 384 species network of Travaglio et al. (2004) is utilized. Reaction rates were taken from the REACLIB database (Rauscher & Thielemann 2000, updated 2009) and only for our most recent simulations (e.g., R60, M2a) the version of 2014 is applied.
3. Discussion of the nucleosynthesis yields
An instructive way to illustrate the burning regimes reached by a specific model is the distribution of the tracer particles in the Tpeak − ρpeak diagram shown in Fig. 1.
In the case of the sub-Chandrasekhar mass pure detonations (VM, PD081, PD115) the important characteristic from the nucleosynthesis point of view is the low central density (ρc ≲ 108 g cm−3) of the WD. Therefore, IGEs are produced in alpha-rich freeze-out and incomplete silicon burning only (see Fig. 2). While the higher-mass CO core (PD115) produces 56Ni also in NSE (α-rich freeze-out), the low-mass core model (PD081) synthesizes all of its 56Ni in incomplete silicon burning. In addition, the fuel in the VM model stays below densities of 8 × 10⁷ g cm−3, and therefore it burns to NSE in the α-rich freeze-out regime. In the merger process the structure of the primary is not much affected, but the disruption of the secondary causes the larger scatter in the thermodynamic properties of the tracer particles at lower densities (see Fig. 2).
In addition to this, the double-detonation models (CSDD-S, CSDD-L, M2a⊙) clearly show that 56Ni is also produced in the helium shell detonation. The tracer particles located in the shell cover an area in the parameter space shown in Fig. 2 that is slightly below that of the core detonation. The scatter in the MCh deflagration models is larger due to the turbulent motion of the flame and the pre-expansion of the WD during the burning phase. This is even more obvious in the delayed detonation model since some tracers might be affected first by the deflagration and subsequently by the detonation. We note that for the single-spot ignited Model R60 the WD is not disrupted completely, and hence Fig. 2 only shows ejected tracers. Because only such massive WDs reach high densities of ρ ≳ 109 g cm−3 and consequently their nucleosynthesis yields originate mainly from normal freeze-out, these kinds of explosions contribute to elements not synthesized in sub-MCh models.
The gross nucleosynthesis yields are summarized in Fig. 3, which displays the elemental ratio to iron compared to the solar ratio according to Asplund et al. (2009). Since the PD081 model does not burn to NSE, it synthesizes super-solar amounts of IMEs showing a strong odd-even effect. Furthermore, it exhibits a rather high Cr abundance and drops off steeply for higher mass IGEs. CSDD-S also produces super-solar abundances of some IMEs, such as Si, S, Ar, and Ca which is not surprising as it shares the characteristics of a low-mass CO core with the PD081 model. However, the helium shell detonation adds substantial amounts of light IGEs (Ti, V, Cr) as well as Cu and Zn to the mix. These elements are most abundant in HeD-S since they are primarily produced in the helium detonation. Moreover, it should be noted that HeD-S and CSDD-L yield super-solar amounts of Mn. The VM yields are rather inconspicuous for not showing any overproduction, but instead significant underproduction of Mn, Co, Cu, and Zn. Interestingly, the M2a⊙ simulation exhibits characteristics similar to those seen in pure detonations (a strong odd-even effect for IMEs, an underproduction of Co, a drop-off for Cu and Zn) as well as helium shell detonation features (super-solar values of Ti, V, Cr and solar abundance of Mn). Finally, the pure deflagration explosions R60 and W7 (we included the W7 model from Iwamoto et al. 1999 because it has been widely used in GCE calculations) and the delayed detonation N100ddt display low abundances of the light IGEs V and Cr and super-solar abundances of Mn and stable Ni. Moreover, the produced amounts of Cu and Zn are negligible, as is also the case for the pure detonations VM and PD081.
 |
Fig. 3. Elemental ratios to Fe (with radioacitve isotopes decayed to 2 × 10⁹ yr) compared to their solar ratios for three sub-MCh detonations (VM, PD081, PD115), three double detonations (M2a⊙, CSDD-S, CSDD-L), one helium detonation (HeD-S), two pure MCh deflagrations (R60, W7), and a delayed detonation (N100ddt). |
We summarize that all SNe Ia models included here underproduce Co compared to the solar value. Moreover, we confirm the known facts that MCh explosions can produce Mn at super-solar values and that they also overproduce stable Ni. These have been used to discriminate between MCh and sub-MCh explosions in nebular spectra (Flörs et al. 2020). The theoretical reason for this distinction is that stable Ni (58, 60Ni) is produced at higher densities due to the lower electron fraction (see Sect. 2.2). However, we also find the double-detonation models can overproduce Mn and Ni, which makes the nucleosynthetic distinction between MCh and sub-MCh explosions not as straightforward as expected. The lighter elements Ti, V, and Cr stem either from He detonations or from the incomplete silicon burning region in low-mass CO cores. The heaviest IGEs Cu and Zn are synthesized in He detonations only, and therefore test the double-detonation scenario: any observations and GCE calculations finding Cu or Zn to be produced by SNe Ia would hint to the occurrence of this explosion mechanism.
3.1. Manganese
The only stable isotope of Mn, 55Mn, is produced in CCSNe and in SNe Ia in incomplete silicon burning primarily via the channel 55Co→55Fe→55Mn. As already pointed out by Seitenzahl et al. (2013b), a super-solar production of Mn is required to explain the rise in [Mn/Fe] for [Fe/H] ≳ −1 to its solar value. Although the CCSN contribution to Mn is uncertain, all current models predict [Mn/Fe] ratios below the solar value. Therefore, MCh explosions must be added to the mix of SNe Ia. Only these WDs reach densities high enough for normal freeze-out, and thus offer an additional site of production to the regime of incomplete silicon burning. The production of 55Co is illustrated in Fig. 4 for the pure deflagration model R60, the violent merger model VM, and the double-detonation model M2a⊙. It clearly shows that 55Co is synthesized in normal freeze-out in the R60 model in contrast to VM and M2a⊙. Furthermore, it can be seen that Mn also originates from the He detonation in Model M2a⊙. Table 1 summarizes the Mn yields and also gives the fraction of the isotopes contributing to the final Mn abundance. It reveals that only MCh deflagrations (N5def, N100ddt, R60, R60Ne, W7), the double detonation CSDD-L, and the helium detonation HeD-S achieve super-solar [Mn/Fe] ratios. For model R60 the [Mn/Fe] values are somewhat lower compared to N100ddt and N5def due to the newer set of reaction rates employed in the postprocessing. While M2a⊙ roughly reaches the solar value of [Mn/Fe], the other double detonations (M2a, M2aNe and CSDD-S) exhibit a sub-solar production of [Mn/Fe].
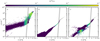 |
Fig. 4. Same as Fig. 2 with a color-coded mass fraction of 55Co. The panels show (a) R60, (b) VM, (c) M2a⊙. |
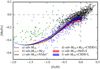 |
Fig. 5. Evolution of [Mn/Fe] for different SNe Ia scenarios. The sub-MCh scenario is represented by the Model VM, the MCh scenario by N100ddt, and N5def is used as a proxy for SNe Iax. The shaded areas in the runs sub-MCh+CSDD-L and sub-MCh+HeD-S correspond to a range in the rate of Ca-rich transients between 33% and 94%. Black dots show observational data of Adibekyan et al. (2012), blue diamonds the data of Reddy et al. (2006), yellow triangles the data of Gratton et al. (2003), and red squares the data of Ishigaki et al. (2012, 2013). The data is from the STELLar ABundances (STELLAB) library (Ritter & Côté 2016). The non-LTE data by Eitner et al. (2020) are not included in this simple approach. |
Mn-to-Fe ratio compared to solar for the total explosion at 100 s after ignition and to shell and core material only, the total amount of stable Mn in M⊙, and the radioactive and stable isotopes from which 55Mn originates (shown as percentages).
The value of [Mn/Fe] in the double-detonation models is governed by three fundamental parameters of the initial model:
(i) The ratio of shell to core mass (Mshell/Mcore) is a crucial factor. Most Mn is produced in the helium detonation which is reflected by the super-solar value of 0.29 for HeD-S (see Table 1). In contrast to that [Mn/Fe] is below solar in CSDD-S due to the sub-solar value of the core detonation. The WD in Model CSDD-L, however, has a very low core mass (0.45 M⊙) and a helium shell of 0.2 M⊙ (the same as CSDD-S), and therefore the contribution of the core detonation to [Mn/Fe] is less significant.
(ii) The density of the helium shell also affects [Mn/Fe]. 55Co is produced in a well-defined range of initial densities in the helium envelope above approximately 6 × 10⁵ g cm−3. The density at the base of the helium shell for the low-mass progenitors in CSDD-L (ρc = 5.92 × 10⁵ g cm−3) and for CSDD-S (ρc = 12 × 105 g cm−3) is sufficient to synthesize 55Co. Thus, the amount of Mn is quite similar in both models. However, the amount of Fe is much lower in CSDD-L due to the lower density in the envelope, and therefore the discrepancy between CSDD-L and CSDD-S in [Mn/Fe] mainly originates from the yields of the shell detonation. Model CSDD-L gives a value of 1.69 for [Mn/Fe] from the helium shell detonation compared to 0.29 in Model CSDD-S.
(iii) The progenitor metallicity plays an essential role for the production of Mn.
Following argument (i) from above, a very low value of [Mn/Fe] could be expected for Model M2a⊙ because of the low-mass helium shell and the ∼1 M⊙ core. The data, in contrast, show an approximately solar value. The reason is that it has been calculated at solar metallicity, which leads to [Mn/Fe]core = −0.07 (comparable to Model VM) for core material and [Mn/Fe]shell = 0.81 for the shell. Since the production of nuclei more neutron-rich than 56Ni is enhanced for lower Ye, this shift in [Mn/Fe] is reasonable. The yields of model M2aNe fall into line with this analysis. The [Mn/Fe] value in the core material slightly decreases, however, indicating a low dependence on the initial distribution of nuclei. Furthermore, Model M2a at zero metallicity from Gronow et al. (2020) gives [Mn/Fe]= − 1.00, which supports the explanations given above.
It is generally found that CO detonations at zero metallicity (also the core detonations of CSDD-L and CSDD-S) produce less Mn than models at higher metallicity (VM, M2a⊙, M2aNe). In addition, the pure detonation models (PD081, PD115) not only underproduce Mn with respect to Fe (like VM), but also eject a total amount of Mn roughly three orders of magnitude below all other explosions. Although we do not have solar counterparts of CSDD-L, CSDD-S, PD081, PD115 nor zero-metallicity versions of VM, the comparison between the individual CO detonations still indicates a metallicity-dependent Mn production.
In addition, some Mn is made via 55Fe directly only in the MCh models. In Fig. 4 we can observe that 55Co is not produced at the very tip of the high-density end of the tracer particle distribution in Model R60. These are exactly the conditions where the even more neutron rich element 55Fe is synthesized. In contrast to M2aNe, we do not observe any changes in the yields of R60Ne compared to R60. This is most likely because almost all of 55Co and 55Fe is synthesized in normal freeze-out from NSE. Thus, the products largely depend on the neutronization due to electron capture during the explosion phase (see Sec. 2.2) and only weakly on the initial metallicity.
It should be noted that explosions such as M2a do not resemble normal SNe Ia in some aspects (see also Fink et al. 2010; Gronow et al. 2020). A solution to this problem might be to further decrease the mass of the helium shell (Townsley et al. 2019), but this also reduces the production of Mn in its detonation. However, explosions such as HeD-S are candidates for Ca-rich transients, a sub-luminous class of SNe residing between normal SNe Ia and classical novae in terms of absolute magnitude. Frohmaier et al. (2018) estimate rather high rates for Ca-rich transients of about 33%–94% of the rate of normal SNe Ia. If this proves to be correct, such explosions may substantially contribute to the production of Mn in the Universe.
To estimate the effect of Ca-rich SNe on the evolution of [Mn/Fe] in the Milky Way we carried out a chemical evolution simulation using the code One-zone Model for the Evolution of GAlaxies (OMEGA; Côté et al. 2017). We calculate an open-box model and employ the Côté et al. (2017) star formation model to control the in- and outflows of gas. These are linked to the star formation rate M⋆ via a mass loading factor η. The total mass of gas inside the Galaxy is determined by the star formation efficiency f⋆: M⋆ = f⋆Mgas. The star formation rate is taken from Chiappini et al. (2001), yields for massive stars are from Limongi & Chieffi (2018) (we use averaged values of their different rotating and non-rotating models), and yields of AGB stars are extracted from Karakas (2010). We find reasonable agreement with observational data for Mn using different SN Ia scenarios (see below) and fixing the star formation efficiency to f⋆ = 0.006, the mass loading factor to η = 0.7, and the proportional constant connecting the star formation timescale and the dynamical timescale to fdyn = 0.004. Moreover, the mass transition between AGB yields and massive star yields is chosen to be 10.5 M⊙. Finally, the rate of SNe Ia is chosen to be  , and the total number of SNe Ia is distributed according to the chosen contribution of each channel (see cases below).
For the Chandrasekhar mass delayed detonations (N100ddt), helium-shell double-detonations (CSDD-L, HeD-S), and violent WD mergers (VM), we use delay time distributions calculated with the STARTRACK binary evolution code (e.g., Belczynski et al. 2008; Ruiter et al. 2009). For this work we assume Chandrasekhar mass exploding CO WDs that have a hydrogen-rich donor (in most cases a subgiant or giant star) that produces delayed-detonations. For violent WD mergers, we include any merger between two CO WDs that has at least one component WD mass ≥0.9 M⊙. For double-detonations with helium shells we employ the WD mass-dependent helium shell prescription of Ruiter et al. (2014).
We implemented the following combinations of SN Ia channels. Combinations (a), (b), and (c) have also been investigated by Seitenzahl et al. (2013b):
-
(a)
sub-MCh: 100% Model VM;
-
(b)
sub-MCh + MCh: 50% Model VM + 50% Model N100ddt;
-
(c)
sub-MCh + Iax: 80% Model VM + 20% N5def;
-
(d)
sub-MCh + MCh + CSDD-L: same as case (b) with 50% of CSDD-L added, which increases the number of SNe Ia per stellar mass formed to
 ;
; -
(e)
sub-MCh + HeD-S: the SN Ia rate consists of 100% of Model VM, and 33%-94% of Model HeD-S are included;
-
(f)
sub-MCh + CSDD-L: same as case (e) with Model CSDD-L instead of HeD-S.
Combinations (a), (b), and (c) confirm the results described above. The solar value of [Mn/Fe] can only be reached when including a significant fraction of MCh explosions. In addition, a rather high fraction of 20% of failed deflagrations (N5def) represented by case (c) is not sufficient to match the increasing trend. However, we note that the upward trend in [Mn/Fe] is not only due to the contribution of MCh-mass SNe Ia. CCSNe also exhibit an increasing trend in [Mn/Fe] with increasing metallicity. This is illustrated in scenario (a) where SNe Ia have virtually no contribution to Mn. However, despite the CCSN-caused increase in Mn, a solar ratio is not reached. Moreover, we find that helium detonations (HeD-S, CSDD-L) are as effective in increasing the final value of [Mn/Fe] as N5def with our choice of rates (see variations (e) and (f)). Furthermore, case (d) demonstrates that CSDD-L also raises [Mn/Fe] in the presence of N100ddt. This indicates that Ca-rich transients are able to reduce the need for MCh explosions to reproduce the evolution of [Mn/Fe]. We find that a reduction in MCh explosions to 30% of the SN Ia rate in scenario (d) yields [Mn/Fe] values similar to those in case (b). Replacing CSDD-L with HeD-S allows a reduction to 40%. Thus, the occurrence rate of MCh SNe Ia needed to explain why [Mn/Fe] versus [Fe/H] can be reduced but not eliminated by the consideration of helium detonation models.
We note that this simple approach cannot replace future more elaborate GCE studies. It is only intended to give an impression of the contribution of helium shell detonation models compared to other SNe Ia scenarios given their low ejected mass per event. The delay-time distribution for explosions such as CSDD-L and HeD-S is not very well constrained, for instance. Fortunately, this does not challenge our conclusion since different DTDs only alter the shape of the [Mn/Fe] evolution and leave the final value at [Fe/H] = 0 largely unaffected. While there is still much uncertainty associated with the evolution and explosive outcome of helium shell double-detonation binaries, we note that in our binary evolution models progenitors of double-detonation SN Ia explosions are more similar in physical configuration to the models of Gronow et al. (2020) (in terms of core and shell mass), rather than the earlier models computed by Sim et al. (2012). However, it turns out that regardless of whether low to moderate shell mass systems (Gronow) or high shell mass systems (Sim) are actually contributing to the SN Ia population, it will not have any noticeable effect on the delay-time distribution of these explosions since the timescale on which these WDs accumulate helium is insignificant by comparison (on the order of ∼10 Myr).
In addition, a large number of helium detonations would lead to tensions in [Ti/Fe] and [V/Fe] since these elements are produced in super-solar amounts in them (see Fig. 3). This is yet another argument excluding helium shell detonations or double detonations as a replacement for MCh SNe Ia models producing a solar [Mn/Fe] value. As Ti and V are, however, underproduced over the whole metallicity range in current GCE studies (see Prantzos et al. 2018 and references therein), their site of production is not yet completely clarified. The yields derived from helium detonation models do not solve the problem. They imply an increased production at [Fe/H] ≈ 0 and fail to provide a good fit to the [Ti/Fe] and [V/Fe] evolution at low metallicities. We find that a decrease in the CSDD-L rate to approximately 10% of the SN Ia rate resolves this tension and yields the solar value for [Ti/Fe] and [V/Fe] in scenario d). However, this only allows for a reduction in the MCh events to 45% compared to 30% mentioned above.
3.2. Zinc
The element zinc ranges right beyond the iron peak and is of high interest for GCE since its origin has not been clarified yet. It has four stable isotopes, namely 64Zn, 66Zn, 67Zn, and 68Zn, of which 64Zn is the most abundant in the solar neighborhood. The production mechanisms are therefore more diverse than in the case of Mn. Zinc abundances in the Galaxy have been measured already by Sneden et al. (1991) and later by Mishenina et al. (2002), Cayrel et al. (2004), and Nissen et al. (2007). All agree on its evolution: Zn exhibits high values of [Zn/Fe] ≈ 0.6 at [Fe/H] ≈ −4, which drop to solar at around [Fe/H] ≈ −2. From there on they remain at [Zn/Fe] ≈ 0. Some of the Zn abundance is synthesized during He or C burning via the s-process in massive stars, but the major contribution comes from explosive nucleosynthesis in supernovae. Standard CCSNe models (see, e.g., the yields of Woosley & Weaver 1995) fall short in the production of Zn. Only the introduction of hypernovae (HNe) can account for the solar value of [Zn/Fe] (Kobayashi et al. 2006), but the high values at very low metallicities are not reached within this model either.
The most commonly used SN Ia model for GCE calculations is the W7 model (Iwamoto et al. 1999): a 1D pure deflagration in a MCh CO WD. This particular simulation yields only negligible amounts of Zn (see Table 2). Therefore, it has been a goal to explain the evolution of Zn with other production sites, although 1D double-detonation and pure helium detonation models calculated by Woosley & Kasen (2011) show substantial amounts of Zn. The recent work by Hirai et al. (2018) tries to explain the evolution of Zn with metallicity-dependent yields of CCSNe as well as HNe from Nomoto et al. (2013). They find that the inclusion of electron capture supernovae (ECSNe, yields from Wanajo et al. 2018) is necessary to match the high [Zn/Fe] values at low metallicity. Jones et al. (2019a) presented nucleosynthesis yields of thermonuclear ECSNe (tECSNe), i.e., the explosion of oxygen-neon WDs at densities around 1010 g cm−3. These models overproduce neutron-rich isotopes such as 48Ca, 50Ti, and 54Cr, as well as 66Zn and other elements beyond the iron peak. In a follow-up study Jones et al. (2019b) showed that these models complement nicely the contribution of ECSNe to the chemical evolution of the Milky Way. Prantzos et al. (2018) cannot reproduce the evolution of Zn using the nucleosynthesis yields of rotating massive stars by Limongi & Chieffi (2018).
Total amount of stable Zn in M⊙ and the radioactive and stable isotopes from which Zn originates (shown as percentages) at 100 s.
In spite of this, a high contribution of SNe Ia to Zn was proposed by Matteucci et al. (1993) and later on by François et al. (2004). Mishenina et al. (2002) claim that SNe Ia are responsible for as much as 67% of the Zn production. Tsujimoto & Nishimura (2018) investigate the evolution of Zn in the Galaxy using Mg instead of Fe as the reference element. Magnesium is an α-element assumed to be solely produced in CCSNe, and thus it is more sensitive in detecting the contribution of sources other than CCSNe to a specific element. They discover a decreasing trend for [Zn/Mg] for [Zn/Mg] ≲ −1 and an increasing trend for higher metallicities. This increasing behavior coincides with the well-known kick-in of SNe Ia at [Fe/H] = −1. Consequently, they conclude that SNe Ia must be responsible for this behavior and suggest a scenario including a He detonation with strong α-rich freeze-out. The decreasing trend at low metallicities is explained in their GCE model by the incorporation of magnetorotational SNe (MR SNe), whose rate decreases with increasing metallicity.
No matter which combination of supernova scenarios accounts for the observed abundances at [Fe/H] ≲ −1, it is very likely that SNe Ia also contribute to Zn in a non-negligible way, i.e., a significant underproduction would require an even larger contribution from CCSNe to keep [Zn/Fe] near the solar value. The question is which scenario for SNe Ia synthesizes [Zn/Fe] at around the solar ratio or higher and therefore contributes to the enrichment of galaxies with Zn.
Table 2 lists the total production of Zn in solar masses as well as the fraction of isotopes via which it is produced. In addition, Table 3 shows [Zn/Fe] for the whole explosion and for the helium shell and core detonation separately in the case of a double detonation. It reveals that all models, except for those including a helium detonation (M2a⊙, M2a, CSDD-S, CSDD-L, and HeD-S), severely underproduce [Zn/Fe] compared to its solar value. While M2a⊙, M2aNe, M2a, and CSDD-L exhibit only a moderate underproduction, the remaining models synthesize super-solar ratios [Zn/Fe]. The [Zn/Fe] value of the helium detonation is quite similar in M2a⊙, CSDD-S, and HeD-S, but the result of the whole explosion is dominated by the core detonation for model M2a⊙. In contrast to the case of Mn, the values of [Zn/Fe] in M2a are higher than its solar metallicity counterpart. The most important production channel is via the symmetric nucleus 64Ge, as is also the case for CSDD-S and HeD-S. In Model CSDD-L the [Zn/Fe] yield of the helium shell detonation is significantly lower than in the other models. The reason for this is the lower density of the envelope (see argument (ii) in Sect. 3.1) because most Zn is produced above an initial density of 5.0 × 10⁵ g cm−3. The lower density is also responsible for the difference in the contribution of 64Ge compared to the other double detonations as it is produced at higher densities than 66Ge, for example.
Ratio of Zn to Fe compared to solar for the total explosion, to shell and core material only, and to stable zinc isotopes decayed at 2 × 10⁹ yr.
Furthermore, it can be seen that the main production channels are 64Ga→64Zn, 64Ge→64Ga→64Zn, and 66Ge→66Ga→66Zn for the majority of models except for PD081 and PD115. These isotopes are produced either in α-rich freeze-out from NSE or in the helium detonation (see Fig. 6).
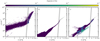 |
Fig. 6. Same as Fig. 2 with a color-coded mass fraction of the parent nuclei of Zn listed in Table 2. The panels show (a) R60, (b) VM, (c) M2a⊙. |
Figure 6 also shows that Zn is primarily produced in the helium shell at relatively high densities. This region is not reached by CSDD-L, as discussed above. A direct production of Zn in the form of a high contribution from 64Zn can only be observed in the pure detonations PD081 and PD115 and, to a much lesser extent, in the MCh models. However, the total amount of Zn falls short of that of Models CSDD-S, HeD-S, and M2a⊙ by about two orders of magnitude. R60 and M2a⊙ are the only models to directly produce a non-negligible amount of 66Zn. Moreover, the direct production of Zn isotopes (64, 66Zn) is clearly a metallicity effect. The corresponding simulations at lower metallicity shift the production of Zn to the symmetric isotope. This behavior is not observed for the other models at solar metallicity (N5def, N100ddt, VM). In contrast to our most recent simulations (M2a⊙ and R60, where the solar value for each isotope according to Asplund et al. 2009 is used as input for the postprocessing), the metallicity is set by adding only 22Ne to adjust the electron fraction. Therefore, the lack of seed nuclei in the investigated region might affect the detailed nucleosynthesis results. This is confirmed by models R60Ne and M2aNe. They do not produce any Zn isotopes and also show differences in the production of various other species.
In summary, any SN Ia scenario noticeably contributing to the enrichment of the Galaxy with Zn is required to include a prominent helium detonation. The production of Zn can be explained by the same three arguments used for the case of Mn. However, here CSDD-L shows the lowest ratio to iron since the initial shell density is too low to synthesize Zn in sufficient amounts. We abstain from adding an investigation of the galactic evolution of [Zn/Fe] since we have already shown for the case of Mn that low-mass double detonations and pure helium shell detonations do contribute significantly to [Mn/Fe] despite their low ejecta masses. This result holds analogously for [Zn/Fe].
Instead, we briefly estimate the influence of 68Ge on the light curve. All other isotopes listed in Table 2 are short-lived with a maximum half-life1 of 61.8 h for 67Cu. Although compared to 56Ni long-lived isotopes are not produced in large amounts, they can modify the shape of the light curve at late times (Seitenzahl et al. 2009). Furthermore, γ rays or X-rays emitted in their decay might be detectable.
68Ge decays to 68Ga via electron capture with a half-life of T1/2 = 270.95 d. The two most relevant X-rays emitted have energies of E1 = 9.225 and E2 = 9.252 keV with an emission probability of I1 = 0.131 and I2 = 0.258, respectively. As an example, we consider Model M2a⊙, which ejects 3.554 × 10⁻⁶ M⊙ of 68Ge. Assuming transparent ejecta after t = 100 d and a very close SN explosion at a distance of d = 1 Mpc, we arrive at a flux on Earth of
 (6)
(6)
where λ is the decay constant and N0 the number of nuclei at t = 0, which can be derived dividing the ejected mass by the corresponding atomic mass2. The X-ray telescope NuSTAR (Harrison et al. 2013) has a sensitivity of 2 × 10⁻¹⁵ erg s−1 cm−2 in the considered energy range. Therefore, the added flux of the two X-ray emissions is about a factor of 35 below the detection limit, and thus a higher production of 68Ge would be necessary for a potential detection even under the rather favorable conditions assumed here. We note that this statement is by no means conclusive since the sensitivity of NuSTAR also depends on the line shape and on the observation time.
Subsequently, 68Ga decays to 68Zn via positron emission very quickly (T1/2 = 67.71 min). Assuming an instantaneous energy deposition, we calculated the contributions of 68Ga, 44Sc, 56Co, 57Co, and 55Fe positrons, conversion electrons, and Auger electrons to the SN light curve for Models HeD-S (same amount of 68Ge as CSDD-S), CSDD-L, and M2a⊙. In the cases of 68Ga and 44Sc the electrons emitted by their long-lived parents are included as well. Figure 7 shows that with less than 0.4% of the energy generation per second ϵ, the 68Ga decay plays only a minor role in model M2a⊙. Its contribution is even lower in the HeD-S and CSDD-L models.
 |
Fig. 7. Energy generation rate ϵ of the emission of positrons, conversion electrons, and Auger electrons in model M2a⊙. Shaded areas show the range between no X-ray trapping and full X-ray trapping. The black curve depicts the contribution of the 68Ga decay relative to the total energy generation. |
 |
Fig. 8. Same as Fig. 2, with a color-coded mass fraction of 64Ge. The panels show (a) R60, (b) VM, (c) M2a⊙. |
3.3. Copper
Copper directly follows nickel in the periodic table and its elemental solar abundance consists of two stable isotopes, namely 63Cu and 65Cu. Of these, about 69% are attributed to 63Cu (Asplund et al. 2009). The first extensive measurements and an analysis of Cu abundances have been carried out by Sneden et al. (1991). The general trend of an increasing value of [Cu/Fe] with [Fe/H] in the Galaxy was established in that work. [Cu/Fe] increases from a value of approximately −1 at [Fe/H] ≈ −3 to the solar value at [Fe/H] ≈ 0.
As for Zn, the origin of Cu is still very uncertain. The largest contributors are believed to be the weak component of the s-process in massive stars (a secondary process) and the direct fusion as a primary element simultaneous to IGEs in CCSNe and SNe Ia. Matteucci et al. (1993) carried out detailed GCE calculations. Comparing their data to the Sneden et al. (1991) data, they conclude that a best fit is achieved if the SNe Ia yields for Cu are increased by an order of magnitude. Moreover, they claim that SNe Ia start contributing to the enrichment of the Galaxy starting from [Fe/H] ≈ −1.7 (i.e., already in the halo phase). Mishenina et al. (2002) provide a large upgrade to the Cu abundance data by measuring Cu and Zn in 90 metal-poor stars in the Galaxy. They arrive at the conclusion that the increase in [Cu/Fe] is due to a significant contribution of SNe Ia. As a guideline they also provide a very rough estimate of the relative contributions of Cu from different production sites to the solar abundance. They assign 7.5% to SNe II (primary process in massive stars), 25% to secondary processes in massive stars, 5% to the s-process in AGB stars, and 62.5% to SNe Ia. The overall trend of the Cu-to-Fe ratio, i.e., a sub-solar plateau at low metallicities and an increase to the solar value, which is reached at [Fe/H] ≈ −0.8, has also been confirmed by Reddy et al. (2003). In contrast, Prantzos et al. (2018) show that by including the yields of Limongi & Chieffi (2018) the evolution of [Cu/Fe] can be modeled with CCSNe alone (they use W7 for SNe Ia). Nissen & Schuster (2011) also confirm sub-solar [Cu/Fe] values for their low-α population of dwarf stars in the solar neighborhood. These stars are thought to be primarily enriched by SNe Ia, and therefore they conclude that they are not main contributors to Cu. Simmerer et al. (2003) investigate the Cu abundances in various globular clusters and draw the opposite conclusion, that SNe Ia are likely to be the main contributors to Cu, because [Cu/Fe] in globular clusters follows the trend seen in field stars. However, the only cluster spanning a significant range in metallicity (−1.8 < [Fe/H] < 0.8) is ω-Centauri and there the [Cu/Fe] curve is rather flat. This suggests a different chemical evolution history. In contrast to the previously mentioned results, Romano & Matteucci (2007) find that their GCE model can fit both the Galaxy and ω-Centauri if the s-process yields are enhanced and the SN Ia yields are reduced. Cunha et al. (2002) investigate in more detail the evolution of ω-Centauri. They attribute the strong enhancement of α-elements relative to Fe and the constant evolution of [Cu/Fe] at a rather low value of −0.5 to an enrichment via CCSNe. However, a final explanation for the lack of SNe Ia enrichment is not given. Recent non-LTE Cu abundance measurements are presented by Yan et al. (2015, 2016). They show that non-LTE effects raise the previously measured values by about 0.2 dex and that this difference is also metallicity dependent. The impact of the non-LTE treatment is higher for lower [Fe/H], and therefore flattens the whole curve. Furthermore, the plateau at lower metallicities is extended compared to older works, and reaches up to [Fe/H] ≈ −1 and then rises to solar. However, Yan et al. (2015) note that due to the uncertainties in the main production site of Cu and to the peculiar evolution of Cu in Ursa Major, ω-Centauri, the Sagittarius dwarf galaxy, and the halo subpopulation (Nissen & Schuster 2011), further GCE models should be postponed until the trend of [Cu/Fe] is clearly established by using non-LTE measurements.
Similar to the discussion on Zn (see Sect. 3.2), it is now interesting to see which SN Ia scenario is able to synthesize Cu in significant amounts. Table 4 displays the Cu yields together with the relative contribution of the most important production channels. In Table 5 the [Cu/Fe] values and the remaining stable Cu isotopes can be found.
Total amount of stable Cu in M⊙ and the radioactive and stable isotopes from which Cu originates (shown as percentages) at 100 s.
Ratio of Cu to Fe compared to solar for the total explosion, and for shell and core material only and stable copper isotopes decayed at 2 × 10⁹ yr.
The overall result is the same as for the Zn case: Cu is largely underproduced compared to solar in all simulations except for two models including a He detonation, in this case HeD-S and CSDD-S. However, [Cu/Fe] values are lower than [Zn/Fe] for the helium shell, which also diminishes the total [Cu/Fe] yields. M2a⊙, M2aNe, and M2a even approach the pure detonation PD115 due to the low ratio of shell mass to core mass (argument (i) in Sect. 3.1). A comparison between M2a⊙ and M2a shows that the metallicity has little impact on the total value of [Cu/Fe]. It only slightly changes the fractions of the parent nuclei that decay to stable Cu. In particular, we find that the direct production of 63Cu and 65Cu is favored for higher metallicity and that the inclusion of only 22Ne leads to a decrease in [Cu/Fe] (see R60Ne, M2aNe). Moreover, the difference in [Cu/Fe] from the helium shell between CSDD-L and the other double detonations is less significant than for [Zn/Fe]. 63Ga, for example, is mainly produced at an initial density higher than the density at the base of the shell in CSDD-L, and therefore the relative contribution to stable Cu is shifted to 65Ga and 65Ge compared to Models CSDD-S and HeD-S.
In contrast to Zn, a main production channel for Cu cannot be identified. While most models, except R60, produce some Cu via 63Zn, the helium detonations additionally show a major contribution from 63Ga, 65Ga, and 65Ge. The MCh simulations and PD115 also synthesize considerable amounts of 63Cu, and M2a⊙ exhibits contributions from almost every parent isotope listed in Table 4. This suggests that neither the core nor the helium detonation dominates the total Cu yields.
To sum up, the creation of a large amount of Cu in relation to Fe requires an even more prominent helium detonation than in the case of Zn. We find in addition that a density at the base of the helium envelope exceeding that in Model CSDD-L of 5.92 × 10⁵ g cm−3 is essential. From a GCE point of view the contribution of helium detonations to Cu is less significant than in the case of Mn or Zn among the investigated models. The only model expected to contribute considerably to [Cu/Fe] is HeD-S. Also in this case we postpone detailed GCE modeling to future work.
Similar to the discussion of long-lived radioactive isotopes in Sect. 3.2 we take a brief look at 65Zn. The only other long-lived isotope in Table 4 is 63Ni. However, it is only produced in very small amounts in model R60, and its half-life of 101.2 y implies a very low rate of decay. 65Zn, in contrast, has a half-life of T1/2 = 243.93 d and emits an energetic γ ray with an energy of E = 1115.539 keV and an emission probability of I = 0.5004. Most 65Zn is synthesized via the fast decaying isotopes 65Ge and 65Ga (see Table 2). Under the same assumptions as in Sect. 3.2, we arrive at a flux on Earth for Model CSDD-S (highest amount of 65Zn among our models with 3.019 × 10⁻⁵ M⊙) of
 (7)
(7)
Although this value is four orders magnitude higher than for the 68Ge X-rays (see Sect. 3.2), it is still at least an order of magnitude below the expected sensitivity of the planned γ-ray telescope e-ASTROGAM (De Angelis et al. 2018), and therefore a detection is very unlikely.
4. Summary
We investigated the nucleosynthesis yields of a variety of SN Ia models from the HESMA (Kromer et al. 2017) archive as well as two new explosion simulations, M2a⊙ and R60. These models include double-detonation models from Sim et al. (2012) and Gronow et al. (2020). Furthermore, we examined the pure detonations in sub-MCh WDs of Sim et al. (2010) and a set of MCh explosions from Seitenzahl et al. (2013a) and Fink et al. (2014).
Our aim was to identify elements characteristic of a certain explosion mechanism. In combination with GCE calculations and abundance measurements in stellar atmospheres, this can help to identify SN Ia progenitors. A well-known example is the element manganese. Its abundance relative to iron increases from [Fe/H] ≈ − 1 and it is not produced by CCSNe in sufficiently high ratios relative to Fe. Therefore, it is attributed to thermonuclear explosions of MCh WDs (Seitenzahl et al. 2013b). In this study we find that super-solar amounts of Mn are additionally synthesized in helium detonations and that the actual result depends on the interplay of three parameters: the metallicity, the helium shell mass compared to the CO core, and the density of the helium envelope. A variation in these values gives rise to sub-solar values of [Mn/Fe] (as seen in Models M2a and CSDD-S) up to highly super-solar results (CSDD-L). This also brings the double-detonation scenario into play as a potential source of Mn. Therefore, the sole distinction between sub-MCh and MCh mass models when investigating the source of Mn is insufficient. The details of the underlying model employed for the sub-MCh channel have to be defined in addition. Our GCE calculation corroborates this result and demonstrates that double-detonation models with massive helium shells can significantly reduce but not completely remove the need for MCh explosions to explain the solar [Mn/Fe] ratio. Their actual rate is limited, however, due to their super-solar [Ti/Fe] and [V/Fe] values.
Moreover, the elements zinc and copper have received little attention when studying the contribution of SNe Ia to galactic chemical evolution, although Matteucci et al. (1993) already pointed out the potential relevance of these events as a production site. We find that double-detonation models are able to produce Zn and Cu in super-solar ratios with respect to Fe. Since a sophisticated GCE modeling and a comprehensive analysis of the contribution of massive stars is beyond the scope of this work, we did not include models for the evolution of [Zn/Fe] and [Cu/Fe]. However, the general results from the case of Mn carry over to Zn and Cu. The same three parameters as in the case of Mn also affect the creation of Zn and Cu. Essentially, any value of [Mn/Fe], [Zn/Fe], or [Cu/Fe] can be realized using different combinations of helium shell mass, core mass, shell density and metallicity. However, in this study we find that the models from Sim et al. (2012) affect the evolution of Mn, Zn and Cu the most. These models follow explosions in a system of a low-mass CO cores covered by a massive helium shell. They were intended to resemble a subluminous subclass of SNe Ia, namely calcium-rich transients, but do not account for normal SNe Ia. Their significance for GCE therefore depends on the realization frequency of Ca-rich transients, which is currently subject to large uncertainties. Ongoing and planned transient searches hold promise to clarify this aspect.
We thus emphasize that SNe Ia, or, in general thermonuclear explosions, should be treated more carefully in GCE studies. It seems necessary to include a variety of thermonuclear explosion models rather than sticking to only one or two scenarios. SNe Ia should be considered as a source of Zn and Cu in GCE simulations if the double-detonation scenario is used to represent either normal SNe Ia (see, however, Kromer et al. 2010, for potential problems with the predicted spectral observables) or the faint class of calcium-rich transients. MCh explosions might not be the only relevant source of Mn.
All nuclear decay data is taken from https://www.nndc.bnl.gov/nudat2/
The atomic mass is taken from https://www-nds.iaea.org/
Acknowledgments
This work was supported by the Deutsche Forschungsgemeinschaft (DFG, German Research Foundation) – Project-ID 138713538 – SFB 881 (“The Milky Way System”, subproject A10), by the ChETEC COST Action (CA16117), and by the National Science Foundation under Grant No. OISE-1927130 (IReNA). F. L., F. K. R. and S. G. acknowledge support by the Klaus Tschira Foundation. IRS was supported by the Australian Research Council through Grant FT160100028. A. J. R. was supported by the Australian Research Council through Grant FT170100243. NumPy and SciPy (Oliphant 2007), IPython (Pérez & Granger 2007), and Matplotlib (Hunter 2007) were used for data processing and plotting. The authors gratefully acknowledge the Gauss Centre for Supercomputing e.V. (www.gauss-centre.eu) for funding this project by providing computing time on the GCS Supercomputer JUWELS (Jülich Supercomputing Centre 2019) at Jülich Supercomputing Centre (JSC). Part of this research was undertaken with the assistance of resources and services from the National Computational Infrastructure (NCI), which is supported by the Australian Government, through the National Computational Merit Allocation Scheme and the UNSW HPC Resource Allocation Scheme. BC acknowledges support from the ERC Consolidator Grant (Hungary) funding scheme (project RADIOSTAR, G.A. n. 724560) and from the National Science Foundation (USA) under Grant No. PHY-1430152 (JINA Center for the Evolution of the Elements).
References
- Adibekyan, V. Z., Sousa, S., Santos, N., et al. 2012, A&A, 545, A32 [NASA ADS] [CrossRef] [EDP Sciences] [Google Scholar]
- Asplund, M., Grevesse, N., Sauval, A. J., & Scott, P. 2009, ARA&A, 47, 481 [NASA ADS] [CrossRef] [Google Scholar]
- Bahcall, J. N. 1964, ApJ, 139, 318 [CrossRef] [Google Scholar]
- Belczynski, K., Kalogera, V., Rasio, F. A., et al. 2008, ApJS, 174, 223 [NASA ADS] [CrossRef] [Google Scholar]
- Bildsten, L., Shen, K. J., Weinberg, N. N., & Nelemans, G. 2007, ApJ, 662, L95 [NASA ADS] [CrossRef] [Google Scholar]
- Blinnikov, S. I., Röpke, F. K., Sorokina, E. I., et al. 2006, A&A, 453, 229 [NASA ADS] [CrossRef] [EDP Sciences] [Google Scholar]
- Blondin, S., Kasen, D., Röpke, F. K., Kirshner, R. P., & Mandel, K. S. 2011, MNRAS, 417, 1280 [NASA ADS] [CrossRef] [Google Scholar]
- Brachwitz, F., Dean, D. J., Hix, W. R., et al. 2000, ApJ, 536, 934 [NASA ADS] [CrossRef] [Google Scholar]
- Bravo, E. 2019, A&A, 624, A139 [CrossRef] [EDP Sciences] [Google Scholar]
- Cayrel, R., Depagne, E., Spite, M., et al. 2004, A&A, 416, 1117 [NASA ADS] [CrossRef] [EDP Sciences] [Google Scholar]
- Cescutti, G., & Kobayashi, C. 2017, A&A, 607, A23 [NASA ADS] [CrossRef] [EDP Sciences] [Google Scholar]
- Cescutti, G., Matteucci, F., Lanfranchi, G. A., & McWilliam, A. 2008, A&A, 491, 401 [NASA ADS] [CrossRef] [EDP Sciences] [Google Scholar]
- Chamulak, D. A., Brown, E. F., Timmes, F. X., & Dupczak, K. 2008, ApJ, 677, 160 [NASA ADS] [CrossRef] [Google Scholar]
- Chiappini, C., Matteucci, F., & Romano, D. 2001, ApJ, 554, 1044 [NASA ADS] [CrossRef] [Google Scholar]
- Côté, B., O’Shea, B. W., Ritter, C., Herwig, F., & Venn, K. A. 2017, ApJ, 835, 128 [NASA ADS] [CrossRef] [Google Scholar]
- Cunha, K., Smith, V. V., Suntzeff, N. B., et al. 2002, ApJ, 124, 379 [Google Scholar]
- De Angelis, A., Tatischeff, V., Grenier, I. A., et al. 2018, J. High Energy Astrophys., 19, 1 [NASA ADS] [CrossRef] [Google Scholar]
- de los Reyes, M. A., Kirby, E. N., Seitenzahl, I. R., & Shen, K. J. 2020, ApJ, 891, 85 [CrossRef] [Google Scholar]
- Eitner, P., Bergemann, M., Hansen, C. J., et al. 2020, A&A, 635, A38 [CrossRef] [EDP Sciences] [Google Scholar]
- Fink, M., Hillebrandt, W., & Röpke, F. K. 2007, A&A, 476, 1133 [NASA ADS] [CrossRef] [EDP Sciences] [Google Scholar]
- Fink, M., Röpke, F. K., Hillebrandt, W., et al. 2010, A&A, 514, A53 [NASA ADS] [CrossRef] [EDP Sciences] [Google Scholar]
- Fink, M., Kromer, M., Seitenzahl, I. R., et al. 2014, MNRAS, 438, 1762 [NASA ADS] [CrossRef] [Google Scholar]
- Flörs, A., Spyromilio, J., Taubenberger, S., et al. 2020, MNRAS, 491, 2902 [NASA ADS] [Google Scholar]
- François, P., Matteucci, F., Cayrel, R., et al. 2004, A&A, 421, 613 [NASA ADS] [CrossRef] [EDP Sciences] [Google Scholar]
- Frohmaier, C., Sullivan, M., Maguire, K., & Nugent, P. 2018, ApJ, 858, 50 [NASA ADS] [CrossRef] [Google Scholar]
- Gratton, R. G., Carretta, E., Claudi, R., Lucatello, S., & Barbieri, M. 2003, A&A, 404, 187 [NASA ADS] [CrossRef] [EDP Sciences] [Google Scholar]
- Greggio, L., & Renzini, A. 1983, A&A, 118, 217 [NASA ADS] [Google Scholar]
- Gronow, S., Collins, C., Ohlmann, S. T., et al. 2020, A&A, 635, A169 [CrossRef] [EDP Sciences] [Google Scholar]
- Harrison, F. A., Craig, W. W., Christensen, F. E., et al. 2013, ApJ, 770, 103 [NASA ADS] [CrossRef] [Google Scholar]
- Hillebrandt, W., & Niemeyer, J. C. 2000, ARA&A, 38, 191 [NASA ADS] [CrossRef] [Google Scholar]
- Hillebrandt, W., Kromer, M., Röpke, F. K., & Ruiter, A. J. 2013, Front. Phys., 8, 116 [Google Scholar]
- Hirai, Y., Saitoh, T. R., Ishimaru, Y., & Wanajo, S. 2018, ApJ, 855, 63 [NASA ADS] [CrossRef] [Google Scholar]
- Hoyle, F., & Fowler, W. A. 1960, ApJ, 132, 565 [NASA ADS] [CrossRef] [EDP Sciences] [Google Scholar]
- Hunter, J. D. 2007, Comput. Sci. Eng., 9, 90 [NASA ADS] [CrossRef] [Google Scholar]
- Iben, I., Jr, & Tutukov, A. V. 1984, ApJS, 54, 335 [NASA ADS] [CrossRef] [Google Scholar]
- Inserra, C., Sim, S. A., Wyrzykowski, L., et al. 2015, ApJ, 799, L2 [NASA ADS] [CrossRef] [Google Scholar]
- Ishigaki, M. N., Chiba, M., & Aoki, W. 2012, ApJ, 753, 64 [NASA ADS] [CrossRef] [Google Scholar]
- Ishigaki, M. N., Aoki, W., & Chiba, M. 2013, ApJ, 771, 67 [NASA ADS] [CrossRef] [Google Scholar]
- Iwamoto, K., Brachwitz, F., Nomoto, K., et al. 1999, ApJS, 125, 439 [NASA ADS] [CrossRef] [MathSciNet] [Google Scholar]
- Jones, S., Côté, B., Röpke, F. K., & Wanajo, S. 2019a, ApJ, 882, 170 [CrossRef] [Google Scholar]
- Jones, S., Röpke, F., Fryer, C., et al. 2019b, A&A, 622, A74 [NASA ADS] [CrossRef] [EDP Sciences] [Google Scholar]
- Jülich Supercomputing Centre 2019, J. Large-scale Res. Facil., 5, [Google Scholar]
- Karakas, A. I. 2010, MNRAS, 403, 1413 [NASA ADS] [CrossRef] [Google Scholar]
- Kasen, D., & Plewa, T. 2007, ApJ, 662, 459 [NASA ADS] [CrossRef] [Google Scholar]
- Kashi, A., & Soker, N. 2011, MNRAS, 417, 1466 [NASA ADS] [CrossRef] [Google Scholar]
- Khokhlov, A. M. 1984, Sov. Astron. Lett., 10, 123 [NASA ADS] [Google Scholar]
- Khokhlov, A. M., & Érgma, É. V. 1985, Astrofizika, 23, 605 [Google Scholar]
- Kobayashi, C., & Nomoto, K. 2009, ApJ, 707, 1466 [NASA ADS] [CrossRef] [Google Scholar]
- Kobayashi, C., Umeda, H., Nomoto, K., Tominaga, N., & Ohkubo, T. 2006, ApJ, 653, 1145 [NASA ADS] [CrossRef] [Google Scholar]
- Kobayashi, C., Karakas, A. I., & Umeda, H. 2011, MNRAS, 414, 3231 [NASA ADS] [CrossRef] [Google Scholar]
- Kobayashi, C., Nomoto, K., & Hachisu, I. 2015, ApJ, 804, L24 [NASA ADS] [CrossRef] [Google Scholar]
- Kobayashi, C., Leung, S.-C., & Nomoto, K. 2020, ApJ, 895, 138 [CrossRef] [Google Scholar]
- Kromer, M., Sim, S. A., Fink, M., et al. 2010, ApJ, 719, 1067 [NASA ADS] [CrossRef] [Google Scholar]
- Kromer, M., Pakmor, R., Taubenberger, S., et al. 2013, ApJ, 778, L18 [NASA ADS] [CrossRef] [Google Scholar]
- Kromer, M., Ohlmann, S. T., Pakmor, R., et al. 2015, MNRAS, 450, 3045 [NASA ADS] [CrossRef] [Google Scholar]
- Kromer, M., Ohlmann, S., & Röpke, F. K. 2017, Mem. Soc. Astron. It., 88, 312 [NASA ADS] [Google Scholar]
- Langanke, K., & Martinez-Pinedo, G. 2000, Nucl. Phys. A, 673, 481 [NASA ADS] [CrossRef] [Google Scholar]
- Limongi, M., & Chieffi, A. 2018, ApJS, 237, 13 [NASA ADS] [CrossRef] [Google Scholar]
- Marquardt, K. S., Sim, S. A., Ruiter, A. J., et al. 2015, A&A, 580, A118 [NASA ADS] [CrossRef] [EDP Sciences] [Google Scholar]
- Matteucci, F., & Greggio, L. 1986, A&A, 154, 279 [NASA ADS] [Google Scholar]
- Matteucci, F., & Recchi, S. 2001, ApJ, 558, 351 [NASA ADS] [CrossRef] [Google Scholar]
- Matteucci, F., Raiteri, C., Busson, M., Gallino, R., & Gratton, R. 1993, A&A, 272, 421 [Google Scholar]
- Matteucci, F., Panagia, N., Pipino, A., et al. 2006, MNRAS, 372, 265 [NASA ADS] [CrossRef] [Google Scholar]
- McWilliam, A. 1997, ARA&A, 35, 503 [NASA ADS] [CrossRef] [Google Scholar]
- McWilliam, A., Piro, A. L., Badenes, C., & Bravo, E. 2018, ApJ, 857, 97 [NASA ADS] [CrossRef] [Google Scholar]
- Meakin, C. A., Seitenzahl, I., Townsley, D., et al. 2009, ApJ, 693, 1188 [NASA ADS] [CrossRef] [Google Scholar]
- Mishenina, T., Kovtyukh, V., Soubiran, C., Travaglio, C., & Busso, M. 2002, A&A, 396, 189 [NASA ADS] [CrossRef] [EDP Sciences] [Google Scholar]
- Nissen, P. E., & Schuster, W. J. 2011, A&A, 530, A15 [NASA ADS] [CrossRef] [EDP Sciences] [Google Scholar]
- Nissen, P. E., Akerman, C., Asplund, M., et al. 2007, A&A, 469, 319 [NASA ADS] [CrossRef] [EDP Sciences] [Google Scholar]
- Nomoto, K., Kobayashi, C., & Tominaga, N. 2013, ARA&A, 51, 457 [NASA ADS] [CrossRef] [Google Scholar]
- North, P., Cescutti, G., Jablonka, P., et al. 2012, A&A, 541, A45 [NASA ADS] [CrossRef] [EDP Sciences] [Google Scholar]
- Oliphant, T. E. 2007, Comput. Sci. Eng., 9, 10 [CrossRef] [PubMed] [Google Scholar]
- Pakmor, R., Edelmann, P., Röpke, F. K., & Hillebrandt, W. 2012a, MNRAS, 424, 2222 [NASA ADS] [CrossRef] [Google Scholar]
- Pakmor, R., Kromer, M., Taubenberger, S., et al. 2012b, ApJ, 747, L10 [Google Scholar]
- Pérez, F., & Granger, B. E. 2007, Comput. Sci. Eng., 9, 21 [Google Scholar]
- Perlmutter, S., Aldering, G., Goldhaber, G., et al. 1999, ApJ, 517, 565 [NASA ADS] [CrossRef] [Google Scholar]
- Phillips, M. M. 1993, ApJ, 413, L105 [NASA ADS] [CrossRef] [Google Scholar]
- Piro, A. L., & Bildsten, L. 2008, ApJ, 673, 1009 [NASA ADS] [CrossRef] [Google Scholar]
- Prantzos, N., Abia, C., Limongi, M., Chieffi, A., & Cristallo, S. 2018, MNRAS, 476, 3432 [NASA ADS] [CrossRef] [Google Scholar]
- Rauscher, T., & Thielemann, F.-K. 2000, At. Data Nucl. Data Tables, 75, 1 [NASA ADS] [CrossRef] [Google Scholar]
- Reddy, B. E., Tomkin, J., Lambert, D. L., & Allende Prieto, C. 2003, MNRAS, 340, 304 [NASA ADS] [CrossRef] [Google Scholar]
- Reddy, B. E., Lambert, D. L., & Prieto, C. A. 2006, MNRAS, 367, 1329 [NASA ADS] [CrossRef] [Google Scholar]
- Reinecke, M., Hillebrandt, W., & Niemeyer, J. C. 1999, A&A, 347, 739 [NASA ADS] [Google Scholar]
- Reinecke, M., Hillebrandt, W., & Niemeyer, J. C. 2002, A&A, 386, 936 [NASA ADS] [CrossRef] [EDP Sciences] [Google Scholar]
- Riess, A. G., Filippenko, A. V., Challis, P., et al. 1998, AJ, 116, 1009 [NASA ADS] [CrossRef] [Google Scholar]
- Ritter, C., & Côté, B. 2016, NuPyCEE: NuGrid Python Chemical Evolution Environment (Astrophysics Source Code Library) [Google Scholar]
- Romano, D., & Matteucci, F. 2007, MNRAS, 378, L59 [NASA ADS] [Google Scholar]
- Röpke, F. K. 2005, A&A, 432, 969 [NASA ADS] [CrossRef] [EDP Sciences] [Google Scholar]
- Röpke, F. K. 2017, in Handbook of Supernovae, eds. A. Alsabti, & P. Murdin (Springer) [Google Scholar]
- Röpke, F. K., Kromer, M., Seitenzahl, I. R., et al. 2012, ApJ, 750, L19 [NASA ADS] [CrossRef] [Google Scholar]
- Ruiter, A. J., Belczynski, K., & Fryer, C. 2009, ApJ, 699, 2026 [NASA ADS] [CrossRef] [Google Scholar]
- Ruiter, A. J., Belczynski, K., Sim, S. A., Seitenzahl, I. R., & Kwiatkowski, D. 2014, MNRAS, 440, L101 [NASA ADS] [CrossRef] [Google Scholar]
- Seitenzahl, I. R., & Townsley, D. M. 2017, in Nucleosynthesis in Thermonuclear Supernovae, eds. A. W. Alsabti, & P. Murdin (Springer), 1955 [Google Scholar]
- Seitenzahl, I. R., Taubenberger, S., & Sim, S. A. 2009, MNRAS, 400, 531 [NASA ADS] [CrossRef] [Google Scholar]
- Seitenzahl, I. R., Cescutti, G., Röpke, F. K., Ruiter, A. J., & Pakmor, R. 2013a, A&A, 559, L5 [NASA ADS] [CrossRef] [EDP Sciences] [Google Scholar]
- Seitenzahl, I. R., Ciaraldi-Schoolmann, F., Röpke, F. K., et al. 2013b, MNRAS, 429, 1156 [Google Scholar]
- Shen, K. J., & Bildsten, L. 2009, ApJ, 699, 1365 [NASA ADS] [CrossRef] [Google Scholar]
- Shen, K. J., & Moore, K. 2014, ApJ, 797, 46 [NASA ADS] [CrossRef] [Google Scholar]
- Shen, K. J., Kasen, D., Weinberg, N. N., Bildsten, L., & Scannapieco, E. 2010, ApJ, 715, 767 [NASA ADS] [CrossRef] [Google Scholar]
- Sim, S. A., Röpke, F. K., Hillebrandt, W., et al. 2010, ApJ, 714, L52 [Google Scholar]
- Sim, S. A., Fink, M., Kromer, M., et al. 2012, MNRAS, 420, 3003 [NASA ADS] [CrossRef] [Google Scholar]
- Sim, S. A., Seitenzahl, I. R., Kromer, M., et al. 2013, MNRAS, 436, 333 [NASA ADS] [CrossRef] [Google Scholar]
- Simmerer, J., Sneden, C., Ivans, I. I., et al. 2003, ApJ, 125, 2018 [NASA ADS] [CrossRef] [Google Scholar]
- Sneden, C., Gratton, R., & Crocker, D. 1991, A&A, 246, 354 [Google Scholar]
- Springel, V. 2010, MNRAS, 401, 791 [NASA ADS] [CrossRef] [Google Scholar]
- Taubenberger, S. 2017, Handbook of Supernovae (Springer), 317 [CrossRef] [Google Scholar]
- Thielemann, F.-K., Nomoto, K., & Yokoi, K. 1986, A&A, 158, 17 [NASA ADS] [Google Scholar]
- Timmes, F. X., & Arnett, D. 1999, ApJS, 125, 277 [NASA ADS] [CrossRef] [Google Scholar]
- Timmes, F. X., Woosley, S. E., & Weaver, T. A. 1995, ApJS, 98, 617 [NASA ADS] [CrossRef] [Google Scholar]
- Timmes, F. X., Brown, E. F., & Truran, J. W. 2003, ApJ, 590, L83 [NASA ADS] [CrossRef] [Google Scholar]
- Tinsley, B. 1979, ApJ, 229, 1046 [NASA ADS] [CrossRef] [Google Scholar]
- Townsley, D. M., Miles, B. J., Shen, K. J., & Kasen, D. 2019, ApJ, 878, L38 [NASA ADS] [CrossRef] [Google Scholar]
- Travaglio, C., Hillebrandt, W., Reinecke, M., & Thielemann, F.-K. 2004, A&A, 425, 1029 [NASA ADS] [CrossRef] [EDP Sciences] [Google Scholar]
- Travaglio, C., Gallino, R., Rauscher, T., et al. 2014, ApJ, 795, 141 [CrossRef] [Google Scholar]
- Tsujimoto, T., & Nishimura, N. 2018, ApJ, 863, L27 [CrossRef] [Google Scholar]
- Wanajo, S., Müller, B., Janka, H.-T., & Heger, A. 2018, ApJ, 852, 40 [NASA ADS] [CrossRef] [Google Scholar]
- Wang, B., & Han, Z. 2012, New Astron. Rev., 56, 122 [NASA ADS] [CrossRef] [Google Scholar]
- Weinberg, D. H., Holtzman, J. A., Hasselquist, S., et al. 2019, ApJ, 874, 102 [NASA ADS] [CrossRef] [Google Scholar]
- Whelan, J., & Iben, I. J. 1973, ApJ, 186, 1007 [NASA ADS] [CrossRef] [Google Scholar]
- Willcox, D. E., Townsley, D. M., Calder, A. C., Denissenkov, P. A., & Herwig, F. 2016, ApJ, 832, 13 [CrossRef] [Google Scholar]
- Woosley, S. E., & Kasen, D. 2011, ApJ, 734, 38 [Google Scholar]
- Woosley, S. E., & Weaver, T. A. 1995, ApJS, 101, 181 [NASA ADS] [CrossRef] [Google Scholar]
- Woosley, S. E., Arnett, W. D., & Clayton, D. D. 1973, ApJS, 26, 231 [NASA ADS] [CrossRef] [Google Scholar]
- Yamaguchi, H., Badenes, C., Foster, A. R., et al. 2015, ApJ, 801, L31 [NASA ADS] [CrossRef] [Google Scholar]
- Yan, H., Shi, J., & Zhao, G. 2015, ApJ, 802, 36 [NASA ADS] [CrossRef] [Google Scholar]
- Yan, H., Shi, J., Nissen, P. E., & Zhao, G. 2016, A&A, 585, A102 [NASA ADS] [CrossRef] [EDP Sciences] [Google Scholar]
All Tables
Mn-to-Fe ratio compared to solar for the total explosion at 100 s after ignition and to shell and core material only, the total amount of stable Mn in M⊙, and the radioactive and stable isotopes from which 55Mn originates (shown as percentages).
Total amount of stable Zn in M⊙ and the radioactive and stable isotopes from which Zn originates (shown as percentages) at 100 s.
Ratio of Zn to Fe compared to solar for the total explosion, to shell and core material only, and to stable zinc isotopes decayed at 2 × 10⁹ yr.
Total amount of stable Cu in M⊙ and the radioactive and stable isotopes from which Cu originates (shown as percentages) at 100 s.
Ratio of Cu to Fe compared to solar for the total explosion, and for shell and core material only and stable copper isotopes decayed at 2 × 10⁹ yr.
All Figures
|
Fig. 1. Burning regimes in the T − ρ plane according to Woosley et al. (1973). Below a certain temperature the burning of silicon is incomplete. At high temperatures the state of nuclear statistical equilibrium is achieved and silicon is transformed into iron peak elements. This region is subdivided in the regime of normal freeze-out and α-rich freeze-out. The shaded area covers values of χ between 1 and 10 according to Eqs. (3) and (4). |
| In the text | |
|
Fig. 2. Distribution of the tracer particles in the Tpeak − ρpeak plane with color-coded mass fraction of 56Ni 100 s after triggering the explosion. The panels show (a) PD081, (b) PD115, (c) VM, (d) CSDD-S, (e) CSDD-L, (f) M2a⊙, (g) R60, (h) N100ddt. The gray shaded regions separate incomplete (left) from complete silicon burning (right) and normal freeze-out (upper right) from α-rich freeze-out (lower right) according to Eqs. (3) and (4). The area covered corresponds to a varying scaling parameter: 1 < χ < 10. |
| In the text | |
|
Fig. 3. Elemental ratios to Fe (with radioacitve isotopes decayed to 2 × 10⁹ yr) compared to their solar ratios for three sub-MCh detonations (VM, PD081, PD115), three double detonations (M2a⊙, CSDD-S, CSDD-L), one helium detonation (HeD-S), two pure MCh deflagrations (R60, W7), and a delayed detonation (N100ddt). |
| In the text | |
|
Fig. 4. Same as Fig. 2 with a color-coded mass fraction of 55Co. The panels show (a) R60, (b) VM, (c) M2a⊙. |
| In the text | |
|
Fig. 5. Evolution of [Mn/Fe] for different SNe Ia scenarios. The sub-MCh scenario is represented by the Model VM, the MCh scenario by N100ddt, and N5def is used as a proxy for SNe Iax. The shaded areas in the runs sub-MCh+CSDD-L and sub-MCh+HeD-S correspond to a range in the rate of Ca-rich transients between 33% and 94%. Black dots show observational data of Adibekyan et al. (2012), blue diamonds the data of Reddy et al. (2006), yellow triangles the data of Gratton et al. (2003), and red squares the data of Ishigaki et al. (2012, 2013). The data is from the STELLar ABundances (STELLAB) library (Ritter & Côté 2016). The non-LTE data by Eitner et al. (2020) are not included in this simple approach. |
| In the text | |
|
Fig. 6. Same as Fig. 2 with a color-coded mass fraction of the parent nuclei of Zn listed in Table 2. The panels show (a) R60, (b) VM, (c) M2a⊙. |
| In the text | |
|
Fig. 7. Energy generation rate ϵ of the emission of positrons, conversion electrons, and Auger electrons in model M2a⊙. Shaded areas show the range between no X-ray trapping and full X-ray trapping. The black curve depicts the contribution of the 68Ga decay relative to the total energy generation. |
| In the text | |
|
Fig. 8. Same as Fig. 2, with a color-coded mass fraction of 64Ge. The panels show (a) R60, (b) VM, (c) M2a⊙. |
| In the text | |
Current usage metrics show cumulative count of Article Views (full-text article views including HTML views, PDF and ePub downloads, according to the available data) and Abstracts Views on Vision4Press platform.
Data correspond to usage on the plateform after 2015. The current usage metrics is available 48-96 hours after online publication and is updated daily on week days.
Initial download of the metrics may take a while.