Fig. 5.
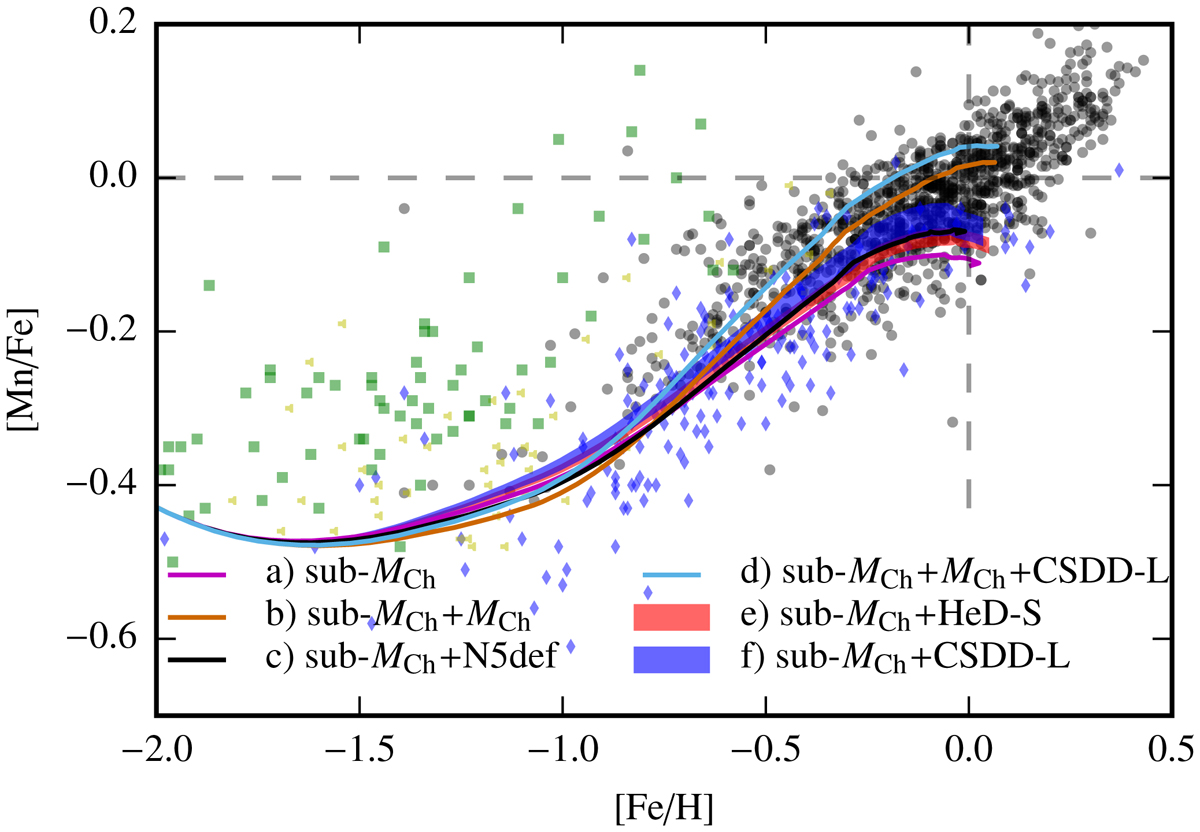
Evolution of [Mn/Fe] for different SNe Ia scenarios. The sub-MCh scenario is represented by the Model VM, the MCh scenario by N100ddt, and N5def is used as a proxy for SNe Iax. The shaded areas in the runs sub-MCh+CSDD-L and sub-MCh+HeD-S correspond to a range in the rate of Ca-rich transients between 33% and 94%. Black dots show observational data of Adibekyan et al. (2012), blue diamonds the data of Reddy et al. (2006), yellow triangles the data of Gratton et al. (2003), and red squares the data of Ishigaki et al. (2012, 2013). The data is from the STELLar ABundances (STELLAB) library (Ritter & Côté 2016). The non-LTE data by Eitner et al. (2020) are not included in this simple approach.
Current usage metrics show cumulative count of Article Views (full-text article views including HTML views, PDF and ePub downloads, according to the available data) and Abstracts Views on Vision4Press platform.
Data correspond to usage on the plateform after 2015. The current usage metrics is available 48-96 hours after online publication and is updated daily on week days.
Initial download of the metrics may take a while.