Fig. 2.
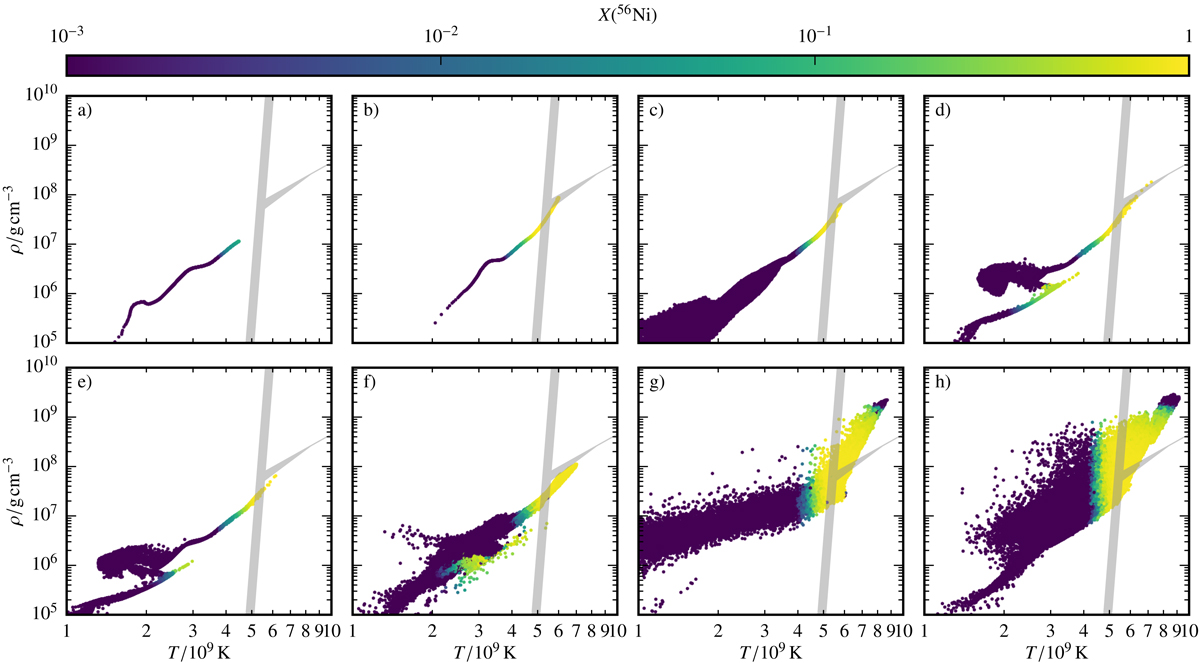
Distribution of the tracer particles in the Tpeak − ρpeak plane with color-coded mass fraction of 56Ni 100 s after triggering the explosion. The panels show (a) PD081, (b) PD115, (c) VM, (d) CSDD-S, (e) CSDD-L, (f) M2a⊙, (g) R60, (h) N100ddt. The gray shaded regions separate incomplete (left) from complete silicon burning (right) and normal freeze-out (upper right) from α-rich freeze-out (lower right) according to Eqs. (3) and (4). The area covered corresponds to a varying scaling parameter: 1 < χ < 10.
Current usage metrics show cumulative count of Article Views (full-text article views including HTML views, PDF and ePub downloads, according to the available data) and Abstracts Views on Vision4Press platform.
Data correspond to usage on the plateform after 2015. The current usage metrics is available 48-96 hours after online publication and is updated daily on week days.
Initial download of the metrics may take a while.