Free Access
Fig. 7.
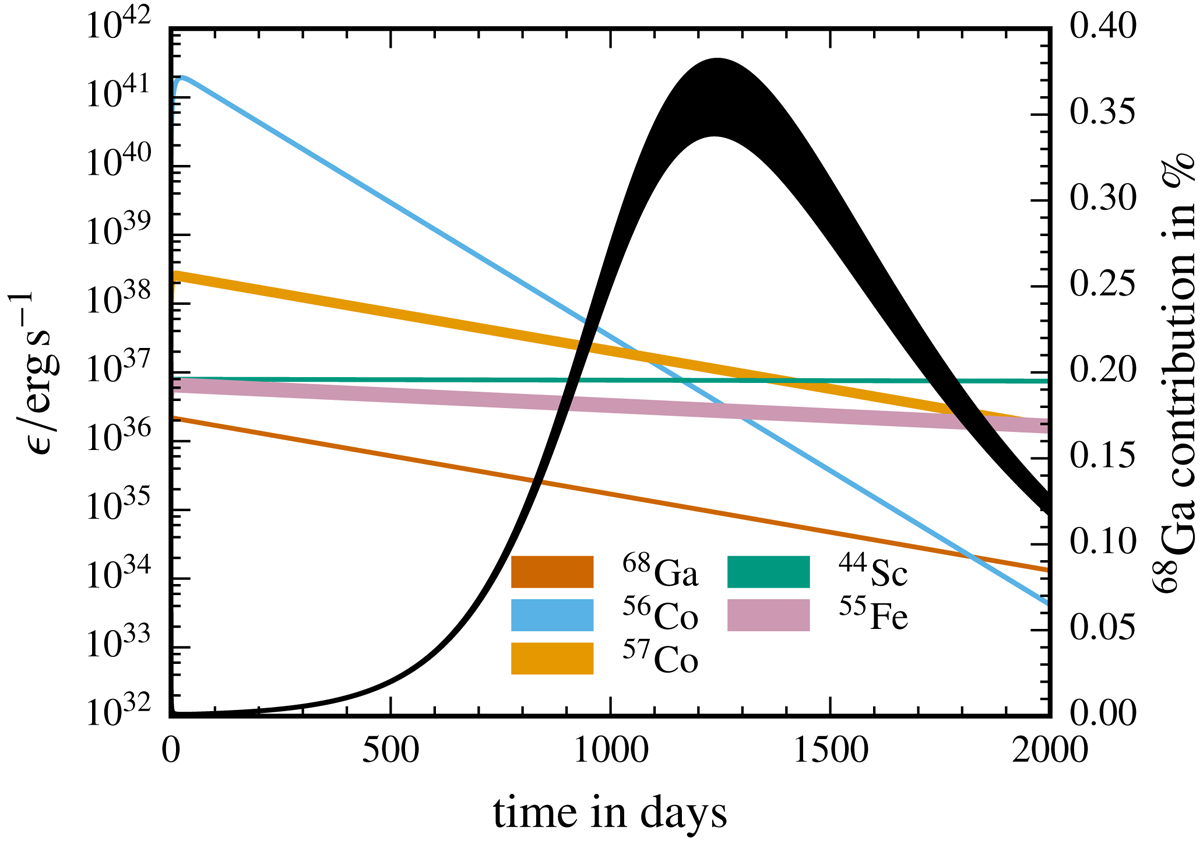
Energy generation rate ϵ of the emission of positrons, conversion electrons, and Auger electrons in model M2a⊙. Shaded areas show the range between no X-ray trapping and full X-ray trapping. The black curve depicts the contribution of the 68Ga decay relative to the total energy generation.
Current usage metrics show cumulative count of Article Views (full-text article views including HTML views, PDF and ePub downloads, according to the available data) and Abstracts Views on Vision4Press platform.
Data correspond to usage on the plateform after 2015. The current usage metrics is available 48-96 hours after online publication and is updated daily on week days.
Initial download of the metrics may take a while.