| Issue |
A&A
Volume 643, November 2020
|
|
|---|---|---|
| Article Number | A172 | |
| Number of page(s) | 10 | |
| Section | Cosmology (including clusters of galaxies) | |
| DOI | https://doi.org/10.1051/0004-6361/202039056 | |
| Published online | 20 November 2020 | |
The great Kite in the sky: A LOFAR observation of the radio source in Abell 2626⋆
1
Dipartimento di Fisica e Astronomia, Università di Bologna, via Gobetti 93/2, 40129 Bologna, Italy
e-mail: This email address is being protected from spambots. You need JavaScript enabled to view it.
2
INAF, Istituto di Radioastronomia di Bologna, via Gobetti 101, 40129 Bologna, Italy
3
ASTRON, the Netherlands Institute for Radio Astronomy, Postbus 2, 7990 AA Dwingeloo, The Netherlands
4
Leiden Observatory, Leiden University, PO Box 9513, 2300 RA Leiden, The Netherlands
5
Centre for Astrophysics Research, University of Hertfordshire, College Lane, Hatfield AL10 9AB, UK
6
International Centre for Radio Astronomy Research, Curtin University, GPO Box U1987, Perth, WA 6845, Australia
7
SKA Organisation, Jodrell Bank Observatory, Macclesfield SK11 9DL, UK
8
Jodrell Bank Centre for Astrophysics, Department of Physics & Astronomy, University of Manchester, Oxford Road, Manchester M13 9PL, UK
9
Hamburger Sternwarte, Universität Hamburg, Gojenbergsweg 112, 21029 Hamburg, Germany
Received:
29
July
2020
Accepted:
23
September
2020
Abstract
Context. The radio source at the center of the galaxy cluster Abell 2626, also known as the Kite, stands out for its unique morphology composed of four symmetric arcs. Previous studies have probed the properties of this source at different frequencies and its interplay with the surrounding thermal plasma, but the puzzle of its origin is still unsolved.
Aims. We use a new LOw-Frequency ARray (LOFAR) observation from the LOFAR Two-meter Sky Survey at 144 MHz to investigate the origin of the Kite.
Methods. We present a detailed analysis of the new radio data, which we combined with archival radio and X-ray observations. We produced a new, resolved spectral index map of the source with a resolution of 7″ and we studied the spatial correlation of radio and X-ray emission to investigate the interplay between thermal and nonthermal plasma.
Results. The new LOFAR data changed our view of the Kite because we discovered two steep-spectrum (α < −1.5) plumes of emission connected to the arcs. The spectral analysis shows, for the first time, a spatial trend of the spectrum along the arcs with evidence of curved synchrotron spectra and a spatial correlation with the X-ray surface brightness. On the basis of our results, we propose that the Kite was originally an X-shaped radio galaxy whose fossil radio plasma, after the end of the activity of the central active galactic nucleus, has been compressed as a consequence of motions of the thermal plasma encompassing the galaxy. The interplay between the compression and advection of the fossil plasma, with the restarting of the nuclear activity of the central galaxy, could have enhanced the radio emission of the fossil plasma producing the arcs of the Kite. We also present the first, low-frequency observation of a jellyfish galaxy in the same field, in which we detect extended, low-frequency emission without a counterpart at higher frequencies.
Key words: galaxies: clusters: individual: Abell 2626 / galaxies: individual: IC 5338 / galaxies: jets / radio continuum: galaxies / radiation mechanisms: non-thermal / methods: observational
The reduced images are only available at the CDS via anonymous ftp to cdsarc.u-strasbg.fr (130.79.128.5) or via http://cdsarc.u-strasbg.fr/viz-bin/cat/J/A+A/643/A172
© ESO 2020
1. Introduction
Among the radio sources observed in galaxy clusters, the source at the center of the relaxed galaxy cluster Abell 2626 (hereafter A2626) stands out for its unique properties. The discovery of diffuse radio emission at the center of the cluster surrounding the radio source 3C464 was reported for the first time by Rizza et al. (2000). In the first image at 1.4 GHz the source resembled an amorphous 100 kpc blob around the central galaxy IC 5338. Thus it was classified as a radio mini-halo (Gitti et al. 2004), a class of diffuse radio sources observed at the centers of relaxed clusters. Rizza et al. also noted the presence of two symmetric substructures embedded in the diffuse emission around the central galaxy. On the basis of a detailed analysis of the X-ray emission and the presence of two optical nuclei at the center of the galaxy, Wong et al. (2008) suggested that these symmetric features could be the remnants of past activity of the central active galactic nucleus (AGN), where the precession of the AGN might have left two fossil plasma trails. Later, deeper high-resolution observations carried out with the Very Large Array (VLA) in A+B configuration at 1.4 GHz found that the source was not amorphous, but instead most of the emission comes from three elongated and collimated structures that were called “arcs” (Gitti 2013). The arcs were observed in northward (N), westward (W), and southward (S) of the central galaxy, with a junction between the southern and western arcs (Fig. 1, top right panel). The most puzzling features were the remarkably symmetric northern and southern arcs and their concavity, which was directed outward and earned this source the name of the Kite. In these 1.4 GHz images the major and minor axis are 120 and 40 kpc, respectively. The minimum projected distance of the arcs from the central AGN is ∼25 kpc. The discovery of the third arc suggested a more complex scenario than that invoked by Wong et al. (2008) and the properties that were emerging discouraged the classification of the Kite as one of the common diffuse radio sources observed in galaxy clusters, such as radio relics or radio mini-halos. New insights into its origin came from further radio observations at a different frequency. By analyzing archival Giant Metrewave Radio Telescope (GMRT) data at 610 MHz, Kale & Gitti (2017) discovered the presence of a fainter fourth arc on the east (E), thus completing the symmetry of the system (Fig. 1, top left panel). These authors produced a spectral index map between 610 MHz and 1.4 GHz, measuring a spectral index in the arcs of α ∼ −2.5 (we define the radio spectrum S ∝ να, where S is the observed radio flux density at frequency ν). Subsequently, Ignesti et al. (2017) presented Jansky Very Large Array images of the Kite obtained at 3.0 GHz and 5.5 GHz in C configuration. These authors found that the arcs have a steep spectral index α ∼ −3 up to 3 GHz, with no clear evidences of spectral index gradient along the arc length. These results severely constrained the jet-precession scenario because if the arcs were created gradually by the AGN, then a trend in spectral index was expected as a result of the radiative aging of the plasma. Ignesti et al. (2018) carried out a detailed study of the deepest Chandra observation available of the cluster. They authors discovered a cold front at the center of the cluster and found that the edge of the sloshing coincides remarkably well with the junction between the S and W arcs. Subsequent studies confirmed the presence of a cavity in the intra-cluster medium (ICM) located beyond the S-W junction of the radio arcs and suggested that it was created by past AGN activity (Kadam et al. 2019).
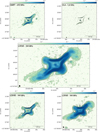 |
Fig. 1. Images of the Kite at different frequencies obtained by reprocessing archival datasets. Top left: GMRT image at 610 MHz; the RMS is 120 μJy beam−1 and the resolution is 6.2″ × 4.1″; top right: VLA A+B image at 1.4 GHz; the RMS is 13 μJy beam−1 and the resolution is 1.5″ × 1.4″. In both image the contours are at the −3, 3, 6, 12, and 24σ levels. New images at 144 MHz. Middle: robust = −0.75; the final resolution is 6.7″ × 5.6″ and the RMS is 120 μJy beam−1. The contours are at the −3, 3, 6, 12, 24, 48, 96, 192, 384σ level; bottom left: robust = −2; the final resolution is 4.2″ × 3.2″ and the RMS is 380 μJy beam−1. The contours are at the −3, 3, 6, 12, 24, 48, 96σ level; bottom right: robust = −0.25; the final resolution is 12.2″ × 7.7″ and the RMS is 140 μJy beam−1. The contours are at the −3, 3, 6, 12, 24, 48, 96, 192, 384σ level. The surface brightness is reported in units of Jy beam−1. |
In this paper we present the results of the analysis of a new observation of this cluster made with the LOw-Frequency ARay (LOFAR). This observation is part of the LOFAR Two-metre Sky Survey (LoTSS; Shimwell et al. 2017). This survey aims to observe the entire northern sky at 120–168 MHz with a resolution of ∼6″ and a sensitivitiy of ∼100 μJy beam−1. In addition to the new LOFAR observations, we also combine with archival radio (GMRT and VLA) and X-ray (Chandra and XMM-Newton) to obtain new insights into the nature of the Kite. The paper is structured as follows. In Sect. 2 we present the processing of the new LOFAR data and the archival radio and X-ray observations. The results are analyzed in Sect. 3, in which we also present an analysis of the low-frequency emission of the jellyfish galaxy JW100, and discussed in Sect. 4.
We adopt a ΛCDM cosmology with H0 = 70 km s−1 Mpc−1, ΩM = 1 − ΩΛ = 0.3. At the cluster redshift (z = 0.0553, Struble & Rood 1999), it yields a luminosity distance of 246.8 Mpc and 1 arcsec = 1.1 kpc1.
2. Data preparation
2.1. Radio data
In this work we present the analysis of the pointing P353+21 of the LoTSS survey (Shimwell et al. 2017, 2019). The observation was made using the Dutch High Band Antenna (HBA) array, which operates in the 120–168 MHz band, for a total observation time of 8.33 h. We reduced the dataset using the direction-dependent data-reduction pipeline DDF-PIPELINE v. 2.2 developed by the LOFAR Surveys Key Science Project2. The data processing makes use of PREFACTOR (van Weeren et al. 2016; Williams et al. 2016; de Gasperin et al. 2019), KILLMS (Tasse 2014; Smirnov & Tasse 2015), and DDFACET (Tasse et al. 2018) to perform the calibration and imaging of the entire LOFAR field of view. Then, we performed additional phase and amplitude self-calibration cycles to correct the residual artifacts in a smaller region extracted from the observation and centered on the source, where the direction-dependent errors are assumed to be negligible. The details of this extraction and recalibration step will be discussed in a forthcoming paper (van Weeren et al. 2020). We produced images at multiple resolutions via WSCLEAN v2.6 (Offringa et al. 2014) using several different Briggs weightings (Briggs & Cornwell 1994), with robust going from 0 to −2, and multiscale cleaning (Offringa & Smirnov 2017). An inner uvcut of 80λ, corresponding to an angular scale of 43′, was applied to the data to drop the shortest spacings where calibration is more challenging. The resulting images are shown in Fig. 1. Finally, we corrected for the systematic offset of the LOFAR flux density scale produced by inaccuracies in the LOFAR HBA beam model by multiplying it with a factor of 1.17, which aligns it with the flux scale of the LoTSS-DR2 catalog that is calibrated off the NRAO VLA Sky Survey (NVSS) flux scale. Following LoTSS (Shimwell et al. 2019), we adopted a conservative calibration error of 20%, which dominates the uncertainties on the LOFAR flux densities.
We also present the GMRT and the VLA images of A2626 obtained from archival observations. We retrieved the archival GMRT observation of the cluster at 610 MHz, with a time on target of 95 mins, (observation 561, PI Clarke) and we processed it using the SPAM pipeline (see Intema et al. 2009, 2017, for details). For the VLA observation we used the calibrated dataset presented by Gitti (2013). The images at 610 MHz and 1.4 GHz presented in this work were made using WSCLEAN.
2.2. X-ray data
In this work we analyzed archival Chandra and XMM-Newton observations of A2626 to produce images in the 0.5–2.0 keV band of the cluster. Specifically, we used the Chandra observations 3192 and 16136 for a total exposure time of 130 ks, and the XMM-Newton observations 0083150201 and 0148310101 for a total exposure time of 55 ks. We reprocessed the Chandra datasets with CIAO 4.10 and CALDB 4.8.1 to correct for known time-dependent gain and for charge transfer inefficiency. In order to filter out strong background flares, we also applied screening of the event files3. For the background subtraction, we used the CALDB “Blank-Sky” files normalized to the count rate of the source image in the 10–12 keV band. The data reduction of the XMM-Newton observations was performed using the Extended Source Analysis Software (ESAS) integrated in the Scientific Analysis System (SAS v16.1.0). Observation periods affected by soft proton flares were filtered out with the mos-filter and pn-filter tasks. For each detector and observation we produced count images, background images, and exposure maps. These were combined to create a background-subtracted and exposure-corrected EPIC mosaic in the 0.5–2.0 keV band.
3. Image analysis and results
At 144 MHz the source shows its striking, kite-like morphology regardless of the resolution of the images (Fig. 1). The arcs are more extended along the major and minor axes than at higher frequencies, but their inner edges still have a projected distance of ∼25 kpc from the AGN and we detect extended emission between the AGN and the arcs. The LOFAR data reveal for the first time two large “plumes” of emission emerging from the ends of the arcs in the southeast and northwest directions (Fig. 1, middle and bottom right panels), more than doubling the projected size of the Kite to ∼220 kpc (≃3.7′). The new data also reveal two lobes of emission toward NE and SW. Finally, we observe extended emission associated with the galaxy JW100 (IC5337; see Sect. 3.4). Figure 2 reports a schematic drawing of the Kite where we indicate the several components of the radio emission observed by LOFAR. In the robust = −0.75 image (Fig. 1, middle panel) we measure a 144 MHz flux density of 7.7 ± 1.6 Jy for the whole source. The surface brightness contours show that the arcs, whose high brightness at low frequency (> 100σ) was expected because of their steep spectra (Kale & Gitti 2017; Ignesti et al. 2017), dominate the total emission of the Kite.
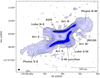 |
Fig. 2. Sketch of the Kite observed at 144 MHz (Fig. 1, middle panel) color coded for the surface brightness level where we indicate the main components of the radio emission. |
3.1. Spectral index map
In order to probe the properties of the relativistic electrons, we combined the new data with archival GMRT and VLA observation at 610 MHz GHz and 1.4 GHz, respectively, to produce a resolved, three-band spectral index map (Fig. 3). First we produced new maps at the three frequencies using WSCLEAN with a uniform weighting for the visibilities and a uv range of 200–46 000λ to match the same spatial scale in all wavelengths. The lower cut at 200λ implies a largest recoverable angular scale of ∼20′, hence this cut allows the detection of the complete structure of the Kite for each band. The resulting images were smoothed to a common resolution of 7″ × 7″. The resulting RMS noise of the LOFAR, GMRT, and VLA maps are 280, 150, and 35 μJy beam−1, respectively. We combined the three maps to produce a spectral index map and the corresponding error map. We compared the emission above the 3σ level of the LOFAR image with the emission above 2σ for the GMRT and VLA images to probe the steep-spectrum emission in the arcs. For each pixel of each map, we measured the flux density and its associated error. For each frequency, we extracted random values of the flux within the associated error by assuming a normal distribution. Then we fitted the three boot-strapped flux densities with a power-law spectrum S(ν) = S0να to evaluate the spectral index. We repeated this procedure 500 times for each pixel, thus ending with a normal-like distribution of values of α whose skewness depends on the relative uncertainties of the flux densities in each pixel. The final spectral index map in Fig. 3 shows in each pixel the mean of these distributions, whereas the error map shows the standard deviations. This approach allows us to get reliable errors on the spectral index that reflect the uncertainties of the three measurements.
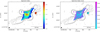 |
Fig. 3. Spectral index map (left) and relative error map (right) obtained combining LOFAR, GMRT, and VLA maps at 144, 610 MHz and 1.4 GHz, respectively. The resolution is 7″ × 7″. We report the contours at the 3, 6, 12, 24σ levels of the maps used to produce the spectral index map with continuous and dashed lines showing the LOFAR and VLA image, respectively. |
This spectral index map allows us to divide the radio source in two regions. The central region within the arcs shows a flatter spectrum, −1 < α < −0.5, whereas in the arcs the spectral index is α < −1.5. Thanks to the resolution and sensitivity provided by the new LOFAR data, we observe, for the first time, a spatial gradient along the arcs N and S, where the spectrum steepens moving from the centers of the arcs to their ends. On the contrary, the arcs E and W do not show this trend; instead they exhibit more uniform and steeper spectra. Despite the low threshold in surface brightness at the higher frequencies, we could not map the spectral index of the lobes and the plumes. For the latter, we could derive only an upper limit for the spectral index α < −1.5 by comparing their mean surface brightness at 144 MHz (in units of Jy beam−1) with the 2σ level of VLA image. Finally we used the LOFAR and VLA images produced for the spectral index analysis to estimate the integrated spectral index of the Kite. By comparing the total flux densities within the 3σ contours of the 144 MHz map, we estimated an integrated spectral index α = −2.0 ± 0.4 between 144 MHz and 1.4 GHz, which entails a k-corrected radio power at 144 MHz of 6 × 1025 W Hz−1.
3.2. Point-to-point analysis
We performed a point-to-point analysis to explore the spatial correlation between the spectral index, α, and X-ray surface brightness, IX, which is a proxy of the projected thermal plasma density. Observing (or not) a spatial correlation between the two quantities could potentially provide insight into the intrinsic relation between the thermal plasma and the nonthermal ICM components, that is, the magnetic field and relativistic particles. In this work we combined the observations of the cluster at 144, 610 MHz, and 1.4 GHz with the Chandra X-ray image. We sampled the region of the Kite where the 610 MHz emission is above the 3σ level with a grid whose cells are 12″×12″ in size to compromise between the signal-to-noise ratio of each cell and the number of significant points. On the one hand, this sampling assures a reliable estimate of the spectral index for the low band (144–610 MHz) of the spectrum in each cell. On the other hand, it introduces large uncertainties in the high band (610 MHz–1.4 GHz) for those regions where the radio surface brightness at 1.4 GHz is below 3σ. The grid includes the central region (except the AGN and the jet-like feature that we excluded from this analysis), the arcs, and part of the emission in the NW-SE direction (see Fig. 4). For each cell of the grid, we measured the flux densities at the three frequencies and the IX from the Chandra image of the cluster to produce the color-color plot (Fig. 4, we refer to Katz-Stone et al. 1993, for further details about this method). We observe that the majority of the points cover the Kite are located below the 1:1 line, which implies that the spectrum of the radio emission is steeper in the 610 MHz–1.4 GHz band than in the 144 MHz–610 MHz band for the majority of the Kite, that is, the synchrotron spectrum is mostly curved. This, in addition to the steep spectrum, indicates that the radio plasma of the Kite is radiatively old. We observe that, in general, the flattest spectrum emission is associated with the regions with the brightest X-ray emission and we estimated Spearman ranks between α and IX of 0.5 and 0.7 for the low band and high band, respectively. This indicates that there is a spatial correlation between the slope of the synchrotron spectrum and the density of the thermal plasma along the arcs.
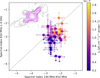 |
Fig. 4. Spectral index in 610 MHz–1.4 GHz vs. spectral index in 144 MHz–610 MHz band, color coded for the X-ray surface brightness IX. The values were measured in the cells of the green grid that is shown in the top left corner, overlapped on the 3, 24, 96σ levels of the 144 MHz image involved in the spectral analysis. The cells in which the relative error on the spectral index is greater than 50% are shown as upper limits. |
3.3. X-ray residual maps
Finally, we compared the radio emission with the X-ray emission similarly to the analysis performed in Ignesti et al. (2018). The cluster is relaxed, thus the IX profile can be well described by a β-model profile (e.g., Cavaliere & Fusco-Femiano 1976). Therefore, by subtracting from the observed IX a 2D β-model fitted to the images, we can highlight substructures in the ICM such as over-densities or cavities. We performed this analysis on both Chandra and XMM-Newton observations of the cluster using the package SHERPA (Freeman et al. 2001). In both observations we masked the central AGN and the close spiral galaxy JW100 (see Sect. 3.4), due to its extended X-ray emission not associated with the ICM emission (Poggianti et al. 2019). The best-fit parameters are core radius rc= 13.36″, β = 0.45 for Chandra, and rc = 18.08″, β = 0.48 for ; the results are shown in Fig. 5. We found an excess of surface brightness in both the observations (red regions in Fig. 5); this excess is extended from the center to the NE and crosses the northern part of the Kite, and is associated with a local excess of the thermal ICM density with respect to the mean gas density of the cluster. This structure, due to its morphology and its proximity to the cold front, has already been claimed as evidence of the sloshing of the cool core by previous works (Ignesti et al. 2018; Kadam et al. 2019). We also observe a depression in the SW direction (Fig. 5) aligned with the jet-like features observed in the high-resolution observation at 1.4 GHz (Fig. 1, top right panel). The new LOFAR data show, for the first time, that the radio plasma fills this structure, thus supporting the hypothesis suggested in Shin et al. (2016) and Kadam et al. (2019) that it could be a radio-filled cavity. Kadam et al. (2019) also estimated an AGN mechanical power of 6.6 × 1044 erg s−1, that is, in the typical range for AGN radio-mode feedback in galaxy clusters (e.g., Gitti et al. 2012, for a review). Therefore, we conclude that this radio-filled cavity indicates that the radio plasma could have originally been injected by the central AGN.
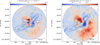 |
Fig. 5. Comparison of the radio emission with the residual X-ray images produced with Chandra (left) and XMM-Newton (right) in the 0.5–2.0 keV band. Red indicates an excess with respect to the β-model, whereas blue is a deficit. The contours are the 3, 24, 48, 192σ of the image presented in Fig. 1, middle panel. The images are smoothed with a Gaussian filter of 2.5″ for Chandra and 15″ for XMM-Newton. The yellow cross and white mask indicate the position of the AGN of IC 5338 and the galaxy JW100, respectively. The black dashed ellipse indicates the putative position of the cavity. |
3.4. Jellyfish galaxy JW100
In this paper, we also report the detection of extended radio emission associated with another galaxy of the A2626, specifically with the jellyfish galaxy JW100 (also known as IC 5337, z = 0.06; Poggianti et al. 2019), at 144 MHz (Fig. 6). Jellyfish galaxies are the most extreme examples of galaxies undergoing ram pressure stripping by the ICM and they represent unique laboratories to study the interplay between various gas phases and star formation. The resolution of our data allowed us to disentangle the AGN and an extended component that coincides spatially with the cold, star-forming structures observed both at 1.4 GHz and in Hα (Gitti 2013; Poggianti et al. 2019). We measured a total flux density of 13.3 ± 2.4 mJy, with 4.8 ± 1.0 mJy associated with the AGN. By subtracting the AGN contribution, we estimated that the emission from the galaxy is 8.5 ± 2.6 mJy. In order to to estimate the spectral index, we compared these values with the flux densities measured in the same regions in the 1.4 GHz map that we used for the spectral index analysis (Sect. 3). We found that both the extended emission and the AGN have a spectral index α = −0.6 ± 0.1. The k-corrected, monochromatic radio power at 144 MHz of the extended emission is 7.7 × 10²² W Hz−1. The radio power at 1.4 GHz of the extended component is consistent with the luminosity that is expected based on the star-formation rate estimated from the Hα emission (Poggianti et al. 2019). Hence the observed spectral index suggests that, at lower frequencies, we are observing the oldest/weakest electrons produced by the same process. Interestingly, we also detected radio emission at 144 MHz without a counterpart at 1.4 GHz. We speculate that this component could be produced by the oldest electrons injected by supernovae associated with a star formation phase prior to that observed at 1.4 GHz. Finally, we observed that apparently this galaxy is linked to the northern plume of the Kite but most likely the galaxy is an artifact given by the resolution of our image.
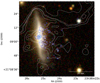 |
Fig. 6. Composite SDSS image of JW100 from bands i, r, and g. The blue-filled contours are 3, 6, 12, 24σ levels of the 1.4 GHz image; the white continuous contours are the 3, 5, 6, 12σ levels of the 144 MHz image (Fig. 1). |
4. Discussion
4.1. Morphology and spectral index of the Kite
The new LOFAR data show that the diffuse radio emission is more extended than what we observe at higher frequencies (Figs. 1 and 7). The LOFAR observation reveals two diffuse plumes at the ends of the arcs in the NW-SE direction. In the new images, we observe that the radio surface brightness outside the arcs drops by a factor ∼60 within ∼10 kpc, whereas in the plumes the emission gradually declines. This indicates that in the arcs the nonthermal components (i.e., the magnetic field and relativistic electrons), which are traced by the radio emission, are confined. The new observation also reveals that the cold front, which appears to delimit the high-frequency radio emission (Ignesti et al. 2018), is, instead, enveloped by the low-energy, radio-emitting plasma that fills the cavity located in front of the southwest jet observed at 1.4 GHz (Fig. 5) and aligned along the major axis of IC 5338 (Fig. 7, right panel). But above all, the new observation shows that the S+W and N+E arcs compose two main structures that are almost symmetric with respect to the major axis. The spectral index maps (Fig. 3) show that the Kite is a steep-spectrum source (α < −1.5), in agreement with the previous results (Kale & Gitti 2017; Ignesti et al. 2017), but we observe a spatial gradient along the arcs N and S, where the spectral index steepens from their centers to their ends. Further insights into the properties of the Kite come from the residual maps (Fig. 5) and point-to-point analysis (Fig. 4). The spectral index map (Fig. 3) shows that the flattest regions of the arcs are located in the north and south with respect to the central galaxy, while the residual X-ray maps (Fig. 5) show that these regions coincide with an over-density of the thermal plasma, which is likely produced by the sloshing of the cool core. These two pieces of information are combined in the point-to-point analysis, where we observe that the flattest-spectrum emission comes from the regions with the brightest X-ray emission, that is, the higher-density sloshing regions. The point-to-point analysis also reveals significant curvature in the spectrum, which is indicative of radiatively old plasma.
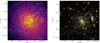 |
Fig. 7. Left: Chandra X-ray image of A2626 in the 0.5–2.0 keV band with the 3, 24, 96, 200σ level contours of the emission observed at 144 MHz in white (Fig. 1, middle panel) and the 3, 24, 96σ contours of the emission at 1.4 GHz in black (Fig. 1, top right panel). Cyan indicates the position of the cold front observed in Ignesti et al. (2018). Right: composite SDSS image from bands i, r, and g with the 3, 24, 96, 200σ contours of the emission at 144 MHz in silver (Fig. 1, middle panel), the 3, 24, 96σ contours of the emission at 1.4 GHz in cyan (Fig. 1, top right panel) and SDSS composite image smoothed with a Gaussian kernel of standard deviation 1 arcsec at 6, 30, 150 times the RMS noise in the smoothed image (0.015 maggies) in yellow. |
4.2. New scenario for the origin of the Kite
On the basis of our results, we speculate on the origin of the Kite. On the one hand, we claim it is very unlikely that the Kite is a mini-halo. Moreover, the morphology revealed by LOFAR also discourages the lensing hypothesis (previously invoked in Kale & Gitti 2017) because producing such a blend of collimated arcs and large plumes would require implausible combinations of lenses and scattering screens. On the other hand, in the new image at 144 MHz the Kite shows remarkable similarities with two specific classes of radio galaxies: the Z-shaped (e.g., Zier 2005; Hardcastle et al. 2019) and X-shaped radio galaxies (e.g., Lal & Rao 2007; Bruno et al. 2019; Cotton et al. 2020). The Kite shares the double-axis morphology with these radio sources, where the wings (i.e., the “plumes” of the Kite; see Fig. 2) are more extended than the lobes. Moreover, the central, giant elliptical galaxy IC 5338 is elongated in the same direction as the putative minor axis of the Kite from NW to SW. The extent of this is shown by the smoothed SDSS contours in the right panel of Fig. 7 (right panel), where a Gaussian kernel of width 1 arcsecond was used to improve sensitivity to the extended stellar emission and avoid confusion with surrounding point sources. Furthermore, the radio-filled cavity (Fig. 5) and the radio jets originating from the central AGN (Fig. 7) are aligned along the same NW to SE axis. Therefore, we suggest that originally the Kite was a radio galaxy whose central AGN produced the SW cavity. In this framework, the peculiar, double-axis morphology of the Kite can be then explained by the backflow model (e.g., Leahy & Williams 1984; Hodges-Kluck & Reynolds 2011). This hydrodynamical model, which is one of the possibilities that has been invoked to explain X-shaped radio galaxies, suggests that the plasma injected by the AGN along the jets can be redirected by the hot spots or high-pressure environment back to the galaxy. In the case of axisymmetric backflow, Leahy & Williams (1984) noted that this process can cause the emission to grow in directions perpendicular to the angle at which the plasma impacts with the hot interstellar medium (ISM) of the galaxy. Therefore, for the case of the Kite, we suggest that the plasma was injected in the NE-SW direction, along the projected major axis of the IC 5338 (Fig. 7, right panel) to subsequently flow back and be redirected in the NW-SE directions to finally form the plumes. In this scenario, the hot, X-ray emitting ISM should follow the same elliptical geometry of the optical emission. However, this is not immediately observed in the Chandra image (Fig. 7, left panel), possibly owing to the complex dynamics of the ISM that could be induced by the AGN outburst.
However, there are several properties of the Kite that make this object peculiar and different from standard radio galaxies. First, the overall spectrum of the Kite (α < −1.5) is steeper than the typical spectral index of active X-shaped radio galaxies (α > −1.5, e.g., Lal & Rao 2007), which indicates that the plasma is radiatively old. The steep spectrum measured in the 144–610 MHz band (Fig. 4) suggests that the break frequency of the spectrum, νbr, is below 144 MHz and, hence, that we are observing only the radiatively old part of the synchrotron spectrum. Therefore, by assuming a putative νbr < 100 MHz and under the hypothesis that the local magnetic field, B, is in the range 5–15 μG, which is typical for radio galaxies (e.g., Croston et al. 2005), we can derive a constraint for the radiative age of the arcs, trad as
![Mathematical equation: $$ \begin{aligned} t_{\rm rad}\simeq 3.2\times 10^{10}\frac{B^{1/2}}{B^2+B_{\rm CMB}^2}\left[(1+z)\nu _{\rm br}\right]^{-1/2}\,\mathrm{yr} ,\end{aligned} $$](/articles/aa/full_html/2020/11/aa39056-20/aa39056-20-eq1.gif) (1)
(1)
where B and the equivalent magnetic field of the cosmic microwave background (CMB) BCMB = 3.25(1 + z)2 = 3.6 are expressed in units of μG and νbr is expressed in units of MHz. Under these assumptions, we determine the lower limit to the radiative age of the plasma to be between 5 × 10⁷ and 2 × 10⁸ yrs, which confirms that we are observing radio emission from old, fossil plasma. This timescale is not far from the typical duty cycle of an AGN (∼108 years, e.g., Morganti 2017) and, thus, we suggest that the active phase that injected the relativistic plasma of the Kite likely ended not too long ago.
Old radio plasma sitting in the center of clusters is expected to be uplifted owing to buoyancy in a certain timescale. This provides complementary constraints to the age of the plasma in the Kite. The facts that the source preserves its X-shaped morphology and the plumes still sit at ∼100 kpc from the central AGN implies that the plasma did not have enough time to evolve buoyantly. According to Churazov et al. (2001), the buoyant velocity of a bubble can be estimated as
 (2)
(2)
where vk is the Keplerian velocity, which we approximate to the cluster dispersion velocity σv ≃ 680 km s−1 (Cava et al. 2009); S is the cross-section of the bubble; V its volume; R the distance from the central AGN; and C ∼ 0.6 is the drag coefficient. As a reference, by assuming the plumes are spherical bubbles with r = 25 kpc at a distance R ≃ 100 kpc from the AGN, Eq. (2) gives us a reference buoyant velocity vb ∼ 700 km s−1. The mean ICM temperature at 100 kpc from the AGN is 3.4 keV (Ignesti et al. 2018) with a corresponding sound speed of ∼940 km s−1, hence the bubble would be rise subsonically in the ICM. This bouyant velocity entails a upper limit to the dynamical timescale of the plumes < 1.5 × 10⁸[sin(θ)]−1.5 yr, where θ is the angle between plumes and the line of sight, which is in line with previous constraints and suggests that the plasma is not much older than a typical AGN duty cycle.
Secondly, contrary to what is generally observed or expected in back-flowing radio galaxies, in the Kite the plumes have a projected length in the NW-SE direction that is almost double of the length of the jets, which we assumed to be originally directed in the NE-SW direction. This could be both due to local environmental properties (i.e., a stronger environmental pressure that restricted the expansion of the plasma in the jet direction) combined with bouyant motions of the radio plasma in the plume or complex projection effects due to a possible inclination of the Kite with respect to the plane of the sky. The latter hypothesis is partially supported by the spread of the color-color diagram (Fig. 4), which could be due to the mixing of plasma with different radiative ages, hence spectral indices, along the line of sight.
Finally, the most obvious difference from X-shaped galaxies is that the arcs of the Kite are clearly detached from the central AGN (Fig. 1, bottom left panel) and, on the contrary to what is observed for X-shaped galaxies, the brightest part of the Kite are the arcs, where we also observe a gradient in spectral index and a spatial correlation between the α and the X-ray emission (Fig. 4).
4.3. Role of ICM dynamics
We interpreted the presence of edge-brightened features as an indication of a role played by the ICM dynamics in the origin of this radio source. Interestingly, the radio spectral properties of the Kite resemble those of the radio phoenix sources, an exotic class of diffuse radio sources produced by the interplay of fossil radio plasma with shocks and/or ICM motions (e.g., Clarke et al. 2013; Mandal et al. 2020). Specifically, the arcs of the Kite resemble the complex, filamentary radio morphology of the radio phoenices, whose filaments have patchy distributions of increased surface brightness, and synchrotron emission that typically follow a curved spectra. To tie together these scenarios, we speculate that after the end of the AGN activity, when the plumes were already formed, the sloshing of gas in the cool core has interacted with the fossil radio plasma (Figs. 5 and 7 left panel). The typical sloshing crossing time is on the order of 108 years (e.g., Ascasibar & Markevitch 2006). Therefore, according to our estimates, the Kite would be old enough to allow the sloshing to impact significantly on its radio emission. On the basis of the temperature maps presented in literature (Ignesti et al. 2018; Laganá et al. 2019; Kadam et al. 2019), we suggest that the ICM motion could have interacted with the fossil plasma mostly in the N-S direction. The motion of the thermal plasma could have enhanced the radio emissivity at the edges of the radio galaxy by compressing the relativistic plasma and producing the bright arcs of the Kite. The compression of radio plasma can efficiently enhance its radio emission by a factor δI of
 (3)
(3)
where x is the compression factor and δ = 2α − 1 is the index of the electron spectrum Ne(E) ∝ Eδ (e.g., Markevitch et al. 2005). In the case of the Kite, by using a power-law spectrum instead of a curved spectrum, we can derive a first-order estimate of the effects of compression. For α < −1.5, hence δ < −4, even a small compression x ≃ 1.2 can result in a significant enhancement δI > 2. At the cold front, where the compression would be more evident, Kadam et al. (2019) measured values of x of 1.57 ± 0.08 and 2.06 ± 0.44, which would correspond to a δI ≃ 6.
The local increase of the magnetic field due to the compression also impacts the spectrum of the emission by shifting the critical frequency of emission of the electrons at higher frequencies. For a curved synchrotron spectrum, as we observe for the Kite in this work, this compression, by moving the break frequency to higher values, can result in a flattening of the observed spectrum. This effect should be more noticeable where the ICM compression, and consequently also IX, is stronger. This is in agreement with the point-to-point analysis (Fig. 4), which shows that the flattening of the spectrum is most evident in the regions with the highest IX, and, thus, it supports a scenario in which the radio emission is driven by the local properties of the thermal ICM.
4.4. Role of the central AGN
The steep spectral index of the arcs and the color-color plot indicates that the arcs were formed after the end of the duty cycle, when the central AGN entered a low-activity state. Indeed IC 5338 does not show properties of AGN emission from the optical (SDSS) or infrared (WISE) photometry. Furthermore, a recent catalog identifying quasars from photometric data in SDSS and WISE indicates that galaxies in A2626 have a very low probability of being quasars (Clarke et al. 2020). However, an AGN coincident with IC 5338 is clearly detected at 144 MHz (Fig. 2). We note at the center of the galaxy there are two compact cores shown in the SDSS image. The core to the SW is coincident with the 1.4 GHz radio emission (right image of Fig. 7) and it exhibits hard X-ray emission (Wong et al. 2008), thus it is likely the host of the AGN. The presence of these two cores in close proximity suggests a merger event had occurred to form IC 5338, and there may be significant ongoing tidal forces between the two cores. Evidence for a merger event helps to provide a mechanisms for the supply and accretion of gas onto the AGN in the SW core (e.g., Ellison et al. 2019, for a recent result).
The spectral index of the AGN (α = −0.8 ± 0.1, Fig. 3) indicates that the supermassive black hole is currently accreting material. Furthermore, at higher frequencies the VLA high-resolution observations presented by Gitti (2013) (Figs. 1 and 7) show the existence of a small (∼8 kpc), jet-like feature leaving the nucleus of the central galaxy and thus confirming that the AGN has entered a new activity phase. The nondetection of an AGN in optical or infrared data hence suggests that it may be obscured by the accretion disk and potentially intra-cluster dust along the line of sight or it may be accreting via a radiatively inefficient mode. Therefore, we cannot exclude that the starting of a new duty cycle by the central AGN could have played a role in the origin of the Kite by launching shocks in the old radio plasma and/or by further compressing the fossil plasma from the inside in the NE-SW direction.
5. Summary and conclusions
We presented the analysis of a LOFAR observation at 144 MHz of the galaxy cluster Abell 2626 and its puzzling central radio source, also known as the Kite. The new LOFAR data have radically changed the general picture of the Kite. We detected new components of the radio emission in the form of plumes located at the ends of the arcs, which almost double the total length of the radio source to ∼220 kpc with respect to the higher frequency images. We combined the new data with the archival datasets at 1.4 GHz and 610 MHz to map the spectral index of the Kite from 144 MHz to 1.4 GHz. We find that the spectral index of the arcs steepens at higher frequencies from α ≃ −1.5 to α < −2 with a steepening trend from their centers to their ends. Then we compared the radio and X-ray emission and we found that the radio plasma fills a putative cavity located beyond the S-W junction of the arcs that is aligned along the major axis of IC 5338. Finally, by performing a point-to-point analysis we found a spatial correlation between the spectral index and X-ray surface brightness, which is a proxy of the local ICM thermal plasma density, where the flattest-spectrum parts of the arcs coincide with the brightest X-ray regions. This result highlights that the properties of the radio emission of the Kite are driven by the local properties of the thermal ICM. On the basis of our findings, we propose that the Kite could be a relic radio galaxy whose lobes have been shaped by the motion of the gas sloshing in the cool core. Specifically, the morphology observed for the first time by LOFAR and the steep spectrum of the lobes (α < −2) suggest that the Kite was originally an X-shaped radio galaxy, likely produced by the back-flow of the radio plasma injected by the AGN that was redirected by the galactic hot ISM along the plumes. The spectral index and the size of the lobes set the lower limit for age of the system between 5 × 10⁷ and 2 × 10⁸ years. The curved radio spectrum and the spatial connection with the cold front suggest that, subsequently after the end of the AGN activity, the fossil radio plasma has been compressed by the ICM motion that locally enhanced the emissivity of the radio arcs and flattened their spectral index. Such a combination of phenomena can also explain its uniqueness among the radio sources because only a very favorable combination of different mechanisms could have resulted in such a spectacular radio source. This scenario can be now tested with tailored numerical simulations, which can explore the physical boundaries of the back-flow and the ICM compression, and future, high-resolution observations at 144 MHz carried out with the LOFAR international stations, which could provide us images of the Kite with a resolution of 0.3″.
Acknowledgments
We thank the referee Chris Reynolds for the suggestions that improved the presentation of this work. AI thanks L. Bruno for useful discussions. This research made use of Astropy, a community-developed core Python package for Astronomy (Astropy Collaboration 2013, 2018), and APLpy, an open-source plotting package for Python (Robitaille & Bressert 2012). G. B. and R. C. acknowledge support from INAF through mainstream program “Galaxy clusters science with LOFAR”. M.J.H. acknowledges support from the UK Science and Technology Facilities Council (ST/R000905/1). RJvW and AB acknowledges support from the VIDI research programme with project number 639.042.729, which is financed by the Netherlands Organisation for Scientific Research (NWO). AOC gratefully acknowledge support from the UK Research & Innovation Science & Technology Facilities Council (UKRI-STFC). GDG acknowledges support from the ERC Starting Grant ClusterWeb 804208. VC acknowledges support from the Alexander von Humboldt Foundation. AMS is supported by the UK’s Alan Turing Institute under Grant 2TAFFP/100012. LOFAR (van Haarlem et al. 2013) is the Low Frequency Array designed and constructed by ASTRON. It has observing, data processing, and data storage facilities in several countries, which are owned by various parties (each with their own funding sources), and that are collectively operated by the ILT foundation under a joint scientific policy. The ILT resources have benefited from the following recent major funding sources: CNRS-INSU, Observatoire de Paris and Université d’Orléans, France; BMBF, MIWF-NRW, MPG, Germany; Science Foundation Ireland (SFI), Department of Business, Enterprise and Innovation (DBEI), Ireland; NWO, The Netherlands; The Science and Technology Facilities Council, UK; Ministry of Science and Higher Education, Poland; The Istituto Nazionale di Astrofisica (INAF), Italy. This research made use of the Dutch national e-infrastructure with support of the SURF Cooperative (e-infra 180169) and the LOFAR e-infra group. The Jülich LOFAR Long Term Archive and the German LOFAR network are both coordinated and operated by the Jülich Supercomputing Centre (JSC), and computing resources on the supercomputer JUWELS at JSC were provided by the Gauss Centre for Supercomputing e.V. (Grant CHTB00) through the John von Neumann Institute for Computing (NIC). This research made use of the University of Hertfordshire high-performance computing facility and the LOFAR-UK computing facility located at the University of Hertfordshire and supported by STFC [ST/P000096/1], and of the Italian LOFAR IT computing infrastructure supported and operated by INAF, and by the Physics Department of Turin university (under an agreement with Consorzio Interuniversitario per la Fisica Spaziale) at the C3S Supercomputing Centre, Italy. We thank the staff of the GMRT that made these observations possible. GMRT is run by the National Centre for Radio Astrophysics of the Tata Institute of Fundamental Research.
References
- Ascasibar, Y., & Markevitch, M. 2006, ApJ, 650, 102 [NASA ADS] [CrossRef] [Google Scholar]
- Astropy Collaboration (Robitaille, T. P., et al.) 2013, A&A, 558, A33 [NASA ADS] [CrossRef] [EDP Sciences] [Google Scholar]
- Astropy Collaboration (Price-Whelan, A. M., et al.) 2018, AJ, 156, 123 [Google Scholar]
- Briggs, D. S., & Cornwell, T. J. 1994, in Very High Angular Resolution Imaging, eds. J. G. Robertson, & W. J. Tango, IAU Symp., 158, 212 [CrossRef] [Google Scholar]
- Bruno, L., Gitti, M., Zanichelli, A., & Gregorini, L. 2019, A&A, 631, A173 [CrossRef] [EDP Sciences] [Google Scholar]
- Cava, A., Bettoni, D., Poggianti, B. M., et al. 2009, A&A, 495, 707 [NASA ADS] [CrossRef] [EDP Sciences] [Google Scholar]
- Cavaliere, A., & Fusco-Femiano, R. 1976, A&A, 49, 137 [NASA ADS] [Google Scholar]
- Churazov, E., Brüggen, M., Kaiser, C. R., Böhringer, H., & Forman, W. 2001, ApJ, 554, 261 [NASA ADS] [CrossRef] [Google Scholar]
- Clarke, T. E., Randall, S. W., Sarazin, C. L., Blanton, E. L., & Giacintucci, S. 2013, ApJ, 772, 84 [NASA ADS] [CrossRef] [Google Scholar]
- Clarke, A. O., Scaife, A. M. M., Greenhalgh, R., & Griguta, V. 2020, A&A, 639, A84 [CrossRef] [EDP Sciences] [Google Scholar]
- Cotton, W. D., Thorat, K., Condon, J. J., et al. 2020, MNRAS, 495, 1271 [CrossRef] [Google Scholar]
- Croston, J. H., Hardcastle, M. J., Harris, D. E., et al. 2005, ApJ, 626, 733 [NASA ADS] [CrossRef] [Google Scholar]
- de Gasperin, F., Dijkema, T. J., Drabent, A., et al. 2019, A&A, 622, A5 [NASA ADS] [CrossRef] [EDP Sciences] [Google Scholar]
- Ellison, S. L., Viswanathan, A., Patton, D. R., et al. 2019, MNRAS, 487, 2491 [NASA ADS] [CrossRef] [Google Scholar]
- Freeman, P., Doe, S., & Siemiginowska, A. 2001, in Proc. SPIE, eds. J. L. Starck, & F. D. Murtagh, SPIE Conf. Ser., 4477, 76 [NASA ADS] [CrossRef] [Google Scholar]
- Gitti, M. 2013, MNRAS, 436, L84 [NASA ADS] [CrossRef] [Google Scholar]
- Gitti, M., Brunetti, G., Feretti, L., & Setti, G. 2004, A&A, 417, 1 [NASA ADS] [CrossRef] [EDP Sciences] [Google Scholar]
- Gitti, M., Brighenti, F., & McNamara, B. R. 2012, Adv. Astron., 2012, 950641 [NASA ADS] [CrossRef] [Google Scholar]
- Hardcastle, M. J., Croston, J. H., Shimwell, T. W., et al. 2019, MNRAS, 488, 3416 [NASA ADS] [CrossRef] [Google Scholar]
- Hodges-Kluck, E. J., & Reynolds, C. S. 2011, ApJ, 733, 58 [NASA ADS] [CrossRef] [Google Scholar]
- Ignesti, A., Gitti, M., Brunetti, G., Feretti, L., & Giovannini, G. 2017, A&A, 604, A21 [NASA ADS] [CrossRef] [EDP Sciences] [Google Scholar]
- Ignesti, A., Gitti, M., Brunetti, G., et al. 2018, A&A, 610, A89 [CrossRef] [EDP Sciences] [Google Scholar]
- Intema, H. T., van der Tol, S., Cotton, W. D., et al. 2009, A&A, 501, 1185 [NASA ADS] [CrossRef] [EDP Sciences] [Google Scholar]
- Intema, H. T., Jagannathan, P., Mooley, K. P., & Frail, D. A. 2017, A&A, 598, A78 [NASA ADS] [CrossRef] [EDP Sciences] [Google Scholar]
- Kadam, S. K., Sonkamble, S. S., Pawar, P. K., & Patil, M. K. 2019, MNRAS, 484, 4113 [CrossRef] [Google Scholar]
- Kale, R., & Gitti, M. 2017, MNRAS, 466, L19 [NASA ADS] [CrossRef] [Google Scholar]
- Katz-Stone, D. M., Rudnick, L., & Anderson, M. C. 1993, ApJ, 407, 549 [NASA ADS] [CrossRef] [Google Scholar]
- Laganá, T. F., Durret, F., & Lopes, P. A. A. 2019, MNRAS, 484, 2807 [NASA ADS] [CrossRef] [Google Scholar]
- Lal, D. V., & Rao, A. P. 2007, MNRAS, 374, 1085 [NASA ADS] [CrossRef] [Google Scholar]
- Leahy, J. P., & Williams, A. G. 1984, MNRAS, 210, 929 [NASA ADS] [CrossRef] [Google Scholar]
- Mandal, S., Intema, H. T., van Weeren, R. J., et al. 2020, A&A, 634, A4 [CrossRef] [EDP Sciences] [Google Scholar]
- Markevitch, M., Govoni, F., Brunetti, G., & Jerius, D. 2005, ApJ, 627, 733 [NASA ADS] [CrossRef] [Google Scholar]
- Morganti, R. 2017, Nat. Astron., 1, 596 [Google Scholar]
- Offringa, A. R., & Smirnov, O. 2017, MNRAS, 471, 301 [NASA ADS] [CrossRef] [Google Scholar]
- Offringa, A. R., McKinley, B., Hurley-Walker, N., et al. 2014, MNRAS, 444, 606 [NASA ADS] [CrossRef] [Google Scholar]
- Poggianti, B. M., Ignesti, A., Gitti, M., et al. 2019, ApJ, 887, 155 [NASA ADS] [CrossRef] [Google Scholar]
- Rizza, E., Loken, C., Bliton, M., et al. 2000, AJ, 119, 21 [NASA ADS] [CrossRef] [Google Scholar]
- Robitaille, T., & Bressert, E. 2012, APLpy: Astronomical Plotting Library in Python (Astrophysics Source Code Library) [Google Scholar]
- Shimwell, T. W., Röttgering, H. J. A., Best, P. N., et al. 2017, A&A, 598, A104 [NASA ADS] [CrossRef] [EDP Sciences] [Google Scholar]
- Shimwell, T. W., Tasse, C., Hardcastle, M. J., et al. 2019, A&A, 622, A1 [NASA ADS] [CrossRef] [EDP Sciences] [Google Scholar]
- Shin, J., Woo, J.-H., & Mulchaey, J. S. 2016, ApJS, 227, 31 [NASA ADS] [CrossRef] [Google Scholar]
- Smirnov, O. M., & Tasse, C. 2015, MNRAS, 449, 2668 [NASA ADS] [CrossRef] [Google Scholar]
- Struble, M. F., & Rood, H. J. 1999, ApJS, 125, 35 [NASA ADS] [CrossRef] [Google Scholar]
- Tasse, C. 2014, A&A, 566, A127 [NASA ADS] [CrossRef] [EDP Sciences] [Google Scholar]
- Tasse, C., Hugo, B., Mirmont, M., et al. 2018, A&A, 611, A87 [NASA ADS] [CrossRef] [EDP Sciences] [Google Scholar]
- van Haarlem, M. P., Wise, M. W., Gunst, A. W., et al. 2013, A&A, 556, A2 [NASA ADS] [CrossRef] [EDP Sciences] [Google Scholar]
- van Weeren, R. J., Williams, W. L., Hardcastle, M. J., et al. 2016, ApJS, 223, 2 [NASA ADS] [CrossRef] [Google Scholar]
- van Weeren, R.J., Shimwell, T. W., Botteon, A., et al. 2020, A&A, submitted [arXiv:2011.02387] [Google Scholar]
- Williams, W. L., van Weeren, R. J., Röttgering, H. J. A., et al. 2016, MNRAS, 460, 2385 [NASA ADS] [CrossRef] [Google Scholar]
- Wong, K.-W., Sarazin, C. L., Blanton, E. L., & Reiprich, T. H. 2008, ApJ, 682, 155 [NASA ADS] [CrossRef] [Google Scholar]
- Zier, C. 2005, MNRAS, 364, 583 [CrossRef] [Google Scholar]
All Figures
|
Fig. 1. Images of the Kite at different frequencies obtained by reprocessing archival datasets. Top left: GMRT image at 610 MHz; the RMS is 120 μJy beam−1 and the resolution is 6.2″ × 4.1″; top right: VLA A+B image at 1.4 GHz; the RMS is 13 μJy beam−1 and the resolution is 1.5″ × 1.4″. In both image the contours are at the −3, 3, 6, 12, and 24σ levels. New images at 144 MHz. Middle: robust = −0.75; the final resolution is 6.7″ × 5.6″ and the RMS is 120 μJy beam−1. The contours are at the −3, 3, 6, 12, 24, 48, 96, 192, 384σ level; bottom left: robust = −2; the final resolution is 4.2″ × 3.2″ and the RMS is 380 μJy beam−1. The contours are at the −3, 3, 6, 12, 24, 48, 96σ level; bottom right: robust = −0.25; the final resolution is 12.2″ × 7.7″ and the RMS is 140 μJy beam−1. The contours are at the −3, 3, 6, 12, 24, 48, 96, 192, 384σ level. The surface brightness is reported in units of Jy beam−1. |
| In the text | |
|
Fig. 2. Sketch of the Kite observed at 144 MHz (Fig. 1, middle panel) color coded for the surface brightness level where we indicate the main components of the radio emission. |
| In the text | |
|
Fig. 3. Spectral index map (left) and relative error map (right) obtained combining LOFAR, GMRT, and VLA maps at 144, 610 MHz and 1.4 GHz, respectively. The resolution is 7″ × 7″. We report the contours at the 3, 6, 12, 24σ levels of the maps used to produce the spectral index map with continuous and dashed lines showing the LOFAR and VLA image, respectively. |
| In the text | |
|
Fig. 4. Spectral index in 610 MHz–1.4 GHz vs. spectral index in 144 MHz–610 MHz band, color coded for the X-ray surface brightness IX. The values were measured in the cells of the green grid that is shown in the top left corner, overlapped on the 3, 24, 96σ levels of the 144 MHz image involved in the spectral analysis. The cells in which the relative error on the spectral index is greater than 50% are shown as upper limits. |
| In the text | |
|
Fig. 5. Comparison of the radio emission with the residual X-ray images produced with Chandra (left) and XMM-Newton (right) in the 0.5–2.0 keV band. Red indicates an excess with respect to the β-model, whereas blue is a deficit. The contours are the 3, 24, 48, 192σ of the image presented in Fig. 1, middle panel. The images are smoothed with a Gaussian filter of 2.5″ for Chandra and 15″ for XMM-Newton. The yellow cross and white mask indicate the position of the AGN of IC 5338 and the galaxy JW100, respectively. The black dashed ellipse indicates the putative position of the cavity. |
| In the text | |
|
Fig. 6. Composite SDSS image of JW100 from bands i, r, and g. The blue-filled contours are 3, 6, 12, 24σ levels of the 1.4 GHz image; the white continuous contours are the 3, 5, 6, 12σ levels of the 144 MHz image (Fig. 1). |
| In the text | |
|
Fig. 7. Left: Chandra X-ray image of A2626 in the 0.5–2.0 keV band with the 3, 24, 96, 200σ level contours of the emission observed at 144 MHz in white (Fig. 1, middle panel) and the 3, 24, 96σ contours of the emission at 1.4 GHz in black (Fig. 1, top right panel). Cyan indicates the position of the cold front observed in Ignesti et al. (2018). Right: composite SDSS image from bands i, r, and g with the 3, 24, 96, 200σ contours of the emission at 144 MHz in silver (Fig. 1, middle panel), the 3, 24, 96σ contours of the emission at 1.4 GHz in cyan (Fig. 1, top right panel) and SDSS composite image smoothed with a Gaussian kernel of standard deviation 1 arcsec at 6, 30, 150 times the RMS noise in the smoothed image (0.015 maggies) in yellow. |
| In the text | |
Current usage metrics show cumulative count of Article Views (full-text article views including HTML views, PDF and ePub downloads, according to the available data) and Abstracts Views on Vision4Press platform.
Data correspond to usage on the plateform after 2015. The current usage metrics is available 48-96 hours after online publication and is updated daily on week days.
Initial download of the metrics may take a while.