Fig. 3.
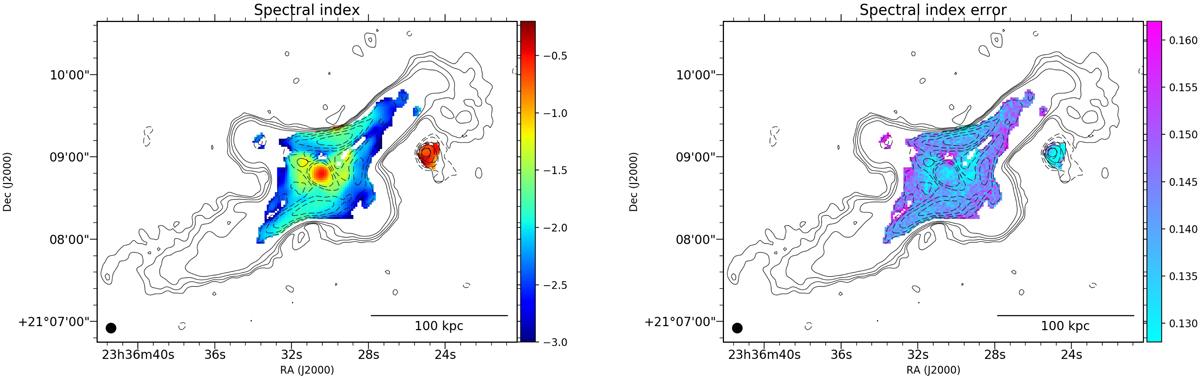
Spectral index map (left) and relative error map (right) obtained combining LOFAR, GMRT, and VLA maps at 144, 610 MHz and 1.4 GHz, respectively. The resolution is 7″ × 7″. We report the contours at the 3, 6, 12, 24σ levels of the maps used to produce the spectral index map with continuous and dashed lines showing the LOFAR and VLA image, respectively.
Current usage metrics show cumulative count of Article Views (full-text article views including HTML views, PDF and ePub downloads, according to the available data) and Abstracts Views on Vision4Press platform.
Data correspond to usage on the plateform after 2015. The current usage metrics is available 48-96 hours after online publication and is updated daily on week days.
Initial download of the metrics may take a while.