Fig. 7.
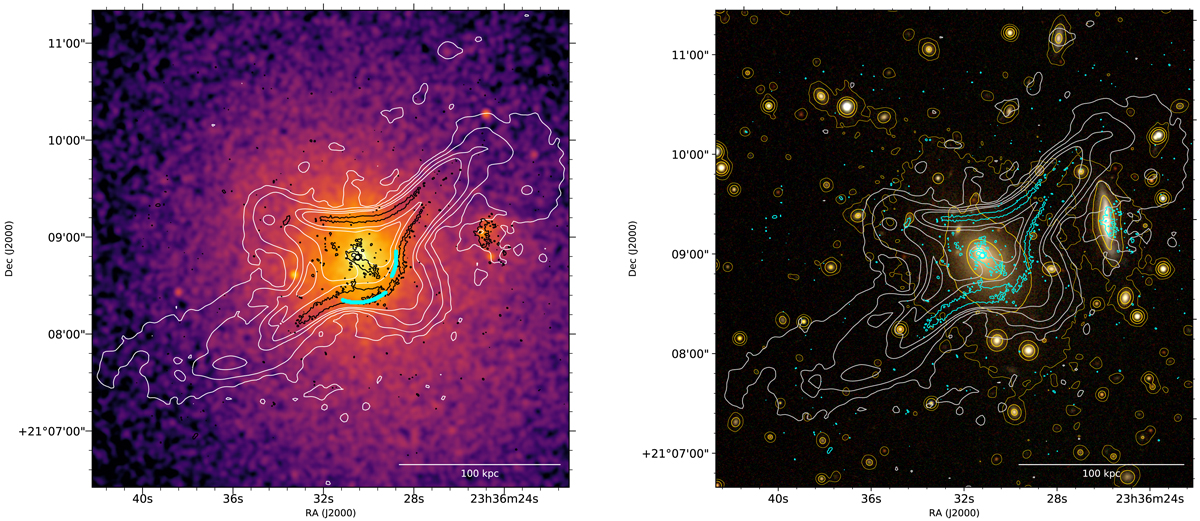
Left: Chandra X-ray image of A2626 in the 0.5–2.0 keV band with the 3, 24, 96, 200σ level contours of the emission observed at 144 MHz in white (Fig. 1, middle panel) and the 3, 24, 96σ contours of the emission at 1.4 GHz in black (Fig. 1, top right panel). Cyan indicates the position of the cold front observed in Ignesti et al. (2018). Right: composite SDSS image from bands i, r, and g with the 3, 24, 96, 200σ contours of the emission at 144 MHz in silver (Fig. 1, middle panel), the 3, 24, 96σ contours of the emission at 1.4 GHz in cyan (Fig. 1, top right panel) and SDSS composite image smoothed with a Gaussian kernel of standard deviation 1 arcsec at 6, 30, 150 times the RMS noise in the smoothed image (0.015 maggies) in yellow.
Current usage metrics show cumulative count of Article Views (full-text article views including HTML views, PDF and ePub downloads, according to the available data) and Abstracts Views on Vision4Press platform.
Data correspond to usage on the plateform after 2015. The current usage metrics is available 48-96 hours after online publication and is updated daily on week days.
Initial download of the metrics may take a while.