Fig. 4.
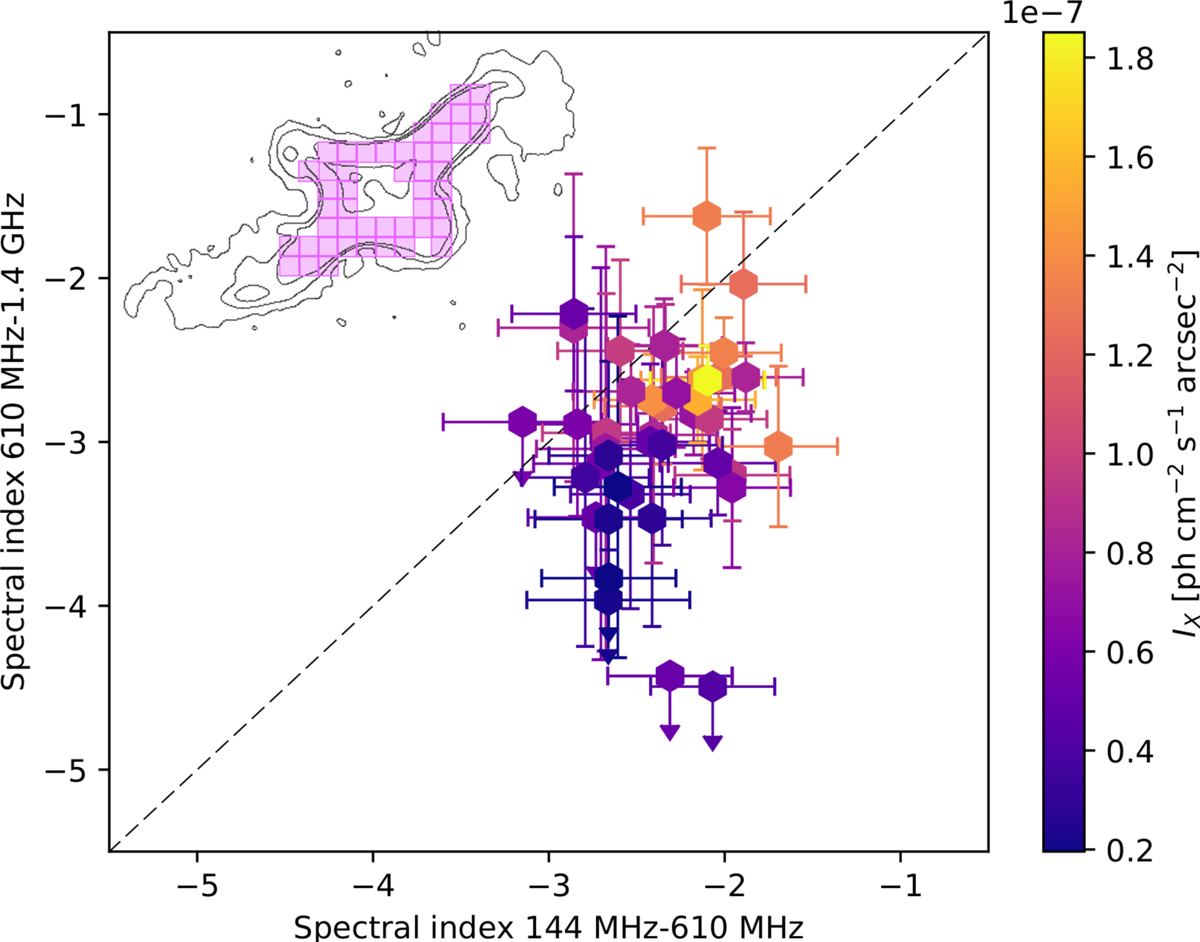
Spectral index in 610 MHz–1.4 GHz vs. spectral index in 144 MHz–610 MHz band, color coded for the X-ray surface brightness IX. The values were measured in the cells of the green grid that is shown in the top left corner, overlapped on the 3, 24, 96σ levels of the 144 MHz image involved in the spectral analysis. The cells in which the relative error on the spectral index is greater than 50% are shown as upper limits.
Current usage metrics show cumulative count of Article Views (full-text article views including HTML views, PDF and ePub downloads, according to the available data) and Abstracts Views on Vision4Press platform.
Data correspond to usage on the plateform after 2015. The current usage metrics is available 48-96 hours after online publication and is updated daily on week days.
Initial download of the metrics may take a while.