Fig. 5.
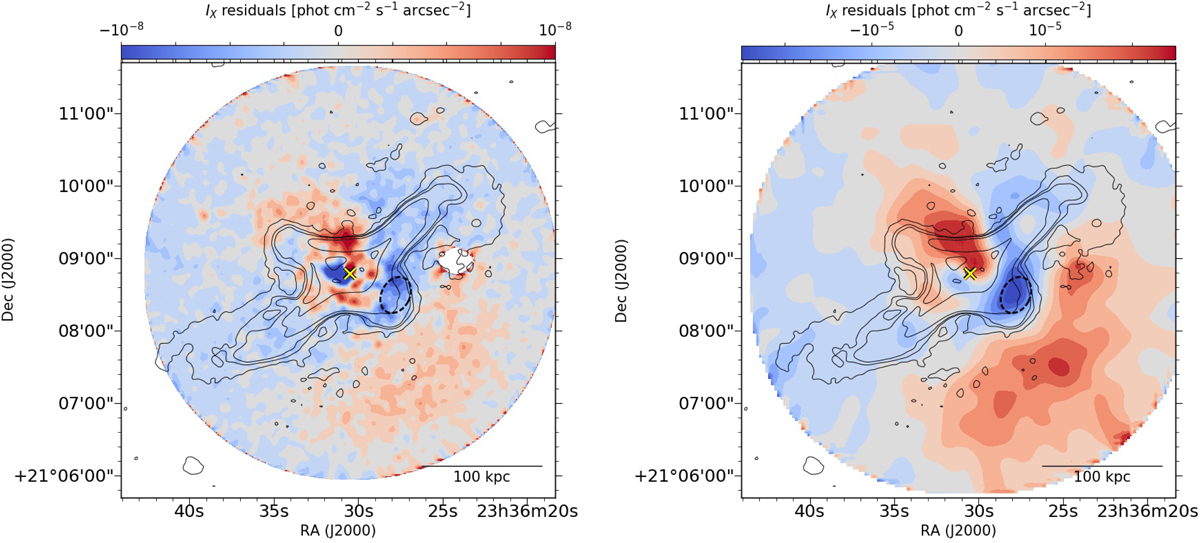
Comparison of the radio emission with the residual X-ray images produced with Chandra (left) and XMM-Newton (right) in the 0.5–2.0 keV band. Red indicates an excess with respect to the β-model, whereas blue is a deficit. The contours are the 3, 24, 48, 192σ of the image presented in Fig. 1, middle panel. The images are smoothed with a Gaussian filter of 2.5″ for Chandra and 15″ for XMM-Newton. The yellow cross and white mask indicate the position of the AGN of IC 5338 and the galaxy JW100, respectively. The black dashed ellipse indicates the putative position of the cavity.
Current usage metrics show cumulative count of Article Views (full-text article views including HTML views, PDF and ePub downloads, according to the available data) and Abstracts Views on Vision4Press platform.
Data correspond to usage on the plateform after 2015. The current usage metrics is available 48-96 hours after online publication and is updated daily on week days.
Initial download of the metrics may take a while.