| Issue |
A&A
Volume 643, November 2020
|
|
|---|---|---|
| Article Number | A120 | |
| Number of page(s) | 9 | |
| Section | Extragalactic astronomy | |
| DOI | https://doi.org/10.1051/0004-6361/202038150 | |
| Published online | 11 November 2020 | |
Dust and gas in the central region of NGC 1316 (Fornax A)
Its origin and nature⋆
1
Departamento de Astronomía, Universidad de Concepción, Concepción, Chile
e-mail: This email address is being protected from spambots. You need JavaScript enabled to view it.
2
European Southern Observatory, Karl-Schwarzschild-Str. 2, 85748 Garching, Germany
3
INAF-Astronomical Observatory of Capodimonte, Via Moiariello 16, Naples 80131, Italy
Received:
11
April
2020
Accepted:
16
September
2020
Abstract
Context. The early-type galaxy NGC 1316, associated with the radio source Fornax A, hosts about 107 M⊙ of dust within a central radius of 5 kpc. These prominent dust structures are believed to have an external origin, which is also a popular interpretation for other dusty early-type galaxies. Moreover, it has been long known that ionised gas is present in NGC 1316, but to date there has been a lack of detailed investigation.
Aims. Our aim is to understand the nature of ionised gas and dust in NGC 1316 and to offer an interpretation for the origin of the dust.
Methods. We use archival Hubble Space Telescope/Advanced Camera for Surveys data to construct colour maps that delineate the dust pattern in detail, and we compare these data with maps constructed with data from the Multi Unit Spectroscopic Explorer (MUSE) instrument of the Very Large Telescope at the European Southern Observatory. Twelve MUSE pointings in wide field mode form a mosaic of the central 3.3 × 2.4 arcmin2. We use the tool PyParadise to fit the stellar population. We use the residual emission lines and the residual interstellar absorption NaI D-lines, and we measure line strengths, the velocity field, and the velocity dispersion field.
Results. The emission lines resemble low-ionisation nuclear emission-line region lines, with [NII] being the strongest line everywhere. Ionising sources are plausibly the post-asymptotic giant branch stars of the old or intermediate-age stellar population. There is a striking match between the dust structures, ionised gas, and atomic gas distributions, the last of which is manifested by interstellar absorption residuals of the stellar NaI D-lines. In the dust-free regions, the interstellar NaI D-lines appear in emission, which is indicative of a galactic wind. The velocity field of the ionised gas (and thus of the dust) is characterised by small-scale turbulent movements that indicate short lifetimes. At the very centre, a bipolar velocity field of the ionised gas is observed, which we interpret as an outflow. The low-velocity part is associated with dust. We identify a strongly inclined gaseous dusty disc along the major axis of NGC 1316. A straight beam of ionised gas with a length of about 4 kpc emanates from the centre.
Conclusions. The dust in NGC 1316 has different origins. Our findings are strongly suggestive of a dusty outflow that is curved along the line-of-sight. Nuclear outflows may be important dust-producing machines in galaxies. Another dusty gaseous component forms a disc that we identify as the predecessor of a central dust lane.
Key words: galaxies: clusters: individual: NGC 1316 / galaxies: elliptical and lenticular, cD / galaxies: ISM / dust, extinction
Based on observations taken at the European Southern Observatory, Cerro Paranal, Chile, under the programme 92.B-0289 (PI: J. Walcher).
© ESO 2020
1. Introduction
The origin of dust in early-type galaxies after some 30 years of cartography (Ebneter & Balick 1985; Goudfrooij et al. 1994; van Dokkum & Franx 1995; Tran et al. 2001; Lauer et al. 2005; Patil et al. 2007; Finkelman et al. 2010) is still a matter of discussion and involves a wide range of physical processes. The best understood dust producers are probably supernovae (SNe; Cherchneff & Sarangi 2017) and asymptotic giant branch (AGB) stars (Dell’Agli et al. 2017). If young stellar populations are lacking, as is the case in early-type galaxies, the dust can be attributed to infall or to other processes such as metal-accretion in the gas phase (Hirashita 1999). A concise introduction to the literature on dust in early-type galaxies is available in Hirashita et al. (2015) and Hirashita & Nozawa (2017).
One of the most conspicuous dust structures in the nearby Universe is found in NGC 1316 (Fornax A), which is located on the outskirts of the Fornax cluster. The dust structures in NGC 1316 are so striking that H. Shapley mistook them for plate defects on old photographic plates (Schweizer 1980; Hodge 1975). NGC 1316 has the reputation of being a merger remnant. Many shells and ripples are reminiscent of previous galaxy interactions and the infall of dwarf galaxies (Mackie & Fabbiano 1998; Richtler et al. 2012a; Iodice et al. 2017).
The dust, with a total mass of about 1−2 × 10⁷ M⊙ (Rémy-Ruyer et al. 2014), has been attributed to infall in all investigations to date. In a comprehensive work on interstellar matter in NGC 1316, Lanz et al. (2010) proposed the infall of an Sc- or Sm-galaxy, in view of the dust-to-gas ratio of a putative merger.
However, a simple look at the dust morphology revealed by Hubble Space Telescope/Advanced Camera for Surveys (HST/ACS) images raises doubts about the dust being brought in by infalling galaxies (see Fig. 1). The radial symmetry is striking, as already noted by Searle (1965) and Schweizer (1980). The outer boundary is a well-defined circle, the two main dust axes point away from the centre, and there are many radial structures among the dusty filaments. Moreover, if the dust has its origin in AGB or SN winds, these young populations should be identifiable; however, the youngest populations have ages of about 1−2 Gyr, with only small contributions from slightly younger populations (Richtler et al. 2012a).
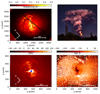 |
Fig. 1. Maps of various components of the ISM in NGC 1316. Upper-left panel: reddening map in B − I based on HST/ACS exposures, the best way to illustrate the dust distribution. We note the spherical shape and the axial symmetry with respect to the centre. The galaxy’s major axis is aligned with the horizontal axis of this image, as are the other NGC 1316 images in this figure. The black line is the chip gap. Upper-right panel: eruption of the Villarica volcano in Chile in March 2015. The morphological similarity triggered us to view the nucleus of NGC 1316 as the main source of dust. Lower-left panel: MUSE mosaic in the light of the [NII]-line 6583 Å, which is the strongest line everywhere. The ionising sources are plausibly AGB stars. We note the close resemblance to the dust distribution. Many details in the dust find their counterparts in the [NII]-structures. Lower-right panel: interstellar absorption line NaI D after Voronoi tessellation and the subtraction of the model galaxy light. Many dust features appear again in this map, demonstrating the quality of this technique as a probe of atomic gas. We note the line emission in those regions that are less obscured by dust. We conclude from the close relation of dust, ionised gas, and atomic gas that gas and dust were never as separated as is normally the case in galaxies: They must come from the same small volume, most probably a nuclear wind. |
Schweizer (1980) detected optical emission lines that indicated the existence of a fast rotating central disc. He also noted the weakness of Hα with respect to [NII], which nowadays is interpreted as post-AGB stars being ionising sources (we discuss this further in Sect. 3.2). The interstellar medium (ISM) of NGC 1316 has been investigated in the mid-infrared (e.g. Lanz et al. 2010; Duah Asabere et al. 2016) through observations of molecular gas at mm wavelengths (Horellou et al. 2001; Morokuma-Matsui et al. 2019) and of the HI 21 cm line (Horellou et al. 2001; Serra et al. 2019). In the optical, new spectroscopic observations with Keck were recently presented by Morokuma-Matsui et al. (2019). In this paper, we will investigate the nature of the ionised gas and its close relation with the dust structures. We will also confirm the explanation from Morokuma-Matsui et al. (2019) for Schweizer’s disc.
We present observational arguments, based on Multi Unit Spectroscopic Explorer (MUSE) data and HST/ACS images, that strongly suggest an internal origin of the major part of the dust within NGC 1316, most probably in a nuclear dusty wind, which would be a new dust production or distribution machine for galaxies. The MUSE data open up a plethora of research lines regarding the analysis of the stellar population, its kinematics and dynamics, and diagnostics of emission lines. We will leave a full account of spectral and kinematic MUSE data to future publications.
Our present scope is a first compact phenomenological description of the new picture and the identification of particularly intriguing features. These phenomena are: the stunning match of the dust distribution with ionised and neutral gas; the gaseous velocity fields; a nuclear outflow; and some radial jet-like features. A new diagnostic tool for neutral gas in early-type galaxies is the use of the NaI D1/D2 lines in absorption and emission.
We adopt the SN type-Ia distance of 17.8 Mpc quoted by Stritzinger et al. (2010), corresponding to a distance modulus of (m − M)0 = 31.25 mag; however, Cantiello et al. (2013) quote a larger distance of 20.8 Mpc. One arcsecond corresponds to 86.3 pc for a distance of 17.8 Mpc.
2. Observations and reductions
NGC 1316 was observed with the MUSE instrument mounted on the Very Large Telescope (VLT) at the European Southern Observatory (ESO) in Cerro Paranal, Chile, under the programme 94.B-0289 (PI: J. Walcher). MUSE is a mosaic of 24 integral field units (IFUs), which covers a field of 1 × 1 arcmin2 in the wide field mode. The pixel scale is 0.2 × 0.2 arcsec2. The spectral resolution varies from R = 2000 at 4700 Å to R = 4000 at 9300 Å, which are the extremes of the spectral range covered. The entire observed field in NGC 1316 is a mosaic of 12 pointings, arranged as 3 × 4 rectangles and centred on the nucleus. The major axis has a position angle of 40°. Each of the 12 fields has been observed twice with exposure times of 150 s each. The data were taken on the nights of 13 December 2014 and 27 December 2014.
2.1. Reduction
The ESO Phase 3 concept offers reduced data products through the ESO science archive. However, by the time this concept became operative, our dataset had been already reduced. The Phase 3 products are not superior to our original reduction, but we want to call attention to the fact that they exist.
The reduction was performed using the pipeline provided by ESO, as described by the pipeline manual version 1.6.2, employing the standard EsoRex recipes. The basic reduction consists of applying muse_bias and muse_flat (no correction for dark currents), followed by the wavelength-calibration with muse_wavecal. The line-spread-function was calculated from the arc spectra using muse_lsf. For the instrument geometry, we used the tables provided by ESO. Twilight exposures were used for the illumination correction, applying muse_twilight. The previous recipes produce tables that were then entered into the recipe muse_scibasic, which performs bias subtraction, flat field correction, wavelength calibration, and more. The recipe muse_scipost performs flux calibration and calculates the final data cube, or, if desired, calculates fully reduced pixtables that are combined by muse_exp_combine to produce a data cube with combined individual exposures. The pipeline also corrects for telluric absorption features. We expected the relative flux uncertainties to be about, or better than, 5%, which was the overall experience (e.g. Weilbacher et al. 2014).
2.2. The Paradise software
This paper deals with emission lines and interstellar absorption and does not investigate the stellar population. However, to isolate emission lines, the spectrum of the galaxy light had to be fitted by population synthesis and subtracted. The best fit is found as a combination of template single stellar population spectra, which, in our case, are models from Bruzual & Charlot (2003). We do that by employing the PyParadise software (Husemann et al. 2016), which is an extended python version of Paradise. Details of the fitting procedure are explained in the appendix of Walcher et al. (2015).
2.3. HST images
We compared the MUSE data with optical HST/ACS images, which cover the central dust features. We made use of the Hubble Legacy archive and the HST datasets hst_9409_01_acs_wfc_f435w_drz.fits and hst_9409_01_acs_wfc_f814w_drz.fits (Proposal number 9409, PI: P. Goudfrooij). These images were taken on 7 March 2003 with exposure times of 1860 s and 4860 s for the filters F435W and F814W, respectively.
3. The large-scale picture
In the following, we present and compare the distribution of three components of the ISM: dust, ionised gas, and neutral gas.
3.1. A central reddening map for NGC 1316
The main dust structures in NGC 1316 are found within a radius of approximately 1 arcmin (5.2 kpc), which can be covered by one HST/ACS field. The best visualisation of the dust against the very bright galaxy background is a reddening map (Fig. 1, upper-left panel). To facilitate the comparison with standard reddening laws, we transformed the ACS photometry into Johnson B − I, for which we used the relations given by Sirianni et al. (2005). The colour between the dust features near the centre varies between 2.1 < B − I < 2.2, but we cannot exclude the existence of structureless dust that causes a small amount of reddening, which is otherwise invisible. We therefore adopted (B − I)0 = 2.0 as the unreddened colour of the central region of NGC 1316 and interpret all deviations to redder colours as reddening caused by dust.
Such a map reveals extremely fine details that cannot be appreciated in a figure like Fig. 1 (upper-left panel), which is needed for comparison with the MUSE mosaic. The central and axial symmetries are striking (which has been noted above). The picture of the eruption of the Villarica volcano in Chile (upper-right panel) shows a stunning morphological similarity to the northern part of the NGC 1316 dust structures. We do not stretch the analogy of the physical processes too much, but it was this picture that first triggered the idea to see the dust in NGC 1316 (or part of it) as being generated in the central region. The dynamics of a volcanic eruption column are driven by the turbulent mixing of the hot volcanic dust (with grain sizes similar to interstellar dust) with the ambient air resulting in a convective thrust, while the dynamics of dusty nuclear outflows are probably governed by radiative transfer (Hönig & Kishimoto 2017). However, structure formation along a dusty wind plausibly depends, in a complicated manner, on the spectrum of particle velocities as well as on particle interaction with the ambient medium (which is hot in the case of NGC 1316) and may be scale-free.
3.2. Morphology and distribution of [NII]
The spectrum shown in Fig. 2 was extracted at 1.5″E and 3.5″N of the optical centre. It shows a metal-rich, old population superimposed with low-ionisation nuclear emission-line region (LINER) emission lines. The spectral appearance is quite homogeneous over the entire field of detectable lines, as well as far from the nucleus in the outer dust structures where the [NII]-intensity is only a factor of 0.0003 of the central intensity. This strongly suggests that the ionising sources are very local. Therefore, the ionising radiation must be provided by post-AGB stars, as is widely acknowledged for early-type galaxies (e.g. Cid Fernandes et al. 2011; Zhang et al. 2017). The [NII]-line at 6583 Å is the strongest line everywhere. We prefer it over Hα as a tracer of ionised gas as it has the additional advantage that the local continuum can be easily subtracted in contrast to Hα, which is embedded in a deep absorption trough.
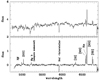 |
Fig. 2. Example spectrum near the centre, 2.6″N, 0.4″E of the nucleus. Upper panel: an old metal-rich galaxy spectrum with a velocity dispersion of about 200 km s−1. The stellar population has been fitted with PyParadise, which enables us to subtract the stellar contribution and leave only the emission lines, which are shown in the lower panel. It is a LINER-like spectrum displaying the typical emission lines, which, in this case, are caused by the radiation field of post-AGB stars. The residual of the Mg b-band is only visible near the centre and is most probably caused by template mismatch. |
The lower-left panel in Fig. 1 shows the [NII]-map of the entire MUSE mosaic using the MONTAGE software. For the mosaic construction, we extracted the [NII]-image with QFitsView1 using the line map option. The original images were rotated anticlockwise by 40° and then cropped. The size of the MUSE mosaic is 3.33 × 2.42′2, corresponding to 17.24 × 12.53 kpc.
The overall extension and similarity with the dust structure is striking. A closer view shows that almost all the [NII]-structures do indeed find their correspondence in the dust distribution to a stunning degree. There are a few exceptions. Most of the [NII]-luminosity comes from the central region but does not resemble the inner dust structure. The [NII]-“cloud” at q ≈ 650, p ≈ 650 has no dusty counterpart but shows NaI D in emission. Additionally, the few little spots in the western part have no dusty counterparts.
It is clear that this is not the relation of dust and gas that is found in star-forming regions in galaxies. Dust (and molecules) indicate the coldest and densest parts of the ISM in a fractal manner, while the emission gas in HII-regions indicates the opposite: lower density, higher temperature, and no star formation. We further conclude that there is no, or very little, ionised gas between the dust structures because the missing shielding would enhance the ionisation rate and would enhance visibility. The close link between the [NII]-emission and the dust also opens up the possibility of studying the dust kinematics (see Sect. 4).
3.3. Two radial features: Disc and jet
In the morphology of the [NII]-map (Fig. 1, lower-left panel), two radial (i.e. emerging from the central region) features are striking. One is a rather broad feature towards the north-east with a position angle of 40°, which coincides with the position angle of the galaxy’s major axis. There might be a counterpart on the south-western side, whose existence is suggested by it kinematics. The reddening map shows that this feature splits into two parallel arms accompanied by dust. Its connection with the centre resembles the base of spiral arms rather than a jet. One also observes here the close match of dust and gas. Its kinematic properties, however, suggest that it might be the debris of a galaxy-scale disc.
The other radial feature points towards the south-west and is much fainter (position angle 200°). Its emission precisely traces a straight line, starting from very near the centre (about 1″) and extending over 3.5 kpc.
There is no indication that the ambient conditions for ionisation are different in any way (see Sect. 3.2). Since such a high degree of collimation is not possible under stellar dynamical conditions with velocity dispersions about 200 km s−1 and differential rotation, this feature suggests the presence of a jet. There is no visible counter jet. Remarkably, there is no connected dust. One further observes that the “jet” is nearly perpendicular to the putative outflow described in Sect. 5. We come back to these features in Sect. 4.
3.4. The NaI D map
As a characterisation of the atomic gas component, we show a map of the interstellar absorption/emission of the NaI D line The interstellar feature becomes visible after subtracting the stellar template spectra via the fitting with PyParadise. In fact, we fitted a Voronoi tessellation with an S/N that depends slightly on the MUSE pointing, typically S/N = 10. The stellar NaI D is one of the strongest absorption lines in a late-type spectrum. We therefore did not expect the template subtraction to leave a residuum that really shows the interstellar absorption (Concas et al. 2017). Here we have a lucky case where the highly structured dust provides proof for the existence of the absorbing medium, which would not be available when dealing with a more diffuse gas distribution. We note the amazing correspondence of structure in spite of the very different spatial resolution. To what level radial velocities and equivalent widths are numerically trustworthy deserves more investigation and is beyond our scope. To our knowledge, this use of the NaI D-line in an early-type galaxy is the first in the literature. The absorption of resonant lines has been discussed extensively in the context of galactic winds (e.g. Veilleux et al. 2005; Rupke & Veilleux 2015; Roberts-Borsani & Saintonge 2019, and references therein).
NaI D in emission indicates resonant scattering in an outflow (Prochaska et al. 2011; Rupke & Veilleux 2015). Resonant scattering is expected to occur in regions of low dust absorption. Indeed, the emission appears outside the dust structure. Striking is the emission of the region at (650,680), where there is [NII]-emission as well, but the dust structure shows a sharp cutoff. The overall picture resembles a cold outflow perpendicular to a disc (to compare with Fig. 1 in Roberts-Borsani & Saintonge 2019). The sketch in Fig. 4 illustrates this scenario.
4. Gas kinematics
The velocity maps for different lines reveal a wealth of details, the discussion of which must be postponed to a future paper with a catalogue character. Here we show the most interesting kinematic details that are important for our conclusions.
4.1. The large scale
Figure 3 shows the velocity map of [NII]6583 for the inner parts of the MUSE mosaic, where [NII] is present. We tend to find higher velocities (with respect to the systemic velocities) in the northern part and lower velocities in the southern part. The highest velocities are found in the most northern section, which may be explained by an outflow that is curved along the line-of-sight. The highest velocities are about 2200 km s−1. This pattern is not obvious in the southern part. Velocities of this amount cannot be of stellar dynamical origin, which provides additional support for an outflow hypothesis Adopting an outflow velocity of 500 km s−1, the corresponding dynamical age is about 107 yr. The only other known object in NCG 1316 that is this young is SH2 (Richtler et al. 2012b). Velocity fields of a smaller scale are superimposed. We show the central part with a higher resolution in the next section.
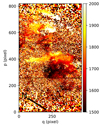 |
Fig. 3. Velocity map of [NII] for the part of the mosaic that contains [NII]-features. The size is 80″ × 164″. North is indicated by the black line. The systemic velocity is 1750 km s−1. The northern parts tend to have higher velocities and the southern parts lower velocities, which fits to a general outflow. The most northern parts are the fastest, which may indicate a curved shape along the line-of-sight. This is less obvious in the southern parts. Other small-scale velocity fields are superimposed. The horizontal structure covering the centre is aligned with the galaxy’s major axis and follows its rotational direction. We therefore identify it with a dusty gas disc that is frequently seen in early-type galaxies. |
4.2. A gaseous disc with dust
The radial structure on the [NII]-map that points towards the north-east (see Fig. 5), where the reddening map reveals a rather inconspicuous double arm structure in the dust, seems to be of a different nature than the bulk of the gas or dust, which defines an axis perpendicular to it. The double arm structure can be seen as an inclined disc or ring, but there are more indications: The direction coincides with the bulge major axis, and the velocities match the projected bulge velocities in the central region but deviate outwards. This is expected for a rotating disc because the mean line-of-sight velocity of the rotating stellar bulge becomes lower than that of the rotating disc as its radius increases towards the north-east (and higher as its radius increases towards the south-west). The velocity structure is symmetric with respect to the centre. However, the south-western part of the disc is disturbed by the dust and gas, probably coming from the centre.
The inclination can only be determined with some uncertainty because the disc itself is not well defined. We estimate the maximal north-east extension on the [NII]-map to be 30″ and the width to be 6″, corresponding to an inclination angle of 78°. Trying to find the highest outermost measurable radial velocity of [NII] on the north-eastern side, we find 1950 ± 20 km s−1 at a projected distance of 3.3 kpc. We therefore have vrot = 200 ± 20 km s−1, corresponding to 3.2 × 10¹⁰ M⊙. This is much lower than the expected value. Our luminosity model from Richtler et al. (2012a) demands 9.6 × 10¹⁰ M⊙ with M/LR = 2.5, which would be characteristic of an intermediate-age population. This conflict probably means that either the highest [NII]-velocity is not the circular velocity or that the true inclination is lower. Solving this disagreement will require a more detailed dynamical investigation, including an investigation of the stellar population. It is suggestive to consider this disc as a young version of the central dust lanes that are frequently observed in early-type galaxies. The mere existence of a disc requires that its age is at least a few orbital periods, which at 3.3 kpc and with 3.2 × 10¹⁰ M⊙ is 0.1 Gyr. Therefore, the disc must be much older than the perpendicular structure (see next section).
We note that an NaI D absorption is not visible, which is another difference. This may indicate a purely molecular gas disc. In the CO map of Morokuma-Matsui et al. (2019; their Fig. 5), their “extended” region appears to have the correct position angle and can perhaps be identified with the south-eastern part of our disc, but it appears to be too far to the south. The north-eastern part is not detected. The possibility remains that there is no cold gas at all and that the disc is completely ionised.
The disc that we describe here is not the disc found by Schweizer (1980), which rotates along the minor axis with a much higher velocity. We can only suspect that the general north-south velocity pattern created the impression of a rotating disc when observed with spectroscopic long slits. Further discussion on this is presented in Sect. 4.4.
Figure 4 illustrates our scenario as viewed from the west onto an inclined dusty disc as well as a bipolar-structured turbulent outflow, which is curved. The observer looks from the “left” and sees in projection what may be misinterpreted as an edge-on disc that is blueshifted in the south and redshifted in the north.
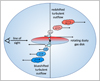 |
Fig. 4. Observer’s perception of a bipolar, turbulent, and curved outflow. The blueshift in the south and the redshift in the north give the impression of a rotating disc seen edge-on. |
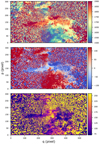 |
Fig. 5. Kinematics of the central region of NGC 1316. The regions have sizes of 80″ × 30″. The orientation is the same as in Fig. 3. The nucleus is at p = 138, q = 326. Upper panel: [NII]6583 velocities for the two central fields. Conspicuous is the horizontal feature with kinematical properties that resemble the bulge rotation. Middle panel: map of the difference “stellar velocities minus [NII]”: horizontal feature follows the direction of the bulge’s rotation. This strongly suggests the existence of a dusty gas disc. Lower panel: velocity dispersion of the [NII]6583 line. The mere dispersion values may hide complicated velocity structures changing on very small scales. |
4.3. Velocity dispersion and lifetimes
For the evaluation of the velocity dispersion map of [NII], it is important to realise that the width of the [NII]-line, if fitted by a simple Gaussian, cannot reproduce the true velocity dispersion field that is characterised by small-scale variations and multiple components. Figure 6 gives an impression. The velocity dispersion can reach values higher than 200 km s−1. These structures are, of course, not bound and will disperse rapidly. An order-of-magnitude estimation of the dissolution time scale is tdiss ≈ R/σ, with R being a characteristic radius and σ the velocity dispersion. With R = 500 pc and σ = 200 km s−1, tdiss = 2.4 × 10⁶ yr. This is about 40 times lower than the orbital period at a radius of 3.3 kpc.
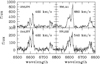 |
Fig. 6. Four examples of multi-component velocity fields in the emission lines after subtracting the model fits of the stellar population. The spectral range includes, from left to right: [NII]6549, Hα, [NII]6583, [SII]6717, and [SII]6731. The pixel coordinates are given. The velocity dispersion values refer to [NII]6583 but should be equal for all lines. We suggest that such velocity fields emerge in outflows. |
4.4. Comparison with molecules
The recent work of Morokuma-Matsui et al. (2019), using data from ALMA and Keck, enables an illustrative comparison of our results with the distribution of molecules and their kinematics. Morokuma-Matsui et al. (2019) present intensity and kinematic maps of CO with a spatial resolution of 16″, covering an area similar to our MUSE mosaic. Their maps do not resolve the dust structures in detail, but they do identify four “clumps” of CO emission, which closely resembles a strongly blurred dust map, including the dust structure located about 20″ south-west of the centre. A detailed comparison with our Fig. 3 is not possible either, but the overall tendency of high velocities in the north and low velocities in the south is reproduced. A long-slit spectrum, taken with the Low Resolution Imaging Spectrometer (LRIS) at the Keck telescope, provides better spatial resolution but less precise velocities along the “dust axis”, which is identified with Schweizer’s disc. It confirms what is known from the kinematics of the molecular gas. Our disc, described in Sect. 4.2, is not visible on the CO maps. It is interesting that the velocity dispersion of CO is mostly very low, about 50 km s−1, although their velocity resolution should resolve the kinematic substructure, which is visible in the [NII]-lines. They conclude that the complexity of the velocity field does not support a simple rotation, and they favour a scenario where individual movements of gas blobs are superimposed onto a rotational movement. Such a scenario is obviously not viable within our present context. Our interpretation of the Morokuma-Matsui et al. (2019) observation is that it is a low-scale molecular outflow. Molecular outflows have been identified in many galaxies (see Lutz et al. 2020 for recent work and literature compilation), with outflow rates of up to several hundred solar masses per year. A rough estimation with an outflow mass of 3.6 × 10⁸ M⊙ (the Morokuma-Matsui et al. 2019 molecular mass), an outflow radius of 5 kpc, and an adopted outflow velocity of 500 km s−1 gives 588 M⊙ yr−1, applying Eq. (3) from Lutz et al. (2020), which assumes sphericity. The outflow in NGC 1316 happens in a narrow cone. Adopting 20° for the opening angle, a factor of 0.01 gives about 5 M⊙ yr−1.
4.5. Comparison with HI
After previous failed attempts to detect HI in the central region of NGC 1316 (e.g. Horellou et al. 2001), Serra et al. (2019) succeeded in finding central HI using observations with MeerKAT. The very centre still appears devoid of HI, but there are two separate HI-clouds very close to the centre that appear in Table 2 of Serra et al. (2019) as “NGC 1316” and are quoted with an HI-mass of 4.3 × 10⁷ M⊙. The exact coordinates of the two components are not given; therefore, we cannot give a convincing correspondence to features in [NII] or NaD I. However, the northern component has a higher radial velocity than the southern component, and they therefore fit the general outflow scheme.
Nevertheless, the very centre hosts atomic gas, as indicated by NaI D. An answer to the question of why this gas is not seen in HI is beyond the scope of this work. Without making a strong claim, we suspect that the local velocity dispersion of HI is so high that the emission is diluted over too many MeerKAT channels and drops below the detection limit for a single channel. For comparison, the [NII]-velocity dispersion in this region reaches values higher than 200 km s−1.
A further observation is that the disc is not seen in HI. This corroborates the assumption that it is also not visible in NaI D.
Serra et al. (2019) find more HI emission outside the central region. This, among other sources, confirms the presence of HI in the star-forming region SH2 (Schweizer 1980; Richtler et al. 2017).
5. The central region
The centre is a particularly interesting region. The nucleus (or what we think is the nucleus) itself is not hidden but appears in the optical as a point source, slightly bluer than its environment by ΔB − I ≈ 0.2. Deprojecting the spherical galaxy model of Richtler et al. (2014), and adopting 5 pc as the emission radius, one needs about a factor of 30, or 3.7 mag, of brightening in B to achieve that colour shift. This is not explainable by a population colour, only by non-thermal emission, so one may speak of a weakly active nucleus. The upper-left panel of Fig. 7 shows the central [NII]-emission. The star symbol indicates the location of the nucleus. Although the bulk of the [NII]-emission seems shifted towards the north-east, the locations of the peak emission of [NII] and the optical are not distinguishable on the scale of the MUSE data. The central [NII]-velocity map is shown in the upper-right panel. The cone-like velocity feature is striking, showing a low-velocity part on the south-eastern side and a high-velocity part on the north-western side. Figure 8 shows an extraction of velocities, using a 3 pixel-wide slit with a position angle of 315° passing through the kinematical centre to which the zero-point corresponds. We interpret this feature as an outflow rather than a disc. The intensity map does not show a corresponding disc-like structure. One also observes more high-velocity gas nearby, which does not correspond to a putative disc-like structure and may come from previous outflows. As seen in Fig. 8, the radial velocity curve is not very symmetric with respect to the centre.
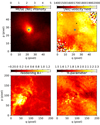 |
Fig. 7. Central region of NGC 1316 under various aspects. The images cover 10 × 10 arcsec2, corresponding to 863 × 863 pc2. The optical centre is indicated by green star symbols in the two upper panels. Upper-left panel: [NII]-map. Flux units are 1017 erg s cm2 Å. The [NII]-luminosity is strongly concentrated in the centre, but the emission is asymmetric, with an extension towards the north-east. Upper-right panel: [NII]-velocity map. A remarkable structure is visible, which we interpret as an outflow. The green star indicates that the “kinematical centre” is offset from the optical centre by about 1″ (corresponding to 86 pc in projection). Lower-left panel: reddening map in the very centre, which visualises the dust. The nucleus is the blue point source at p = 100, q = 100. The dusty cone-like region coincides with the approaching part of the outflow, while no dust seems to be connected with the receding part; this may be explained by a faint background. Lower-right panel: map of the R-parameter from Eq. (1). A well-defined value is R = 1.85. One observes tiny spots indicating higher R-values and higher absorption. We speculate that these spots may be pockets of efficient grain growth. |
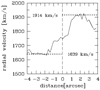 |
Fig. 8. Extraction of the velocities along the cone-like velocity feature that is seen in the upper-right panel of Fig. 7. The zero-point is the kinematical centre. We interpret this feature as an outflow. |
The kinematical centre is offset from the optical centre by about 1″ to the south. This means, in the case of a disc, that the centre-of-mass would not coincide with the nuclear point source.
Only the low-velocity feature coincides with the cone-like dust structure visible in the lower-left panel; there is no correspondence with dust on the high-velocity side. We suggest the explanation that the low-velocity flow is directed towards the observer in the foreground of the centre, while the dust in the opposite direction does not have the bright background needed to be visible as an absorbing screen.
6. The reddening law
Interesting findings come from considering the reddening law of the dust in NGC 1316. The reddening law is written in the form
 (1)
(1)
Using the reddening map, we constructed a map of R-values that, according to Eq. (1), can “correct” for the dust, in the sense that multiplying this map with the original image allows the dust structure to disappear. It is not self-evident that such a uniform R-value exists, given the appreciable range of RV-values in the Milky Way (e.g. Fitzpatrick 1999), but it does exist. A value of RF435W = 1.85 almost completely removes the dust structure. Given that R-values in the Milky Way fill an interval 2.5 < RV < 4, depending on the Galactic positions of reddening probes, it is striking that the dust is so homogenous. The Galactic value for the F435W-filter is 1.6 (Fitzpatrick 1999).
The absorption values are not very high, with maxima of about 0.8 mag. The corrected image was modelled with ellipse under IRAF; the image was also divided by this to make small residuals visible. We calculated a map
 (2)
(2)
in which tiny residuals from the applied R-value also become visible. The central region of this map is shown in the lower-right panel of Fig. 7. The elliptical model is not perfect but leaves some structural residuals, in particular the disc-like structure of the inner isophotes.
Although R = 1.85 is precisely defined, there are small-scale spots where R-values are higher by a small amount. These spots are by no means artefacts: The same structures emerge when other ACS filters are used (for the sake of brevity, we do not show this). Moreover, the distribution of these little patches is not random: They prefer the highest local absorption. The lower-right panel of Fig. 7 shows the central region as a particularly interesting zone. The small spots are clearly related to the dusty outflow. The high number of spots becomes understandable if the line-of-sight forms a small angle with the axis of the putative outflow and thus samples a large volume. Larger R-values may indicate larger dust grains. In combination with the association of higher absorption, it is tempting to speculate that these spots are pockets of higher gas density and a more effective dust formation by grain growth from the ISM (e.g. Zhukovska et al. 2008; Hirashita et al. 2015). We remark that elevated R-values do not necessarily mean larger dust grain sizes. One could also think of unresolved lines-of-sight in which the absorption assumes very high values, for example in molecular cloud cores. This problem cannot, of course, be attacked with our data; it needs ALMA observations.
7. Summary and conclusions
We present initial, intriguing results from analysing a mosaic of 12 MUSE fields of the inner region of NGC 1316 (Fornax A). As a pilot study, we concentrated on a few striking phenomena in combination with archival HST/ACS imaging.
Our main findings are as follows. The LINER-like line emission with the [NII]6583 Å as the strongest line exhibits similar line-strength ratios independent from the local line luminosity, which strongly suggests post-AGB stars to be the sources of ionisation. Line emission is strongly concentrated in the centre. The fainter line emission at larger radii matches the shape of the dust features in detail, indicating that there is little ionised gas outside the dust pattern.
The global [NII]-velocity pattern is best understood by a galaxy-wide outflow where at least the northern part is curved along the line-of-sight. Near the centre, the outflow vector is almost tangential, becoming more radial (i.e. having higher radial velocities) at larger distances.
We generated a map of the interstellar NaI D absorption that emerges after modelling and the subtraction of the stellar galaxy light. Stunningly, the neutral gas distribution also follows many dust patches in detail. Methodologically, our study shows, for the first time, that NaI residuals of early-type stellar populations are indeed useful for detecting cold gas. We also see NaI D emission at the northern and southern borders of the dust pattern, illustrating models of resonant line emission in a galactic wind. The close match of both ionised gas and neutral gas with dust strongly argues for the fact that dust and gas were never separated and, thus, for a common origin inside a small volume. This must be the nuclear region. The velocity dispersion of the gas tracing the dust structures indicates a short lifetime; therefore, conventionally discussed dust formation scenarios in AGB stars and SNe are not viable. Instead, we propose dust formation in a nuclear outflow.
However, this is valid only for the dust distribution that defines an axis perpendicular to the major axis of the bulge. A second dust component, striking in an [NII]-map as a radial feature, defines an axis along the major axis of the bulge. [NII] shows a low-velocity dispersion and a velocity pattern that agrees with the bulge’s rotation. Interestingly, no NaI D absorption is visible. We interpret this feature as a central disc-like structure analogous to the central dust lanes in elliptical galaxies.
A straight radial [NII]-feature of a projected length of about 4 kpc, not connected with dust, seems to trace a jet that itself is not visible in the optical. The [NII]-velocity map of the central region indeed shows a bimodal outflow pattern with a projected velocity of approximately 200 km s−1, which coincides with a central dust structure. From HST/ACS images, we constructed a map of the R-parameter in the reddening law. The reddening is very homogeneous, in contrast to the Galactic law, but shows tiny patches with R-values that are slightly higher than the environmental R-values. They are not visible on the reddening map. We suggest that these features are unresolved molecular cloud cores with high absorption. We note that apparent stellar sodium abundances and sodium abundance gradients may be questioned in the presence of interstellar atomic sodium (Sarzi et al. 2018).
If dust production is a part of nuclear activity, one would expect to see this in other galaxies as well. The first morphological test is to use high resolution archival images to check whether a dust pattern or filament is connected with the nucleus. This is an easy task. We encourage others to do this test with, for example, NGC 1022, 1459, 1700, 4150, 4589, and 5102. The last galaxy is a particularly convincing case (Richtler et al., in prep.). Even the small dust filament that emanates from the nucleus of M87 has apparently remained unnoticed despite the prominence of the nucleus (Sparks et al. 1993).
QFitsView was developed at the Max-Planck-Institut for Extraterrestrial Physics by Thomas Ott and Alex Agudo Berbel.
Acknowledgments
We thank the anonymous referee for a constructive report. Without Bernd Husemann and his help to use PyParadise, this paper would not have been written. TR acknowledges support from the BASAL Centro de Astrofísica y Tecnologias Afines (CATA) PFB-06/2007. This work has emerged from TR’s visits at ESO/Garching under the ESO science visitor programme. We thank Jakob Walcher for giving access to the reduced MUSE data prior to the advent of ESO phase 3 products. TR thanks the Astronomisches Institut der Ruhr-Universität Bochum for hospitality and computer time. TR thanks Johanna Hartke for discussions and help with matplotlib. This research made use of Montage. It is funded by the National Science Foundation under Grant Number ACI-1440620, and was previously funded by the National Aeronautics and Space Administration’s Earth Science Technology Office, Computation Technologies Project, under Cooperative Agreement Number NCC5-626 between NASA and the California Institute of Technology.
Note added in proof. We thank Paul Goudfrooij for pointing out that the “template mismatch” in Fig. 2 rather is the [NI] doublet at 5199 Å (Goudfrooij & Emsellem 1996).
References
- Bruzual, G., & Charlot, S. 2003, MNRAS, 344, 1000 [NASA ADS] [CrossRef] [Google Scholar]
- Cantiello, M., Grado, A., Blakeslee, J. P., et al. 2013, A&A, 552, A106 [NASA ADS] [CrossRef] [EDP Sciences] [Google Scholar]
- Cherchneff, I., & Sarangi, A. 2017, in The B[e] Phenomenon: Forty Years of Studies, eds. A. Miroshnichenko, S. Zharikov, D. Korčáková, & M. Wolf, ASP Conf. Ser., 508, 57 [Google Scholar]
- Cid Fernandes, R., Stasińska, G., Mateus, A., & Vale Asari, N. 2011, MNRAS, 413, 1687 [NASA ADS] [CrossRef] [Google Scholar]
- Concas, A., Popesso, P., Brusa, M., et al. 2017, A&A, 606, A36 [NASA ADS] [CrossRef] [EDP Sciences] [Google Scholar]
- Dell’Agli, F., García-Hernández, D. A., Schneider, R., et al. 2017, MNRAS, 467, 4431 [NASA ADS] [CrossRef] [Google Scholar]
- Duah Asabere, B., Horellou, C., Jarrett, T. H., & Winkler, H. 2016, A&A, 592, A20 [NASA ADS] [CrossRef] [EDP Sciences] [Google Scholar]
- Ebneter, K., & Balick, B. 1985, AJ, 90, 183 [NASA ADS] [CrossRef] [Google Scholar]
- Finkelman, I., Brosch, N., Funes, J. G., Kniazev, A. Y., & Väisänen, P. 2010, MNRAS, 407, 2475 [NASA ADS] [CrossRef] [Google Scholar]
- Fitzpatrick, E. L. 1999, PASP, 111, 63 [NASA ADS] [CrossRef] [Google Scholar]
- Goudfrooij, P., & Emsellem, E. 1996, A&A, 306, L45 [NASA ADS] [Google Scholar]
- Goudfrooij, P., de Jong, T., Hansen, L., & Norgaard-Nielsen, H. U. 1994, MNRAS, 271, 833 [NASA ADS] [CrossRef] [Google Scholar]
- Hirashita, H. 1999, ApJ, 510, L99 [NASA ADS] [CrossRef] [Google Scholar]
- Hirashita, H., & Nozawa, T. 2017, Planet. Space Sci., 149, 45 [CrossRef] [Google Scholar]
- Hirashita, H., Nozawa, T., Villaume, A., & Srinivasan, S. 2015, MNRAS, 454, 1620 [NASA ADS] [CrossRef] [Google Scholar]
- Hodge, P. W. 1975, Sky Telesc., 49, 354 [Google Scholar]
- Hönig, S. F., & Kishimoto, M. 2017, ApJ, 838, L20 [NASA ADS] [CrossRef] [Google Scholar]
- Horellou, C., Black, J. H., van Gorkom, J. H., et al. 2001, A&A, 376, 837 [NASA ADS] [CrossRef] [EDP Sciences] [Google Scholar]
- Husemann, B., Bennert, V. N., Scharwächter, J., Woo, J.-H., & Choudhury, O. S. 2016, MNRAS, 455, 1905 [NASA ADS] [CrossRef] [Google Scholar]
- Iodice, E., Spavone, M., Capaccioli, M., et al. 2017, ApJ, 839, 21 [NASA ADS] [CrossRef] [Google Scholar]
- Lanz, L., Jones, C., Forman, W. R., et al. 2010, ApJ, 721, 1702 [NASA ADS] [CrossRef] [Google Scholar]
- Lauer, T. R., Faber, S. M., Gebhardt, K., et al. 2005, AJ, 129, 2138 [NASA ADS] [CrossRef] [Google Scholar]
- Lutz, D., Sturm, E., Janssen, A., et al. 2020, A&A, 633, A134 [NASA ADS] [CrossRef] [EDP Sciences] [Google Scholar]
- Mackie, G., & Fabbiano, G. 1998, AJ, 115, 514 [NASA ADS] [CrossRef] [Google Scholar]
- Morokuma-Matsui, K., Serra, P., Maccagni, F. M., et al. 2019, PASJ, 71, 85 [NASA ADS] [CrossRef] [Google Scholar]
- Patil, M. K., Pandey, S. K., Sahu, D. K., & Kembhavi, A. 2007, A&A, 461, 103 [NASA ADS] [CrossRef] [EDP Sciences] [Google Scholar]
- Prochaska, J. X., Kasen, D., & Rubin, K. 2011, ApJ, 734, 24 [NASA ADS] [CrossRef] [Google Scholar]
- Rémy-Ruyer, A., Madden, S. C., Galliano, F., et al. 2014, A&A, 563, A31 [NASA ADS] [CrossRef] [EDP Sciences] [Google Scholar]
- Richtler, T., Bassino, L. P., Dirsch, B., & Kumar, B. 2012a, A&A, 543, A131 [NASA ADS] [CrossRef] [EDP Sciences] [Google Scholar]
- Richtler, T., Kumar, B., Bassino, L. P., Dirsch, B., & Romanowsky, A. J. 2012b, A&A, 543, L7 [NASA ADS] [CrossRef] [EDP Sciences] [Google Scholar]
- Richtler, T., Hilker, M., Kumar, B., et al. 2014, A&A, 569, A41 [NASA ADS] [CrossRef] [EDP Sciences] [Google Scholar]
- Richtler, T., Husemann, B., Hilker, M., et al. 2017, A&A, 601, A28 [NASA ADS] [CrossRef] [EDP Sciences] [Google Scholar]
- Roberts-Borsani, G. W., & Saintonge, A. 2019, MNRAS, 482, 4111 [NASA ADS] [Google Scholar]
- Rupke, D. S. N., & Veilleux, S. 2015, ApJ, 801, 126 [Google Scholar]
- Sarzi, M., Spiniello, C., La Barbera, F., Krajnović, D., & van den Bosch, R. 2018, MNRAS, 478, 4084 [NASA ADS] [CrossRef] [Google Scholar]
- Schweizer, F. 1980, ApJ, 237, 303 [NASA ADS] [CrossRef] [Google Scholar]
- Searle, L. 1965, Nature, 207, 1282 [CrossRef] [Google Scholar]
- Serra, P., Maccagni, F. M., Kleiner, D., et al. 2019, A&A, 628, A122 [NASA ADS] [CrossRef] [EDP Sciences] [Google Scholar]
- Sirianni, M., Jee, M. J., Benítez, N., et al. 2005, PASP, 117, 1049 [Google Scholar]
- Sparks, W. B., Ford, H. C., & Kinney, A. L. 1993, ApJ, 413, 531 [NASA ADS] [CrossRef] [Google Scholar]
- Stritzinger, M., Burns, C. R., Phillips, M. M., et al. 2010, AJ, 140, 2036 [NASA ADS] [CrossRef] [Google Scholar]
- Tran, H. D., Tsvetanov, Z., Ford, H. C., et al. 2001, AJ, 121, 2928 [NASA ADS] [CrossRef] [Google Scholar]
- van Dokkum, P. G., & Franx, M. 1995, AJ, 110, 2027 [NASA ADS] [CrossRef] [Google Scholar]
- Veilleux, S., Cecil, G., & Bland-Hawthorn, J. 2005, ARA&A, 43, 769 [Google Scholar]
- Walcher, C. J., Coelho, P. R. T., Gallazzi, A., et al. 2015, A&A, 582, A46 [NASA ADS] [CrossRef] [EDP Sciences] [Google Scholar]
- Weilbacher, P. M., Streicher, O., Urrutia, T., et al. 2014, in The MUSE Data Reduction Pipeline: Status after Preliminary Acceptance Europe, eds. N. Manset, & P. Forshay, ASP Conf. Ser., 485, 451 [Google Scholar]
- Zhang, K., Yan, R., Bundy, K., et al. 2017, MNRAS, 466, 3217 [NASA ADS] [CrossRef] [Google Scholar]
- Zhukovska, S., Gail, H. P., & Trieloff, M. 2008, A&A, 479, 453 [NASA ADS] [CrossRef] [EDP Sciences] [Google Scholar]
All Figures
|
Fig. 1. Maps of various components of the ISM in NGC 1316. Upper-left panel: reddening map in B − I based on HST/ACS exposures, the best way to illustrate the dust distribution. We note the spherical shape and the axial symmetry with respect to the centre. The galaxy’s major axis is aligned with the horizontal axis of this image, as are the other NGC 1316 images in this figure. The black line is the chip gap. Upper-right panel: eruption of the Villarica volcano in Chile in March 2015. The morphological similarity triggered us to view the nucleus of NGC 1316 as the main source of dust. Lower-left panel: MUSE mosaic in the light of the [NII]-line 6583 Å, which is the strongest line everywhere. The ionising sources are plausibly AGB stars. We note the close resemblance to the dust distribution. Many details in the dust find their counterparts in the [NII]-structures. Lower-right panel: interstellar absorption line NaI D after Voronoi tessellation and the subtraction of the model galaxy light. Many dust features appear again in this map, demonstrating the quality of this technique as a probe of atomic gas. We note the line emission in those regions that are less obscured by dust. We conclude from the close relation of dust, ionised gas, and atomic gas that gas and dust were never as separated as is normally the case in galaxies: They must come from the same small volume, most probably a nuclear wind. |
| In the text | |
|
Fig. 2. Example spectrum near the centre, 2.6″N, 0.4″E of the nucleus. Upper panel: an old metal-rich galaxy spectrum with a velocity dispersion of about 200 km s−1. The stellar population has been fitted with PyParadise, which enables us to subtract the stellar contribution and leave only the emission lines, which are shown in the lower panel. It is a LINER-like spectrum displaying the typical emission lines, which, in this case, are caused by the radiation field of post-AGB stars. The residual of the Mg b-band is only visible near the centre and is most probably caused by template mismatch. |
| In the text | |
|
Fig. 3. Velocity map of [NII] for the part of the mosaic that contains [NII]-features. The size is 80″ × 164″. North is indicated by the black line. The systemic velocity is 1750 km s−1. The northern parts tend to have higher velocities and the southern parts lower velocities, which fits to a general outflow. The most northern parts are the fastest, which may indicate a curved shape along the line-of-sight. This is less obvious in the southern parts. Other small-scale velocity fields are superimposed. The horizontal structure covering the centre is aligned with the galaxy’s major axis and follows its rotational direction. We therefore identify it with a dusty gas disc that is frequently seen in early-type galaxies. |
| In the text | |
|
Fig. 4. Observer’s perception of a bipolar, turbulent, and curved outflow. The blueshift in the south and the redshift in the north give the impression of a rotating disc seen edge-on. |
| In the text | |
|
Fig. 5. Kinematics of the central region of NGC 1316. The regions have sizes of 80″ × 30″. The orientation is the same as in Fig. 3. The nucleus is at p = 138, q = 326. Upper panel: [NII]6583 velocities for the two central fields. Conspicuous is the horizontal feature with kinematical properties that resemble the bulge rotation. Middle panel: map of the difference “stellar velocities minus [NII]”: horizontal feature follows the direction of the bulge’s rotation. This strongly suggests the existence of a dusty gas disc. Lower panel: velocity dispersion of the [NII]6583 line. The mere dispersion values may hide complicated velocity structures changing on very small scales. |
| In the text | |
|
Fig. 6. Four examples of multi-component velocity fields in the emission lines after subtracting the model fits of the stellar population. The spectral range includes, from left to right: [NII]6549, Hα, [NII]6583, [SII]6717, and [SII]6731. The pixel coordinates are given. The velocity dispersion values refer to [NII]6583 but should be equal for all lines. We suggest that such velocity fields emerge in outflows. |
| In the text | |
|
Fig. 7. Central region of NGC 1316 under various aspects. The images cover 10 × 10 arcsec2, corresponding to 863 × 863 pc2. The optical centre is indicated by green star symbols in the two upper panels. Upper-left panel: [NII]-map. Flux units are 1017 erg s cm2 Å. The [NII]-luminosity is strongly concentrated in the centre, but the emission is asymmetric, with an extension towards the north-east. Upper-right panel: [NII]-velocity map. A remarkable structure is visible, which we interpret as an outflow. The green star indicates that the “kinematical centre” is offset from the optical centre by about 1″ (corresponding to 86 pc in projection). Lower-left panel: reddening map in the very centre, which visualises the dust. The nucleus is the blue point source at p = 100, q = 100. The dusty cone-like region coincides with the approaching part of the outflow, while no dust seems to be connected with the receding part; this may be explained by a faint background. Lower-right panel: map of the R-parameter from Eq. (1). A well-defined value is R = 1.85. One observes tiny spots indicating higher R-values and higher absorption. We speculate that these spots may be pockets of efficient grain growth. |
| In the text | |
|
Fig. 8. Extraction of the velocities along the cone-like velocity feature that is seen in the upper-right panel of Fig. 7. The zero-point is the kinematical centre. We interpret this feature as an outflow. |
| In the text | |
Current usage metrics show cumulative count of Article Views (full-text article views including HTML views, PDF and ePub downloads, according to the available data) and Abstracts Views on Vision4Press platform.
Data correspond to usage on the plateform after 2015. The current usage metrics is available 48-96 hours after online publication and is updated daily on week days.
Initial download of the metrics may take a while.