Fig. 1.
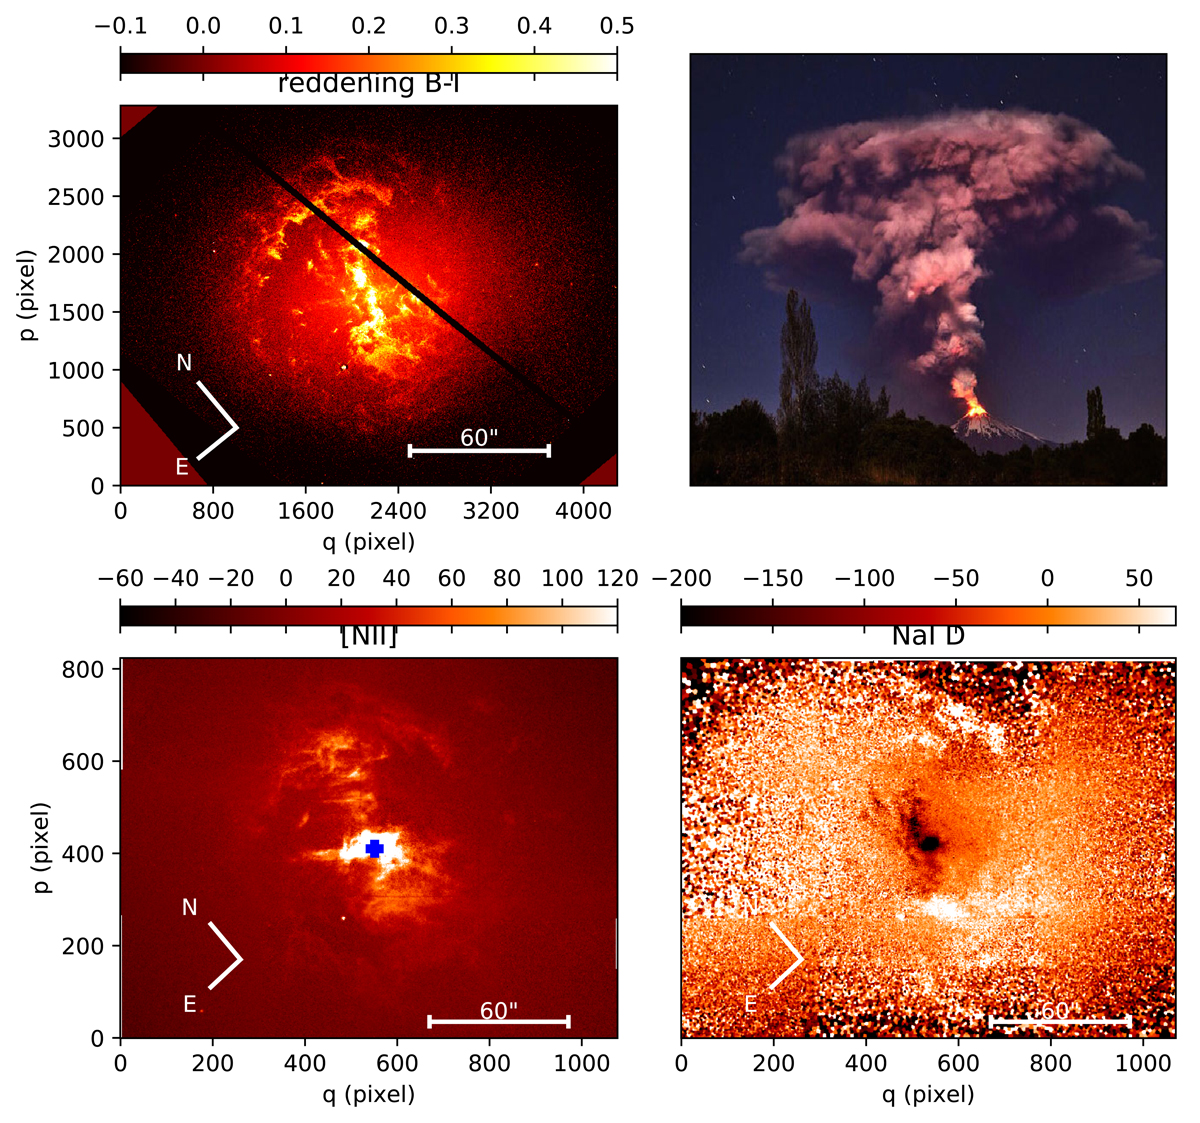
Maps of various components of the ISM in NGC 1316. Upper-left panel: reddening map in B − I based on HST/ACS exposures, the best way to illustrate the dust distribution. We note the spherical shape and the axial symmetry with respect to the centre. The galaxy’s major axis is aligned with the horizontal axis of this image, as are the other NGC 1316 images in this figure. The black line is the chip gap. Upper-right panel: eruption of the Villarica volcano in Chile in March 2015. The morphological similarity triggered us to view the nucleus of NGC 1316 as the main source of dust. Lower-left panel: MUSE mosaic in the light of the [NII]-line 6583 Å, which is the strongest line everywhere. The ionising sources are plausibly AGB stars. We note the close resemblance to the dust distribution. Many details in the dust find their counterparts in the [NII]-structures. Lower-right panel: interstellar absorption line NaI D after Voronoi tessellation and the subtraction of the model galaxy light. Many dust features appear again in this map, demonstrating the quality of this technique as a probe of atomic gas. We note the line emission in those regions that are less obscured by dust. We conclude from the close relation of dust, ionised gas, and atomic gas that gas and dust were never as separated as is normally the case in galaxies: They must come from the same small volume, most probably a nuclear wind.
Current usage metrics show cumulative count of Article Views (full-text article views including HTML views, PDF and ePub downloads, according to the available data) and Abstracts Views on Vision4Press platform.
Data correspond to usage on the plateform after 2015. The current usage metrics is available 48-96 hours after online publication and is updated daily on week days.
Initial download of the metrics may take a while.