Fig. 7.
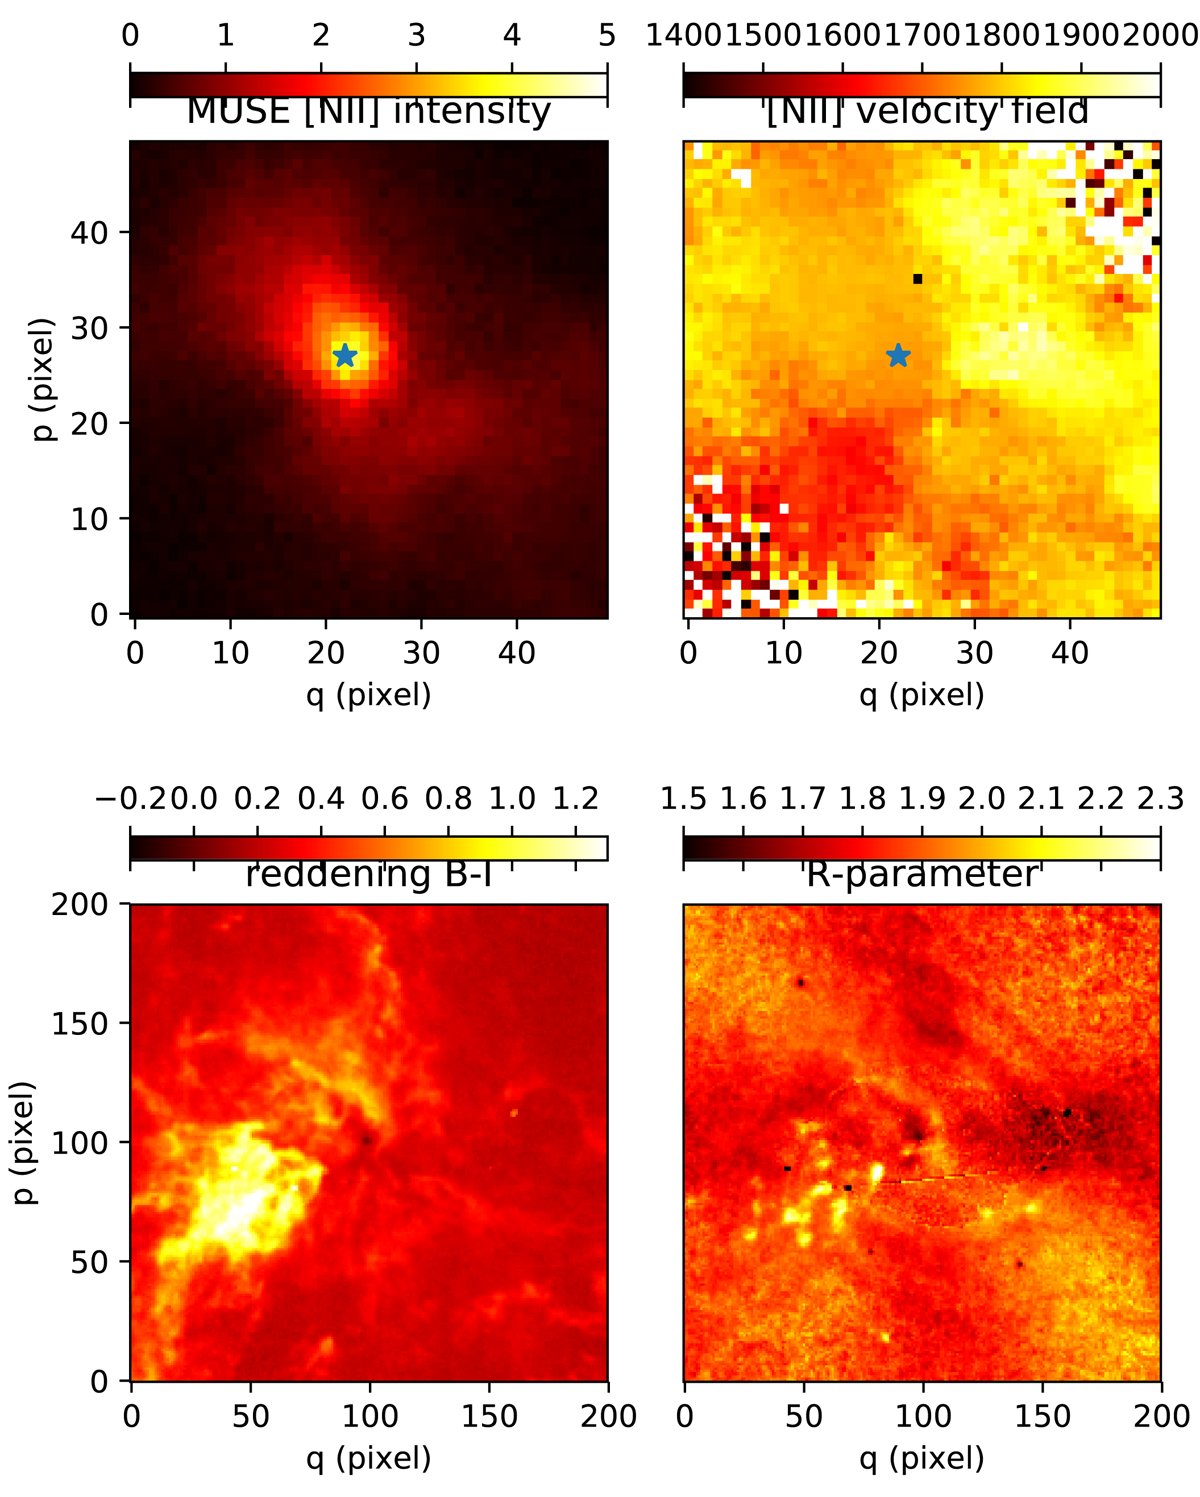
Central region of NGC 1316 under various aspects. The images cover 10 × 10 arcsec2, corresponding to 863 × 863 pc2. The optical centre is indicated by green star symbols in the two upper panels. Upper-left panel: [NII]-map. Flux units are 1017 erg s cm2 Å. The [NII]-luminosity is strongly concentrated in the centre, but the emission is asymmetric, with an extension towards the north-east. Upper-right panel: [NII]-velocity map. A remarkable structure is visible, which we interpret as an outflow. The green star indicates that the “kinematical centre” is offset from the optical centre by about 1″ (corresponding to 86 pc in projection). Lower-left panel: reddening map in the very centre, which visualises the dust. The nucleus is the blue point source at p = 100, q = 100. The dusty cone-like region coincides with the approaching part of the outflow, while no dust seems to be connected with the receding part; this may be explained by a faint background. Lower-right panel: map of the R-parameter from Eq. (1). A well-defined value is R = 1.85. One observes tiny spots indicating higher R-values and higher absorption. We speculate that these spots may be pockets of efficient grain growth.
Current usage metrics show cumulative count of Article Views (full-text article views including HTML views, PDF and ePub downloads, according to the available data) and Abstracts Views on Vision4Press platform.
Data correspond to usage on the plateform after 2015. The current usage metrics is available 48-96 hours after online publication and is updated daily on week days.
Initial download of the metrics may take a while.