Fig. 2.
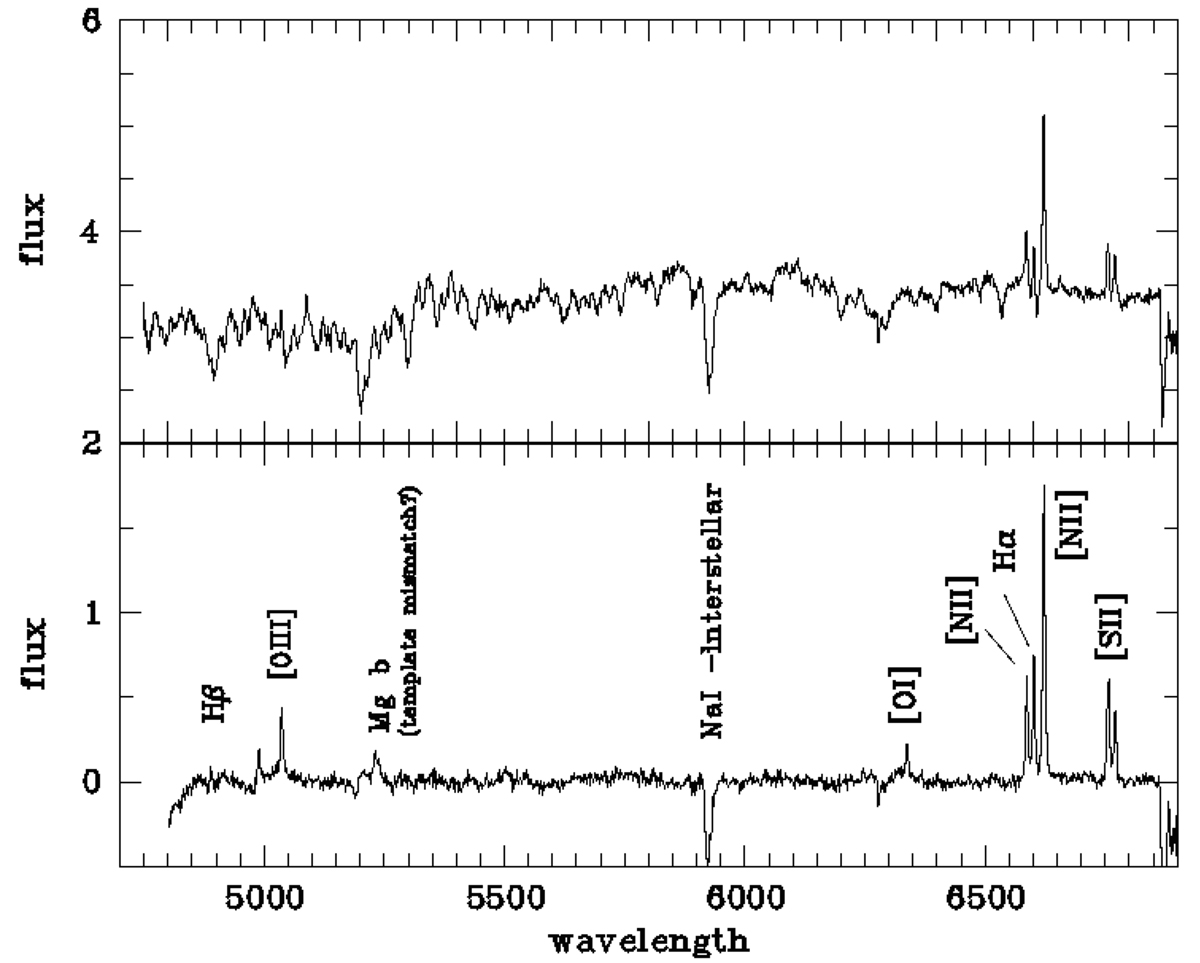
Example spectrum near the centre, 2.6″N, 0.4″E of the nucleus. Upper panel: an old metal-rich galaxy spectrum with a velocity dispersion of about 200 km s−1. The stellar population has been fitted with PyParadise, which enables us to subtract the stellar contribution and leave only the emission lines, which are shown in the lower panel. It is a LINER-like spectrum displaying the typical emission lines, which, in this case, are caused by the radiation field of post-AGB stars. The residual of the Mg b-band is only visible near the centre and is most probably caused by template mismatch.
Current usage metrics show cumulative count of Article Views (full-text article views including HTML views, PDF and ePub downloads, according to the available data) and Abstracts Views on Vision4Press platform.
Data correspond to usage on the plateform after 2015. The current usage metrics is available 48-96 hours after online publication and is updated daily on week days.
Initial download of the metrics may take a while.