| Issue |
A&A
Volume 641, September 2020
|
|
|---|---|---|
| Article Number | A152 | |
| Number of page(s) | 33 | |
| Section | Extragalactic astronomy | |
| DOI | https://doi.org/10.1051/0004-6361/202038236 | |
| Published online | 23 September 2020 | |
γ-ray emission in radio galaxies under the VLBI scope
II. The relationship between γ-ray emission and parsec-scale jets in radio galaxies⋆
1
Max-Planck-Institut für Radioastronomie, Auf dem Hügel 69, 53121 Bonn, Germany
2
Institut für Theoretische Physik und Astrophysik, Universität Würzburg, Emil-Fischer-Str. 31, 97074 Würzburg, Germany
3
ASI Space Science Data Center, Via del Politecnico snc, 00133 Rome, Italy
e-mail: roberto.angioni@ssdc.asi.it
4
INFN – Roma Tor Vergata, Via della Ricerca Scientifica 1, 00133 Rome, Italy
5
NASA Goddard Space Flight Center, Greenbelt, MD 20771, USA
6
Catholic University of America, Washington, DC 20064, USA
7
University of Maryland, Baltimore County, 1000 Hilltop Cir, Baltimore, MD 21250, USA
8
Department of Astrophysics/IMAPP, Radboud University Nijmegen, PO Box 9010, 6500 GL Nijmegen, The Netherlands
9
CSIRO Astronomy and Space Science, PO Box 76, Epping, NSW 1710, Australia
10
Wyle Science, Technology and Engineering Group, Greenbelt, MD 20771, USA
11
Institute for Radio Astronomy & Space Research, AUT University, 1010 Auckland, New Zealand
12
Bundesamt für Kartographie und Geodäsie, 93444 Bad Kötzting, Germany
13
CSIRO Astronomy and Space Science, Canberra Deep Space Communications Complex, PO Box 1035, Tuggeranong, ACT 2901, Australia
14
Department of Astronomy & Astrophysics, Pennsylvania State University, University Park, PA 16802, USA
15
School of Mathematics & Physics, University of Tasmania, Private Bag 37, Hobart, 7001 Tas, Australia
16
Hartebeesthoek Radio Astronomy Observatory, PO Box 443, 1740 Krugersdorp, South Africa
17
ASTRON, the Netherlands Institute for Radio Astronomy, Post-bus 2, 7990 AA Dwingeloo, The Netherlands
18
Dr. Remeis-Sternwarte & ECAP, Universität Erlangen-Nürnberg, Sternwartstraße 7, 96049 Bamberg, Germany
Received:
23
April
2020
Accepted:
20
July
2020
Aims. This is the second paper in our series studying the evolution of parsec-scale radio emission in radio galaxies in the Southern Hemisphere. Following our study of the radio and high-energy properties of γ-ray-emitting sources, here we investigate the kinematic and spectral properties of the parsec-scale jets of radio galaxies that have not yet been detected by the Fermi Large Area Telescope (Fermi-LAT) instrument on board NASA’s Fermi Gamma-ray Space Telescope. For many sources, these results represent the first milliarcsecond resolution information in the literature. These studies were conducted within the framework of the Tracking Active Nuclei with Austral Milliarcsecond Interferometry (TANAMI) monitoring program and in the context of high-energy γ-ray observations from Fermi-LAT.
Methods. We took advantage of the regular 8.4 GHz and 22.3 GHz Very Long Baseline Interferometry (VLBI) observations provided by the TANAMI monitoring program, and explored the kinematic properties of six γ-ray-faint radio galaxies. We complemented this with ∼8.5 years of Fermi-LAT data, deriving updated upper limits on the γ-ray emission from this subsample of TANAMI radio galaxies. We included publicly available VLBI kinematics of γ-ray-quiet radio galaxies monitored by the MOJAVE program and performed a consistent Fermi-LAT analysis. We combined these results with those from our previous paper to construct the largest sample of radio galaxies with combined VLBI and γ-ray measurements to date. The connection between parsec-scale jet emission and high-energy properties in the misaligned jets of radio galaxies was explored.
Results. For the first time, we report evidence of superluminal motion up to βapp = 3.6 in the jet of the γ-ray-faint radio galaxy PKS 2153−69. We find a clear trend of higher apparent speed as a function of distance from the jet core, which indicates that the jet is still being accelerated on scales of tens of parsecs, or ∼105 Rs, corresponding to the end of the collimation and acceleration zone in nearby radio galaxies. We find evidence of subluminal apparent motion in the jets of PKS 1258−321 and IC 4296, and no measurable apparent motion for PKS 1549−79, PKS 1733−565, and PKS 2027−308. For all these sources, TANAMI provides the first multi-epoch kinematic analysis on parsec scales. We then compare the VLBI properties of γ-ray-detected and undetected radio galaxies, and find that the two populations show a significantly different distribution of median core flux density, and, possibly, of median core brightness temperature. In terms of correlation between VLBI and γ-ray properties, we find a significant correlation between median core flux density and γ-ray flux, but no correlation with typical Doppler boosting indicators such as median core brightness temperature and core dominance.
Conclusions. Our study suggests that high-energy emission from radio galaxies is related to parsec-scale radio emission from the inner jet, but is not driven by Doppler boosting effects, in contrast to the situation in their blazar counterparts. This implies that γ-ray loudness does not necessarily reflect a higher prevalence of boosting effects.
Key words: galaxies: active / galaxies: nuclei / gamma rays: galaxies / galaxies: jets
FITS images are only available at the CDS via anonymous ftp to cdsarc.u-strasbg.fr (130.79.128.5) or via http://cdsarc.u-strasbg.fr/viz-bin/cat/J/A+A/641/A152
© ESO 2020
1. Introduction
γ-ray-detected active galactic nuclei (AGN) typically belong to the class of blazars that show a spectral energy distribution (SED) comprising two peaks. The low-energy peak is located between the radio and the soft-X-ray band, while the high-energy peak can range from hard-X-rays to teraelectronvolt γ-rays (see, e.g., Padovani et al. 2017 for a general review). The low-energy peak is associated with synchrotron emission from ultra-relativistic electrons in the jet magnetic field (e.g., Ghisellini 2013), while the high-energy peak could be produced by the same electron population through inverse Compton (IC) processes, with the seed photon field being the synchrotron emission itself (synchrotron self Compton, SSC, Maraschi et al. 1992), or emission from the broad line region (BLR) or AGN torus (external Compton, EC, Sikora et al. 1994). These models alone cannot reproduce the entirety of observed AGN phenomena, especially at very high energies (VHE, E > 100 GeV). Therefore, more sophisticated models involving contributions from relativistic protons, in addition to the electrons, have been developed (e.g., Mannheim 1993; Böttcher et al. 2013).
In all of these models, the same electrons that produce the low-energy emission make at least a contribution to the observed high-energy component. This implies that we expect to observe a connection between the two SED peaks. Indeed, several studies have found such a connection between the radio-millimeter band and the γ-ray band, in the form of correlations of fluxes (e.g., Kovalev et al. 2009; Ackermann et al. 2011; Lico et al. 2017), γ-ray activity episodes concurrent with morphological or kinematical changes in the parsec-scale radio jet (e.g., Schinzel et al. 2012; Jorstad et al. 2013; Casadio et al. 2015), or correlated variability (e.g., Fuhrmann et al. 2014; Kreikenbohm et al. 2016; Schulz et al. 2016). Simply the fact that most of the sources observed by Fermi-LAT are radio-loud AGN (Ackermann et al. 2011; Acero et al. 2015) is also a strong indication of the bond between the two bands. However, all the aforementioned studies deal with large AGN samples, which are typically heavily dominated by blazars. In these sources, the observed emission is strongly affected by orientation-dependent Doppler boosting effects, which are difficult to disentangle from the intrinsic emission. On the other hand, radio galaxies, which are the misaligned parent population of blazars (see, e.g., Urry & Padovani 1995), show significantly smaller Doppler factors, providing a more direct tool to study high-energy emission in AGN jets.
In Angioni et al. (2019; hereafter Paper I) we reported on the interplay between the radio Very Long Baseline Interferometry (VLBI) properties and high-energy emission in γ-ray-detected radio galaxies, taking advantage of multi-epoch VLBI measurements from the TANAMI and MOJAVE monitoring programs, complemented by Fermi-LAT data. In this paper, we complement this study by presenting the kinematic analysis and Fermi-LAT upper limits of γ-ray-undetected TANAMI radio galaxies, and discussing the radio–γ-ray relation in radio galaxies in a broader context and using a larger sample. We compare the parsec-scale jet properties of γ-ray-detected and undetected radio galaxies, and investigate the presence of correlations with Fermi-LAT properties.
The paper is organized as follows. Section 2 introduces the source sample, data sets, and analysis methods used in this paper. Section 3 reports the results obtained from the radio VLBI data (Sects. 3.1 and 3.2) and Fermi-LAT data (Sect. 3.3). We discuss the implications of our results in Sect. 4, and summarize our findings in Sect. 5. All the results are presented on a source-by-source basis. Throughout the paper we assume a cosmology with H0 = 73 km s−1 Mpc−1, Ωm = 0.27, ΩΛ = 0.73 (Komatsu et al. 2011), the radio spectral indices refer to the convention S ∝ ν+α, while the γ-ray photon indices are in the form F ∝ E−Γ.
2. Sample, observations and data reduction
Here we introduce the source sample as well as the data sets and analysis methods used in this work.
2.1. TANAMI radio galaxy sample
A detailed introduction of the TANAMI radio galaxy sample was presented in Paper I (see Sect. 2). The full TANAMI sample was constructed with sources south of δ = −30° from a radio-selected subsample (all sources in the Stickel et al. 1994 catalog, with S5 GHz > 2 Jy and spectral index 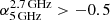 ) and a γ-ray-selected subsample consisting of known γ-ray sources. This selection method is naturally biased toward blazars, since they are easier to detect in γ-rays and have flatter spectral indices in the radio. Therefore, out of ∼100 sources, the TANAMI sample includes a total of just fifteen radio galaxies (see Table 1). Of these, seven have been associated with a γ-ray source based on Fermi-LAT data, while eight have not yet been detected. In this paper, we focus on the LAT-undetected subsample. The individual TANAMI sources studied in this paper therefore include PKS 1258−321 (1258−321), IC 4296 (PKS 1333−33, 1333−337), PKS 1549−79 (1549−790), PKS 1733−56 (1733−565), PKS 1814−63 (1814−638), PKS 2027−308 (2027−308), and PKS 2153−69 (2152−699).
Radio galaxies in the TANAMI sample.
2.2. Radio data
We refer the reader to Sect. 3.1 of Paper I for a detailed description of the VLBI data analysis. Briefly, we imaged all available epochs of 8.4 GHz VLBI observations of the γ-ray-undetected radio galaxies (see Table 1). The time range covered by these observations goes from 2008 to 2013 (the exact range varies for each source). The resulting full-resolution maps and the corresponding image parameters are presented in the appendix. We then modeled the resulting images using circular Gaussian components and tracked those across time to measure apparent speeds, using simple linear regression fits. We combined the measured apparent speed with the jet-to-counterjet flux ratio in order to constrain the intrinsic jet speed and viewing angle. Additionally, we used selected contemporaneous observations at 22.3 GHz to produce spectral index maps.
2.3. Fermi-LAT data
We refer the reader to Sect. 3.2 of Paper I for a detailed description of our Fermi-LAT data analysis method. In short, we use 103 months of data in the energy range 0.1−100 GeV, using a region of interest (ROI) of 15° and the latest Pass8 analysis software, through the python package Fermipy (Wood et al. 2017). We apply a zenith angle cut at 100°, and model the four point spread function (PSF) types1 of LAT data separately, using the summed-likelihood method. To compensate for the decrease in angular resolution with the worse PSF quartiles, we increase the low-energy selection cut to 400 MeV, 500 MeV, and 800 MeV for PSF2, PSF1, and PSF0, respectively.
We fit the ROI with the initial model including all sources from the Third Fermi-LAT source catalog (3FGL, Acero et al. 2015) in the region, and iteratively add new sources based on peaks in the excess test statistic (TS2) maps, until the ROI is properly modeled. We intentionally use the 3FGL as a starting model rather than the more up-to-date 4FGL catalog (Abdollahi et al. 2020) to keep our analysis consistent with Paper I.
Since the sources studied in this paper are not present in the 3FGL, we center the ROI on the radio position of the target. If a new source consistent with the target position is not found by the source-finding iterative procedure, we place a test source at the ROI center assuming a typical photon index value of Γ = 2.2 (see, e.g., The Fermi-LAT collaboration 2019), and derive a 95% confidence upper limit.
3. Results
We first present the high-resolution VLBI images of our seven γ-ray-faint radio galaxies: PKS 1258−321, IC 4296, PKS 1549−79, PKS 1733−56, PKS 1814−63, PKS 2027−308, and PKS 2153−69. Then we discuss the parsec-scale jet kinematics of these sources. Finally we present the results of our analysis of the Fermi-LAT observations of these misaligned jet sources.
3.1. Radio imaging results
In Fig. 1 we present first-epoch VLBI images of the γ-ray-faint TANAMI radio galaxies, while the full set of multi-epoch images and related map parameters is presented in Appendix A. The imaging results for each individual source are discussed in this subsection.
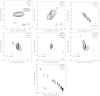 |
Fig. 1. First-epoch 8.4 GHz contour maps of γ-ray-faint TANAMI radio galaxies. The gray ellipse in the bottom left of each panel indicates the convolving beam, while the black bar shows the linear scale. The full set of multi-epoch images and the associated map parameter tables are presented in Appendix A. |
1258−321. The source shows a faint, one-sided jet extending to the northwest (see Fig. 1), aligned with the kiloparsec-scale structure (Marshall et al. 2005). The first-epoch image was presented for the first time in Müller et al. (2018).
1333−337 (IC 4296). This FR I source shows a symmetric double-sided morphology on parsec scales (see Fig. 1), extending in a direction consistent with its large-scale structure (Killeen et al. 1986). The spectral index map, presented in Fig. 2, shows an unresolved feature with a spectral index of α ∼ −0.8.
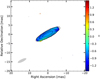 |
Fig. 2. Spectral index map of IC 4296 between 8.4 GHz and 22.3 GHz for epoch 2008-02-07. The black contours are from the 8.4 GHz image. Both maps were convolved with a common beam that is represented in gray in the lower left corner. |
1549−790. This compact flat-spectrum (CFS) source exhibits a classic double-sided structure at milliarcsecond resolution (see Fig. 1), suggesting that its viewing angle is large. Holt et al. (2006) presented VLBI maps of PKS 1549−79 at 2.3 and 8.4 GHz, showing a one-sided jet structure, which was interpreted as evidence of a moderately aligned viewing angle. As discussed in Ojha et al. (2010), the difference between this previous map and our image could be due to the higher sensitivity of TANAMI observations. A spectral index map is shown in Fig. 3.
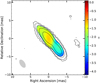 |
Fig. 3. Spectral index map of PKS 1549−79 between 8.4 GHz and 22.3 GHz for epoch 2008-11-27. The black contours are from the 8.4 GHz image. Both maps were convolved with a common beam that is represented in gray in the lower left corner. |
1733−565. This FR II radio galaxy shows a double-sided structure, with jets extending in the northeast-southwest direction, up to ∼5 mas from the core (see Fig. 1). Our TANAMI data therefore allow us to recover additional structure with respect to previous VLBI images, where the source appeared as a compact core (Ojha et al. 2004). The jet orientation follows that of the large-scale radio structure (Hunstead et al. 1982). The jet structure appears to be consistent across the epochs. A spectral index image was created for epoch 2008-02-07, and is presented in Fig. 4. No correction for core-shift effects was required for this source. The source is practically unresolved in the spectral map, with an overall spectral index in the range −0.8 ≲ α ≲ −0.3. We therefore do not detect a flat-spectrum core in this source.
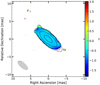 |
Fig. 4. Spectral index map of PKS 1733−565 between 8.4 GHz and 22.3 GHz for epoch 2008-02-07. The black contours are from the 8.4 GHz image. Both maps were convolved with a common beam that is represented in gray in the lower left corner. |
1814−637. This compact steep-spectrum (CSS) source has been proposed as a putative young radio source (Ojha et al. 2010, and references therein). At full resolution, it shows a compact, marginally resolved component (see Fig. 1). Using tapering, that is, down-weighting the visibilities from the longest baselines, it is possible to recover possible emission on larger scales. In this case, we detect a symmetric structure in the north-south direction, reminiscent of classic compact symmetric objects (CSOs, see Appendix A). No contemporaneous 22 GHz data are available for this source.
2027−308. This is the most distant radio galaxy in the sample, with a redshift z = 0.539 (at this scale, 1 mas corresponds to ∼6 pc). Interestingly, the source shows an asymmetric, double-sided structure, with one jet extending to the southwest and a counterjet that seems to bend north (see Fig. 1). No contemporaneous 22 GHz data are available for this source.
2152−699. This FR II source shows a relatively elongated jet, extending ∼50 mas from the core to the northeast. The extended jet is best seen in the first TANAMI epoch (see Fig. 1), due to better (u, v) coverage on short spacings. Previous VLBI observations by Tingay et al. (1996) showed a one-sided jet extending for ∼20 mas to the northeast. Space-VLBI images with the VLBI Space Observatory Programme (VSOP) show a narrow, smooth jet extending in the same direction for ∼6 mas (Tingay et al. 2002). The jet orientation is consistent with the large-scale radio structure of the source (Fosbury et al. 1990; Norris et al. 1990). A spectral index map is shown in Fig. 5, and shows a relatively steep core with a spectral index around −0.5 < α < −0.7.
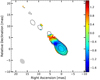 |
Fig. 5. Spectral index map of PKS 2153−69 between 8.4 GHz and 22.3 GHz for epoch 2008-11-27. The black contours are from the 8.4 GHz image. Both maps were convolved with a common beam that is represented in gray in the lower left corner. |
3.2. Radio kinematic analysis results
Figure 6 shows the core separation versus time for each Gaussian component identified and tracked in the jet of each source. We list the corresponding values of the angular speed, apparent speed, and estimated ejection date in Table 2, where the columns list the source name, component identification, apparent angular and linear speeds, ejection date (when applicable), and number of epochs in which a component is detected. As in Paper I, only components with at least five epochs are listed, and ejection dates are given only if the measured speed is not consistent with zero within the 1σ errors. Finally, we illustrate the parameter space of intrinsic jet parameters βapp (apparent linear speed) and θ (viewing angle) allowed by our results in Fig. 7. Additional plots illustrating the kinematic analysis results are provided in Appendix B, namely the multi-epoch component identification and tracking, their flux density evolution with time, and tables reporting the Modelfit component3 parameters.
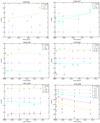 |
Fig. 6. Jet kinematics of our radio galaxies with core distance of jet features as a function of time. The solid lines represent a least squares fit to their positions (the slope is the apparent speed). |
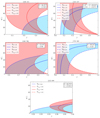 |
Fig. 7. Parameter space of intrinsic jet speed β and viewing angle θ allowed by our observations. The blue shaded area is the one allowed by the measurement of R, while the red shaded area is the one allowed by the observed βapp. When possible, we provide a minimum, maximum, and a central estimate of R and βapp. The top-right legend reports the resulting limits on θ and β. |
Results of the kinematic analysis of LAT-undetected TANAMI radio galaxies.
1258−321. In this source, only one jet component (J1) can be tracked for at least five epochs. The corresponding apparent speed is subluminal. Figure 7 shows the limits on the intrinsic jet speed and viewing angle for PKS 1258−321 resulting from our observations. We do not detect a counterjet in this case, therefore we set a lower limit for the jet-to-counterjet flux ratio (R).
1333−337. We find that the two symmetric jet components (J1 and CJ1) show almost no motion during our monitoring period. Although we do find a non-zero separation speed for component CJ1, the uncertainty on this value is higher than 50%. In Fig. 7, we adopt the only non-zero apparent speed value as the central estimate, and use its uncertainty to define the minimum and maximum estimates.
1549−790. We find that the symmetric structure in this source is remarkably stable, with no measured jet motions, and an upper limit on the apparent speed of βapp < 1.7. We use this value to define the allowed intrinsic jet parameter space in Fig. 7.
1733−565. We do not detect any statistically significant motion in this double-sided jet. We use the maximum apparent speed value allowed by our measurements, βapp < 0.24, to constrain the intrinsic jet parameter space (see Fig. 7).
1814−637. The source is only marginally resolved in most of the epochs, therefore it is not possible to track any jet component.
2027−308. In this case, we do not measure any significant jet motion. The uncertainty of the component positions is very large, due to their faint flux density. Therefore, we do not attempt to estimate the jet viewing angle and intrinsic speed for PKS 2027−308, as such estimates would be extremely uncertain.
2152−699. This source shows the fastest apparent motions in this sample, up to βapp = 3.6 ± 0.8 for component J4. Interestingly, there is a clear trend of increasing apparent component speed with increasing core distance. This can be seen in Fig. 8, where this effect has been quantified by means of a simple linear fit, which yields βapp = 0.19d + 0.34 (where d is the angular core separation). This behavior is similar to that revealed by TANAMI data for the parsec-scale jet of Centaurus A (Müller et al. 2014b), although both the apparent speed and the distance from the core have much larger values in PKS 2153−69. The high apparent speed and the absence of a detected counter-jet allow us to place a stringent constraint of the viewing angle, which has to be θ < 27° (see lower panel of Fig. 7). This value has been used to convert the angular core separation into de-projected linear separation.
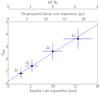 |
Fig. 8. Apparent velocity of components in the jet of PKS 2153−69 as a function of average core distance. A clear linear increasing trend is seen, indicating downstream acceleration. The de-projected linear core distance has been calculated assuming the maximum possible viewing angle of ∼27° (see the lower panel of Fig. 7). The topmost x-axis is in units of Schwarzschild radii (Rs). |
In order to put into context these linear scales within our current understanding of jet collimation and acceleration, we have converted the linear separation into units of Schwarzschild radius Rs = 2GMBH/c2. We did not find any previous measurement of the black hole mass for this source in the literature, however a measurement of the central stellar velocity dispersion is provided by the4 HyperLeda database (Makarov et al. 2014), with a value of σ = (240 ± 20) km s−1. From this, the black hole mass can be estimated using the M–σ relation from McConnell & Ma (2013), which yields log(MBH/M⊙) = 8.79. This in turn leads to a Schwarzschild radius of Rs = 5.9 × 10⁻⁵ pc. The linear scales probed by our kinematic analysis are therefore on the order of ∼105 Rs. According to recent studies on parsec-scale radio galaxy jets (see, e.g., Boccardi et al. 2017, and references therein), these scales typically correspond to the end of the acceleration and collimation region and the transition between the parabolic and conical jet expansion regime.
3.3. Fermi-LAT results
In this section we present the results of our analysis of γ-ray data for so far undetected TANAMI radio galaxies, which are summarized in Table 3. Here we list the source name, class, photon flux and energy flux upper limits, and TS. We discuss individually the cases of PKS 1258−321 and PKS 2153−69 as they lie close to unidentified γ-ray sources from the 3FGL catalog.
Fermi-LAT upper limits on TANAMI radio galaxies.
1258−321. This FR I radio galaxy is not listed as a γ-ray source in any Fermi-LAT catalog, but it lies close to the unidentified source 3FGL J1259.5−3231. To test a possible association, we analyzed 103 months of LAT data in a 10° ROI around the radio position of PKS 1258−321. We removed 3FGL J1259.5−3231 from the model, and produced a map of the excess significance (TS) in the region (see Fig. 9, top panel). We iteratively added new sources to the model starting from TS > 25 peaks in the TS map, until no significant excess remained. This procedure resulted in the detection of a new source, dubbed PS J1259.8−3224, which after localization appears to be consistent with the catalog position of 3FGL J1259.5−3231, and does not include the radio position of PKS 1258−321.
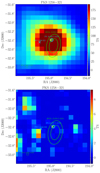 |
Fig. 9. Top panel: map of excess TS in the inner region of the ROI centered on PKS 1258−321, after removing the unidentified catalog source 3FGL J1259.5−3231 from the model. Bottom panel: residual excess TS map after modeling and localizing the new source PS J1259.7−3223. Both panels: The cyan cross represents the radio position of PKS 1258−321. The yellow cross represents the position of NVSS J125949−322329. The yellow ellipses represent the 68% and 95% positional uncertainties from the catalog for 3FGL J1259.5−3231. The cyan circles represent the 68% and 95% positional uncertainties for the new source PS J1259.7−3223. The map radius is 0.8°. Each pixel corresponds to 0.1°. |
A possible association for the γ-ray source is the radio source NVSS J125949−322329 (RA: 194.957542 deg, Dec: −32.391361 deg, z = 0.013750, Jones et al. 2005), which lies at an angular distance of ∼54″ from the γ-ray source’s best fit position. This source has been indicated as a candidate γ-ray emitter based on its WISE colors by D’Abrusco et al. (2014). Indeed, a γ-ray source in the Fourth LAT Source Catalog, 4FGL J1259.7−3223, is listed as being associated to this radio source (4FGL Abdollahi et al. 2020). There is no significant residual excess after modeling this source (see Fig. 9, bottom panel). By placing a test source at the radio position of the PKS 1258−321, we derive an upper limit, which is listed in Table 3.
In order to check the consistency of our analysis with the 4FGL catalog, we repeated the data analysis pipeline using the 4FGL as the starting model, the updated IRF, and diffuse models (P8R3_SOURCE_V2, gll_iem_v07.fits, iso_P8R3_SOURCE_V2_v1.txt, respectively). The goal was to check that our analysis procedure is able to recover consistent results with respect to the latest catalog, therefore we did not remove any point source from the model in this case. This analysis yields similar results to the 3FGL-based one, meaning PKS 1258−321 is not detected (TS = 2.36, FUL = 2.71 × 10⁻⁹ photons cm−2 s−1).
2152−699. This source is close to the unidentified catalog source 3FGL J2200.0−6930. We analyzed the region with the same procedure used for PKS 1258−321 and PKS 1718−649 (see Paper I), and found that the newly modeled γ-ray source is consistent with the position of 3FGL J2200.0−6930, and not with PKS 2153−69. There is no likely counterpart to the new γ-ray source PS J2200.5−6929 within the 95% error circle (see Fig. 10, top panel). Lowering the threshold of the source-finding algorithm to TS > 9, we find a significant source (PS J2152.0−6956) that lies ∼0.5° from the target position. Upon localization, we find that the 95% confidence uncertainty region for this source does not include PKS 2153−69. There is no significant (> 3σ) residual excess after modeling the latter source (see Fig. 10, bottom panel), therefore we derive an upper limit at the target position (see Table 3).
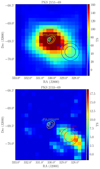 |
Fig. 10. Top panel: map of excess TS in the inner region of the ROI centered on PKS 2153−69, after removing the unidentified catalog source 3FGL J2200.0−6930 from the model. Bottom panel: residual excess TS map after modeling and localizing the new source PS J2200.5−6930. Both panels: The cross represents the radio position of PKS 2153−69. The yellow ellipses represent the 68% and 95% positional uncertainties from the catalog for 3FGL J2200.0−6930. The cyan circles represent the 68% and 95% positional uncertainties for the new source PS J2200.5−6930. The blue (top) and red (bottom) circles represent the 68% and 95% positional uncertainties for the new source PS J2152.0−6956. The map radius is 1°. Each pixel corresponds to 0.1°. |
In the latest Fermi-LAT catalog, the 4FGL (Abdollahi et al. 2020), the γ-ray source 4FGL J2156.0−6942 is associated with PKS 2153−69. We performed the same consistency check mentioned in the previous paragraph, using the 4FGL as a starting model, without deleting any point source. Source 4FGL J2156.0−6942 is detected with TS = 87.55, it is spatially distinct from the nearby source 4FGL J2201.0−6928, and it is positionally consistent with PKS 2153−69 within the 99% error region obtained by localization. Therefore, our analysis pipeline successfully reproduces the 4FGL results when using an updated analysis setup. The difference between the 3FGL and 4FGL-based analyses can be ascribed to the different analysis setup (updated catalog, IRFs, and diffuse models). Finally, while it may be that PKS 2153−69 is indeed a real γ-ray emitter, one should note that 4FGL J2156.0−6942 is flagged as “confused”, due to the presence of a nearby brighter source.
4. Discussion
In this section, we investigate the radio and γ-ray properties of the radio galaxies in the TANAMI program as a full sample. As in Paper I, in order to increase the sample size we have included all MOJAVE radio galaxies with measured apparent speed and performed a consistent LAT analysis. The results for LAT-detected sources have already been presented in Paper I. Here we list the upper limits obtained for LAT-undetected MOJAVE radio galaxies in Table 4. We can now combine the TANAMI+MOJAVE γ-ray-detected and undetected radio galaxy samples. With a total of 35 objects, this is the largest radio galaxy sample with combined γ-ray and VLBI measurements studied so far.
Fermi-LAT upper limits on 0.1−100 GeV emission for MOJAVE radio galaxies.
In order to compare the radio properties of γ-ray-detected and undetected subsamples, we visualize their distribution with histograms, shown in Fig. 11. We test whether there is a statistically significant difference in the distribution of LAT-detected and -undetected radio galaxies using the Kolmogorov–Smirnov statistic (KS). The results of this test are listed in Table 5.
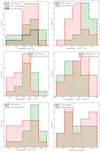 |
Fig. 11. Histograms of radio VLBI properties for LAT-detected (green vertical hatch) and undetected radio galaxies (red slashed hatch) from the MOJAVE and TANAMI monitoring programs. Top left: maximum measured apparent speed. Top right: median VLBI core flux density. Center left: median logarithmic VLBI jet flux density. Center right: median logarithmic VLBI core luminosity. Bottom left: median logarithmic core brightness temperature. Bottom right: median VLBI core dominance. |
The most statistically significant result is obtained for the median VLBI core flux density  , which shows a quite clear dichotomy between the two subsamples, with the LAT-undetected sources occupying the lower end, and the LAT-detected sources dominating the upper end of the distribution (see top right panel of Fig. 11). A similar significance is found for the median core brightness temperature (
 , see bottom left panel of Fig. 11). The following VLBI parameters for which we tested for significant differences in the distribution of LAT-detected and -undetected radio galaxies yield less significant results (p-value > 0.05): maximum apparent speed (max(βapp), top left panel of Fig. 11), median jet flux density (
 , i.e., total minus core, see middle left panel of Fig. 11), median core luminosity (
 , middle right panel of Fig. 11), and median VLBI core dominance (⟨CDVLBI⟩, i.e., core flux over total flux, see bottom right panel of Fig. 11).
In order to investigate possible correlations between the radio and γ-ray properties of the sources in this sample, we used the Kendall’s correlation coefficient (τ) adapted to take into account the presence of upper limits, following Akritas & Siebert (1996). The correlation coefficient is equal to zero in the case of uncorrelated data, one in the case of maximum correlation, and minus one in the case of maximum anti-correlation. The resulting correlation coefficients with errors and the relative p-values are listed in Table 6. The scatter plots of radio versus γ-ray properties are presented in Fig. 12.
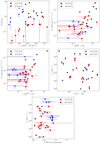 |
Fig. 12. Top left: maximum observed apparent speed as a function of total VLBI luminosity. Top right: Fermi-LAT flux as a function of average VLBI core flux. Center left: Fermi-LAT flux as a function of average VLBI jet flux. Center right: average VLBI core brightness temperature as a function of Fermi-LAT luminosity. Center bottom: Fermi-LAT luminosity as a function of average VLBI core dominance. |
Correlation coefficients between radio and γ-ray properties of our radio galaxy sample, and corresponding significance.
The resulting correlation properties corroborate those presented in Paper I. The only radio and γ-ray properties showing a statistically significant correlation are the VLBI core flux density and LAT flux. There is no correlation between γ-ray flux (Fγ) and parsec-scale jet flux. A simple linear correlation between the luminosity in the two bands (Lγ and  ) yields τ = 0.78 and p = 2 × 10⁻⁵. However, when computing the partial correlation coefficient accounting for redshift (see Akritas & Siebert 1996) this is reduced to τ = 0.39 and p = 0.05, which hints at a physical correlation, but with reduced statistical significance. Finally, the γ-ray luminosity appears to be entirely uncorrelated with common VLBI Doppler boosting indicators such as core brightness temperature and core dominance.
5. Summary and conclusions
In this paper, the second of a series, we continue a sample study on the connection between the radio emission from a parsec-scale jet and the high-energy γ-ray properties of radio galaxies. While such a connection has been firmly established for large AGN samples, these were dominated by blazars, in other words, aligned jets whose emission is strongly affected by Doppler boosting effects. In this work, completing the findings of Paper I, we have explored the parsec-scale radio–γ-ray connection in a large sample of radio galaxies, that is, AGN with misaligned jets.
Here, we report the kinematics of the VLBI jet in LAT-undetected radio galaxies from the TANAMI monitoring program. We found that most of the sources show slowly moving jet components with subluminal or zero apparent speed. The only γ-ray-faint radio galaxy showing fast apparent motion, up to βapp = 3.6, is the FR II source PKS 2153−69. We found a clear linear trend of increasing apparent speed with average core separation in the jet of the latter source, which indicates that it is still undergoing acceleration on scales of tens of parsecs or ∼105 Rs, corresponding to the termination of the acceleration and collimation region in radio galaxies.
We present updated LAT upper limits on γ-ray-faint TANAMI radio galaxies. Specifically, we have investigated whether PKS 1258−321 and PKS 2153−69 might be the counterparts to the nearby unassociated γ-ray sources 3FGL J1259.5−3231 and 3FGL J2200.0−6930, respectively. We found that based on ∼8.5 years of LAT data, the two radio galaxies are not included within the positional uncertainty of the γ-ray sources.
Combining our VLBI and Fermi-LAT results with those of Paper I, and merging the TANAMI and MOJAVE radio galaxy samples, we assembled the largest sample of radio galaxies with measured parsec-scale kinematics and γ-ray properties to date, counting a total of 35 sources. We have investigated whether the LAT-detected and undetected sub-populations show differences in their radio VLBI properties. Based on a Kolmogorov–Smirnov two-sample test, we found differences in the distribution of median VLBI core flux at the level of 2.6σ, and indications of a separation in the distribution of median core brightness temperature at the level of 2.4σ. In terms of correlations between radio VLBI and γ-ray properties, the results on the full sample corroborate the ones reported in Paper I on the LAT-detected subsample, with a significant correlation between median radio core flux and γ-ray flux, and no correlation between γ-ray luminosity and common parsec-scale Doppler boosting indicators such as core brightness temperature and core dominance. Overall, by comparing several VLBI and Fermi-LAT properties of radio galaxies, we are able to quantitatively show that high-energy emission in misaligned jets is related to the brightness of their innermost parsec-scale regions, as is observed for blazars. While there is general agreement that beaming effects in radio galaxies are less pronounced than in blazars (cf. the AGN unification model; e.g., Urry & Padovani 1995), it is clear that significant relativistic beaming is present in misaligned jet sources as well. This is demonstrated, for example, by their usually one-sided or apparently asymmetric parsec-scale jets and their high core brightness temperatures. Until now, however, the impact the remaining Doppler boosting still has on the γ-ray brightness of radio galaxies has not been investigated. Our results indicate quantitatively, for the first time, that the existing effect of boosting observed in radio galaxies does not dominate the observed γ-ray properties5 from their misaligned jets.
The TS is defined as 2 log(L/L0) where L is the likelihood of the model with a point source at the target position, and L0 is the likelihood without the source. A value of TS = 25 corresponds to a significance of 4.2σ (Mattox et al. 1996).
Acknowledgments
We thank Laura Vega García for the development of the Python GUI-based code that was used for the kinematic analysis and the spectral index maps. We thank Frank Schinzel as the Fermi-LAT collaboration internal referee. We also thank the journal referee for a constructive report. This research has made use of the NASA/IPAC Extragalactic Database (NED), which is operated by the Jet Propulsion Laboratory, California Institute of Technology, under contract with the National Aeronautics and Space Administration; data from the MOJAVE database that is maintained by the MOJAVE team (Lister et al. 2018); APLpy, an open-source plotting package for Python (Robitaille & Bressert 2012); Astropy, a community-developed core Python package for Astronomy (Astropy Collaboration 2013, 2018) C.M. acknowledges support from the ERC Synergy Grant “BlackHoleCam: Imaging the Event Horizon of Black Holes” (Grant 610058). R.S. gratefully acknowledges support from the European Research Council under the European Union’s Seventh Framework Programme (FP/2007-2013)/ERC Advanced Grant RADIOLIFE-320745. F.K. was supported as an Eberly Research Fellow by the Eberly College of Science at the Pennsylvania State University. The Fermi-LAT Collaboration acknowledges generous ongoing support from a number of agencies and institutes that have supported both the development and the operation of the LAT, as well as scientific data analysis. These include the National Aeronautics and Space Administration and the Department of Energy in the United States; the Commissariat á l’Energie Atomique and the Centre National de la Recherche Scientifique/Institut National de Physique Nucléaire et de Physique des Particules in France; the Agenzia Spaziale Italiana and the Istituto Nazionale di Fisica Nucleare in Italy; the Ministry of Education, Culture, Sports, Science and Technology (MEXT), High Energy Accelerator Research Organization (KEK), and Japan Aerospace Exploration Agency (JAXA) in Japan; and the K.A. Wallenberg Foundation, the Swedish Research Council, and the Swedish National Space Board in Sweden. Additional support for science analysis during the operations phase is gratefully acknowledged from the Istituto Nazionale di Astrofisica in Italy and the Centre National d’Etudes Spatiales in France. This work was performed in part under DOE Contract DE-AC02-76SF00515. The Long Baseline Array is part of the Australia Telescope National Facility which is funded by the Commonwealth of Australia for operation as a National Facility managed by CSIRO. This study made use of data collected through the AuScope initiative. AuScope Ltd is funded under the National Collaborative Research Infrastructure Strategy (NCRIS), an Australian Commonwealth Government Programme. This work made use of the Swinburne University of Technology software correlator, developed as part of the Australian Major National Research Facilities Programme. This work was supported by resources provided by the Pawsey Supercomputing Centre with funding from the Australian Government and the Government of Western Australia. Hartebeesthoek Radio Astronomy Observatory (HartRAO) is a facility of the National Research Foundation (NRF) of South Africa. This research was funded in part by NASA through Fermi Guest Investigator grants NNH10ZDA001N, NNH12ZDA001N, and NNH13ZDA001N-FERMI (proposal numbers 41213, 61089, and 71326, respectively). This research was supported by an appointment to the NASA Postdoctoral Program at the Goddard Space Flight Center, administered by Universities Space Research Association through a contract with NASA.
References
- Abdollahi, S., Acero, F., Ackermann, M., et al. 2020, ApJS, 247, 33 [NASA ADS] [CrossRef] [Google Scholar]
- Acero, F., Ackermann, M., Ajello, M., et al. 2015, ApJS, 218, 23 [Google Scholar]
- Ackermann, M., Ajello, M., Allafort, A., et al. 2011, ApJ, 741, 30 [NASA ADS] [CrossRef] [Google Scholar]
- Akritas, M. G., & Siebert, J. 1996, MNRAS, 278, 919 [NASA ADS] [CrossRef] [Google Scholar]
- Angioni, R., Ros, E., Kadler, M., et al. 2019, A&A, 627, A148 [CrossRef] [EDP Sciences] [Google Scholar]
- Astropy Collaboration (Robitaille, T. P., et al.) 2013, A&A, 558, A33 [NASA ADS] [CrossRef] [EDP Sciences] [Google Scholar]
- Astropy Collaboration (Price-Whelan, A. M., et al.) 2018, AJ, 156, 123 [Google Scholar]
- Boccardi, B., Krichbaum, T. P., Ros, E., & Zensus, J. A. 2017, A&ARv, 25, 4 [NASA ADS] [CrossRef] [Google Scholar]
- Böttcher, M., Reimer, A., Sweeney, K., & Prakash, A. 2013, ApJ, 768, 54 [Google Scholar]
- Casadio, C., Gómez, J. L., Grandi, P., et al. 2015, ApJ, 808, 162 [NASA ADS] [CrossRef] [Google Scholar]
- da Costa, L. N., Pellegrini, P. S., Davis, M., et al. 1991, ApJS, 75, 935 [NASA ADS] [CrossRef] [Google Scholar]
- D’Abrusco, R., Massaro, F., Paggi, A., et al. 2014, ApJS, 215, 14 [NASA ADS] [CrossRef] [Google Scholar]
- Fosbury, R. A. E., di Serego Alighieri, S., Courvoisier, T. J. L., et al. 1990, in ESA SP, ed. E. Rolfe, 310, 513 [Google Scholar]
- Fuhrmann, L., Larsson, S., Chiang, J., et al. 2014, MNRAS, 441, 1899 [NASA ADS] [CrossRef] [Google Scholar]
- Ghisellini, G. 2013, in The Innermost Regions of Relativistic Jets and Their Magnetic Fields, Granada, Spain, ed. J. L. Gómez, Eur. Phys. J. Web Conf., 61, 05001 [Google Scholar]
- Goldoni, P., Pita, S., Boisson, C., et al. 2016, A&A, 586, L2 [NASA ADS] [CrossRef] [EDP Sciences] [Google Scholar]
- Graham, J. A. 1978, PASP, 90, 237 [NASA ADS] [CrossRef] [Google Scholar]
- Healey, S. E., Romani, R. W., Cotter, G., et al. 2008, ApJS, 175, 97 [NASA ADS] [CrossRef] [Google Scholar]
- Holt, J., Tadhunter, C., Morganti, R., et al. 2006, MNRAS, 370, 1633 [NASA ADS] [CrossRef] [Google Scholar]
- Holt, J., Tadhunter, C. N., & Morganti, R. 2008, MNRAS, 387, 639 [NASA ADS] [CrossRef] [Google Scholar]
- Hunstead, R. W., Durdin, J. M., Little, A. G., Reynolds, J. E., & Kesteven, M. J. L. 1982, PASA, 4, 447 [CrossRef] [Google Scholar]
- Jones, H., Saunders, W., Colless, M., et al. 2005, in The 6dF Galaxy Survey: First Data Release, eds. A. P. Fairall, & P. A. Woudt, ASP Conf. Ser., 329, 11 [Google Scholar]
- Jones, D. H., Read, M. A., Saunders, W., et al. 2009, MNRAS, 399, 683 [NASA ADS] [CrossRef] [Google Scholar]
- Jorstad, S. G., Marscher, A. P., Smith, P. S., et al. 2013, ApJ, 773, 147 [NASA ADS] [CrossRef] [Google Scholar]
- Killeen, N. E. B., Bicknell, G. V., & Ekers, R. D. 1986, ApJ, 302, 306 [NASA ADS] [CrossRef] [Google Scholar]
- Komatsu, E., Smith, K. M., Dunkley, J., et al. 2011, ApJS, 192, 18 [NASA ADS] [CrossRef] [Google Scholar]
- Kovalev, Y. Y., Aller, H. D., Aller, M. F., et al. 2009, ApJ, 696, L17 [NASA ADS] [CrossRef] [Google Scholar]
- Kreikenbohm, A., Schulz, R., Kadler, M., et al. 2016, A&A, 585, A91 [NASA ADS] [CrossRef] [EDP Sciences] [Google Scholar]
- Lauberts, A., & Valentijn, E. A. 1989, The Surface Photometry Catalogue of the Eso-Uppsala Galaxies (Garching: European Southern Observatory) [Google Scholar]
- Lico, R., Giroletti, M., Orienti, M., et al. 2017, A&A, 606, A138 [NASA ADS] [CrossRef] [EDP Sciences] [Google Scholar]
- Lister, M. L., Aller, M. F., Aller, H. D., et al. 2018, ApJS, 234, 12 [NASA ADS] [CrossRef] [Google Scholar]
- Makarov, D., Prugniel, P., Terekhova, N., Courtois, H., & Vauglin, I. 2014, A&A, 570, A13 [CrossRef] [EDP Sciences] [Google Scholar]
- Mannheim, K. 1993, A&A, 269, 67 [NASA ADS] [Google Scholar]
- Maraschi, L., Ghisellini, G., & Celotti, A. 1992, ApJ, 397, L5 [NASA ADS] [CrossRef] [Google Scholar]
- Marshall, H. L., Schwartz, D. A., Lovell, J. E. J., et al. 2005, ApJS, 156, 13 [NASA ADS] [CrossRef] [Google Scholar]
- Mattox, J. R., Bertsch, D. L., Chiang, J., et al. 1996, ApJ, 461, 396 [NASA ADS] [CrossRef] [Google Scholar]
- McConnell, N. J., & Ma, C.-P. 2013, ApJ, 764, 184 [NASA ADS] [CrossRef] [Google Scholar]
- Meyer, M. J., Zwaan, M. A., Webster, R. L., et al. 2004, MNRAS, 350, 1195 [NASA ADS] [CrossRef] [Google Scholar]
- Müller, C., Kadler, M., Ojha, R., et al. 2014a, A&A, 562, A4 [NASA ADS] [CrossRef] [EDP Sciences] [Google Scholar]
- Müller, C., Kadler, M., Ojha, R., et al. 2014b, A&A, 569, A115 [NASA ADS] [CrossRef] [EDP Sciences] [Google Scholar]
- Müller, C., Krauß, F., Dauser, T., et al. 2015, A&A, 574, A117 [NASA ADS] [CrossRef] [EDP Sciences] [Google Scholar]
- Müller, C., Burd, P. R., Schulz, R., et al. 2016, A&A, 593, L19 [NASA ADS] [CrossRef] [EDP Sciences] [Google Scholar]
- Müller, C., Kadler, M., Ojha, R., et al. 2018, A&A, 610, A1 [NASA ADS] [CrossRef] [EDP Sciences] [Google Scholar]
- Norris, R. P., Kesteven, M. J., Sramek, R. A., et al. 1990, PASA, 8, 252 [CrossRef] [Google Scholar]
- O’Dea, C. P. 1998, PASP, 110, 493 [NASA ADS] [CrossRef] [Google Scholar]
- Ojha, R., Fey, A. L., Johnston, K. J., et al. 2004, AJ, 127, 3609 [NASA ADS] [CrossRef] [Google Scholar]
- Ojha, R., Kadler, M., Böck, M., et al. 2010, A&A, 519, A45 [NASA ADS] [CrossRef] [EDP Sciences] [Google Scholar]
- Padovani, P., Alexander, D. M., Assef, R. J., et al. 2017, A&ARv, 25, 2 [Google Scholar]
- Quintana, H., & Ramirez, A. 1995, ApJS, 96, 343 [NASA ADS] [CrossRef] [Google Scholar]
- Robitaille, T., & Bressert, E. 2012, Astrophysics Source Code Library [record ascl:1208.017] [Google Scholar]
- Schinzel, F. K., Lobanov, A. P., Taylor, G. B., et al. 2012, A&A, 537, A70 [NASA ADS] [CrossRef] [EDP Sciences] [Google Scholar]
- Schulz, R., Kreikenbohm, A., Kadler, M., et al. 2016, A&A, 588, A146 [NASA ADS] [CrossRef] [EDP Sciences] [Google Scholar]
- Sikora, M., Begelman, M. C., & Rees, M. J. 1994, ApJ, 421, 153 [Google Scholar]
- Smith, R. J., Lucey, J. R., Hudson, M. J., Schlegel, D. J., & Davies, R. L. 2000, MNRAS, 313, 469 [NASA ADS] [CrossRef] [Google Scholar]
- Stickel, M., Meisenheimer, K., & Kuehr, H. 1994, A&AS, 105, 211 [NASA ADS] [Google Scholar]
- The Fermi-LAT collaboration 2019, ArXiv e-prints [arXiv:1905.10771] [Google Scholar]
- Tingay, S. J., Jauncey, D. L., Reynolds, J. E., et al. 1996, AJ, 111, 718 [NASA ADS] [CrossRef] [Google Scholar]
- Tingay, S. J., Reynolds, J. E., Tzioumis, A. K., et al. 2002, ApJS, 141, 311 [NASA ADS] [CrossRef] [Google Scholar]
- Urry, C. M., & Padovani, P. 1995, PASP, 107, 803 [NASA ADS] [CrossRef] [Google Scholar]
- West, R. M., & Tarenghi, M. 1989, A&A, 223, 61 [NASA ADS] [Google Scholar]
- Wood, M., Caputo, R., Charles, E., et al. 2017, in 35th International Cosmic Ray Conference (ICRC2017), Int. Cosm. Ray Conf., 301, 824 [Google Scholar]
Appendix A: Full resolution VLBI maps and image parameters
Here we present the full-resolution VLBI images for the sources studied in this paper, along with the tables including the details of each observation (see Figs. A.1–A.13), for each source (see Tables A.2–A.7).
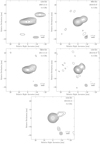 |
Fig. A.1. Full-resolution images of PKS 1258−321. The map parameters for each epoch can be found in Table A.1. The gray ellipse represents the beam size, while the black line indicates the linear scale at the source’s redshift. Contours increase in steps of two starting from 0.5, 0.8, 0.8, 1, 0.8 times the noise level in each map, from top left to bottom, respectively. |
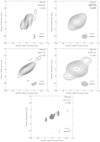 |
Fig. A.2. Full-resolution images of IC 4296. The gray ellipse represents the beam size, while the black line indicates the linear scale at the source’s redshift. Contours increase in steps of two starting from 2, 2, 3, 3, 3 times the noise level in each map, from top left to bottom, respectively. |
 |
Fig. A.3. Full-resolution images of IC 4296. The gray ellipse represents the beam size, while the black line indicates the linear scale at the source’s redshift. Contours increase in steps of two starting from 3, 1 times the noise level in each map, from left to right, respectively. |
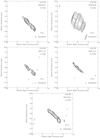 |
Fig. A.4. Full-resolution images of PKS 1549−79. The gray ellipse represents the beam size, while the black line indicates the linear scale at the source’s redshift. Contours increase in steps of two starting from 1.2, 4, 0.6, 1.5, 0.5 times the noise level in each map, from top left to bottom, respectively. |
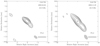 |
Fig. A.5. Full-resolution images of PKS 1549−79. The gray ellipse represents the beam size, while the black line indicates the linear scale at the source’s redshift. Contours increase in steps of two starting from 1.2, 3 times the noise level in each map, from left to right, respectively. |
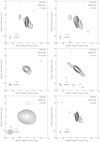 |
Fig. A.6. Full-resolution images of PKS 1733−56. The gray ellipse represents the beam size, while the black line indicates the linear scale at the source’s redshift. Contours increase in steps of two starting from 1.8 times the noise level in each map. |
 |
Fig. A.7. Full-resolution images of PKS 1733−56 (continued). The gray ellipse represents the beam size, while the black line indicates the linear scale at the source’s redshift. Contours increase in steps of two starting from 1.8 times the noise level in each map. |
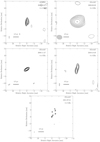 |
Fig. A.8. Full-resolution images of PKS 1814−63. The gray ellipse represents the beam size, while the black line indicates the linear scale at the source’s redshift. Contours increase in steps of two starting from 9, 22, 5, 12, 3 times the noise level in each map, from top left to bottom, respectively. |
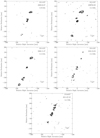 |
Fig. A.9. Tapered images of PKS 1814−63. The gray ellipse represents the beam size, while the black line indicates the linear scale at the source’s redshift. Contours increase in steps of two starting from 5, 9, 1.5, 9, 9 times the noise level in each map, from top left to bottom, respectively. |
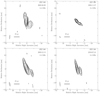 |
Fig. A.10. Full-resolution images of PKS 2027−308. The gray ellipse represents the beam size, while the black line indicates the linear scale at the source’s redshift. Contours increase in steps of two starting from 0.8, 0.3, 2, 1 times the noise level in each map, from top left to bottom, respectively. |
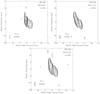 |
Fig. A.11. Full-resolution images of PKS 2027−308. The gray ellipse represents the beam size, while the black line indicates the linear scale at the source’s redshift. Contours increase in steps of two starting from 1, 1.8, 2.2 times the noise level in each map, from top left to bottom, respectively. |
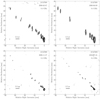 |
Fig. A.12. Full-resolution images of PKS 2153−69. The gray ellipse represents the beam size, while the black line indicates the linear scale at the source’s redshift. Contours increase in steps of two starting from 0.6, 0.6, 1.3, 1.3 times the noise level in each map, from top left to bottom, respectively. |
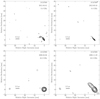 |
Fig. A.13. Full-resolution images of PKS 2153−69. The gray ellipse represents the beam size, while the black line indicates the linear scale at the source’s redshift. Contours increase in steps of two starting from 1.3, 2, 1.3, 1.5 times the noise level in each map, from top left to bottom, respectively. |
Details of the 8.4 GHz TANAMI observations of PKS 1258−321.
Details of the 8.4 GHz TANAMI observations of IC 4296.
Details of the 8.4 GHz TANAMI observations of PKS 1549−790.
Details of the 8.4 GHz TANAMI observations of PKS 1733−565.
Details of the 8.4 GHz TANAMI observations of PKS 1814−63.
Details of the 8.4 GHz TANAMI observations of PKS 2027−308.
Details of the 8.4 GHz TANAMI observations of PKS 2153−69.
Appendix B: Extended kinematic analysis information
Here we include additional information illustrating the results of our kinematic analysis of the multi-epoch TANAMI data. Figures B.1–B.6 show the multi-epoch images of TANAMI radio galaxies, with the corresponding component identification and tracking. We note that, for ease of representation, the distance between the images at different epochs is always constant, and therefore does not represent the time difference between each image pair. Moreover, the colored lines are not fits to the displayed component positions, but simple interpolations meant to clarify the identification and tracking of the different components. The evolution of the flux of modeled Gaussian components with time is showin in Fig. B.7.
 |
Fig. B.1. Multi-epoch tapered images of 1258−321. |
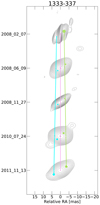 |
Fig. B.2. Multi-epoch tapered images of 1333−337. |
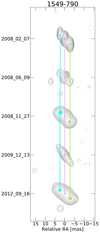 |
Fig. B.3. Multi-epoch tapered images of 1549−790.s |
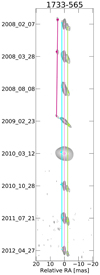 |
Fig. B.4. Multi-epoch tapered images of 1733−565. |
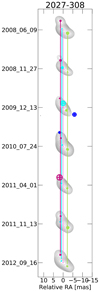 |
Fig. B.5. Multi-epoch tapered images of 2027−308. |
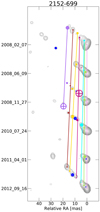 |
Fig. B.6. Multi-epoch tapered images of 2152−699. |
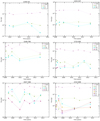 |
Fig. B.7. Plots of flux of modeled Gaussian components versus time. |
Tables B.1–B.6 list the flux density, radial distance, position angle, and size for each circular Gaussian component identified in each source during the kinematic analysis. All components have been shifted so that the core position is always at (0, 0) coordinates in all epochs. The position angle is given in the range (π, −π), with the zero in the N−S direction (in image coordinates) and positive values in the counter-clockwise direction. Components that were not identified (blue crossed circles in Figs. B.1–B.6) are not listed. An apparent speed was fitted only for components detected in at least five epochs.
Difmap Modelfit parameters for the Gaussian components model of the TANAMI 8.4 GHz images of PKS 1258−321.
Difmap Modelfit parameters for the Gaussian components model of the TANAMI 8.4 GHz images of IC 4296.
Difmap Modelfit parameters for the Gaussian components model of the TANAMI 8.4 GHz images of PKS 1549−79.
Difmap Modelfit parameters for the Gaussian components model of the TANAMI 8.4 GHz images of PKS 1733−565.
Difmap Modelfit parameters for the Gaussian components model of the TANAMI 8.4 GHz images of PKS 2027−308.
Difmap Modelfit parameters for the Gaussian components model of the TANAMI 8.4 GHz images of PKS 2153−69.
All Tables
Correlation coefficients between radio and γ-ray properties of our radio galaxy sample, and corresponding significance.
Difmap Modelfit parameters for the Gaussian components model of the TANAMI 8.4 GHz images of PKS 1258−321.
Difmap Modelfit parameters for the Gaussian components model of the TANAMI 8.4 GHz images of IC 4296.
Difmap Modelfit parameters for the Gaussian components model of the TANAMI 8.4 GHz images of PKS 1549−79.
Difmap Modelfit parameters for the Gaussian components model of the TANAMI 8.4 GHz images of PKS 1733−565.
Difmap Modelfit parameters for the Gaussian components model of the TANAMI 8.4 GHz images of PKS 2027−308.
Difmap Modelfit parameters for the Gaussian components model of the TANAMI 8.4 GHz images of PKS 2153−69.
All Figures
|
Fig. 1. First-epoch 8.4 GHz contour maps of γ-ray-faint TANAMI radio galaxies. The gray ellipse in the bottom left of each panel indicates the convolving beam, while the black bar shows the linear scale. The full set of multi-epoch images and the associated map parameter tables are presented in Appendix A. |
| In the text | |
|
Fig. 2. Spectral index map of IC 4296 between 8.4 GHz and 22.3 GHz for epoch 2008-02-07. The black contours are from the 8.4 GHz image. Both maps were convolved with a common beam that is represented in gray in the lower left corner. |
| In the text | |
|
Fig. 3. Spectral index map of PKS 1549−79 between 8.4 GHz and 22.3 GHz for epoch 2008-11-27. The black contours are from the 8.4 GHz image. Both maps were convolved with a common beam that is represented in gray in the lower left corner. |
| In the text | |
|
Fig. 4. Spectral index map of PKS 1733−565 between 8.4 GHz and 22.3 GHz for epoch 2008-02-07. The black contours are from the 8.4 GHz image. Both maps were convolved with a common beam that is represented in gray in the lower left corner. |
| In the text | |
|
Fig. 5. Spectral index map of PKS 2153−69 between 8.4 GHz and 22.3 GHz for epoch 2008-11-27. The black contours are from the 8.4 GHz image. Both maps were convolved with a common beam that is represented in gray in the lower left corner. |
| In the text | |
|
Fig. 6. Jet kinematics of our radio galaxies with core distance of jet features as a function of time. The solid lines represent a least squares fit to their positions (the slope is the apparent speed). |
| In the text | |
|
Fig. 7. Parameter space of intrinsic jet speed β and viewing angle θ allowed by our observations. The blue shaded area is the one allowed by the measurement of R, while the red shaded area is the one allowed by the observed βapp. When possible, we provide a minimum, maximum, and a central estimate of R and βapp. The top-right legend reports the resulting limits on θ and β. |
| In the text | |
|
Fig. 8. Apparent velocity of components in the jet of PKS 2153−69 as a function of average core distance. A clear linear increasing trend is seen, indicating downstream acceleration. The de-projected linear core distance has been calculated assuming the maximum possible viewing angle of ∼27° (see the lower panel of Fig. 7). The topmost x-axis is in units of Schwarzschild radii (Rs). |
| In the text | |
|
Fig. 9. Top panel: map of excess TS in the inner region of the ROI centered on PKS 1258−321, after removing the unidentified catalog source 3FGL J1259.5−3231 from the model. Bottom panel: residual excess TS map after modeling and localizing the new source PS J1259.7−3223. Both panels: The cyan cross represents the radio position of PKS 1258−321. The yellow cross represents the position of NVSS J125949−322329. The yellow ellipses represent the 68% and 95% positional uncertainties from the catalog for 3FGL J1259.5−3231. The cyan circles represent the 68% and 95% positional uncertainties for the new source PS J1259.7−3223. The map radius is 0.8°. Each pixel corresponds to 0.1°. |
| In the text | |
|
Fig. 10. Top panel: map of excess TS in the inner region of the ROI centered on PKS 2153−69, after removing the unidentified catalog source 3FGL J2200.0−6930 from the model. Bottom panel: residual excess TS map after modeling and localizing the new source PS J2200.5−6930. Both panels: The cross represents the radio position of PKS 2153−69. The yellow ellipses represent the 68% and 95% positional uncertainties from the catalog for 3FGL J2200.0−6930. The cyan circles represent the 68% and 95% positional uncertainties for the new source PS J2200.5−6930. The blue (top) and red (bottom) circles represent the 68% and 95% positional uncertainties for the new source PS J2152.0−6956. The map radius is 1°. Each pixel corresponds to 0.1°. |
| In the text | |
|
Fig. 11. Histograms of radio VLBI properties for LAT-detected (green vertical hatch) and undetected radio galaxies (red slashed hatch) from the MOJAVE and TANAMI monitoring programs. Top left: maximum measured apparent speed. Top right: median VLBI core flux density. Center left: median logarithmic VLBI jet flux density. Center right: median logarithmic VLBI core luminosity. Bottom left: median logarithmic core brightness temperature. Bottom right: median VLBI core dominance. |
| In the text | |
|
Fig. 12. Top left: maximum observed apparent speed as a function of total VLBI luminosity. Top right: Fermi-LAT flux as a function of average VLBI core flux. Center left: Fermi-LAT flux as a function of average VLBI jet flux. Center right: average VLBI core brightness temperature as a function of Fermi-LAT luminosity. Center bottom: Fermi-LAT luminosity as a function of average VLBI core dominance. |
| In the text | |
|
Fig. A.1. Full-resolution images of PKS 1258−321. The map parameters for each epoch can be found in Table A.1. The gray ellipse represents the beam size, while the black line indicates the linear scale at the source’s redshift. Contours increase in steps of two starting from 0.5, 0.8, 0.8, 1, 0.8 times the noise level in each map, from top left to bottom, respectively. |
| In the text | |
|
Fig. A.2. Full-resolution images of IC 4296. The gray ellipse represents the beam size, while the black line indicates the linear scale at the source’s redshift. Contours increase in steps of two starting from 2, 2, 3, 3, 3 times the noise level in each map, from top left to bottom, respectively. |
| In the text | |
|
Fig. A.3. Full-resolution images of IC 4296. The gray ellipse represents the beam size, while the black line indicates the linear scale at the source’s redshift. Contours increase in steps of two starting from 3, 1 times the noise level in each map, from left to right, respectively. |
| In the text | |
|
Fig. A.4. Full-resolution images of PKS 1549−79. The gray ellipse represents the beam size, while the black line indicates the linear scale at the source’s redshift. Contours increase in steps of two starting from 1.2, 4, 0.6, 1.5, 0.5 times the noise level in each map, from top left to bottom, respectively. |
| In the text | |
|
Fig. A.5. Full-resolution images of PKS 1549−79. The gray ellipse represents the beam size, while the black line indicates the linear scale at the source’s redshift. Contours increase in steps of two starting from 1.2, 3 times the noise level in each map, from left to right, respectively. |
| In the text | |
|
Fig. A.6. Full-resolution images of PKS 1733−56. The gray ellipse represents the beam size, while the black line indicates the linear scale at the source’s redshift. Contours increase in steps of two starting from 1.8 times the noise level in each map. |
| In the text | |
|
Fig. A.7. Full-resolution images of PKS 1733−56 (continued). The gray ellipse represents the beam size, while the black line indicates the linear scale at the source’s redshift. Contours increase in steps of two starting from 1.8 times the noise level in each map. |
| In the text | |
|
Fig. A.8. Full-resolution images of PKS 1814−63. The gray ellipse represents the beam size, while the black line indicates the linear scale at the source’s redshift. Contours increase in steps of two starting from 9, 22, 5, 12, 3 times the noise level in each map, from top left to bottom, respectively. |
| In the text | |
|
Fig. A.9. Tapered images of PKS 1814−63. The gray ellipse represents the beam size, while the black line indicates the linear scale at the source’s redshift. Contours increase in steps of two starting from 5, 9, 1.5, 9, 9 times the noise level in each map, from top left to bottom, respectively. |
| In the text | |
|
Fig. A.10. Full-resolution images of PKS 2027−308. The gray ellipse represents the beam size, while the black line indicates the linear scale at the source’s redshift. Contours increase in steps of two starting from 0.8, 0.3, 2, 1 times the noise level in each map, from top left to bottom, respectively. |
| In the text | |
|
Fig. A.11. Full-resolution images of PKS 2027−308. The gray ellipse represents the beam size, while the black line indicates the linear scale at the source’s redshift. Contours increase in steps of two starting from 1, 1.8, 2.2 times the noise level in each map, from top left to bottom, respectively. |
| In the text | |
|
Fig. A.12. Full-resolution images of PKS 2153−69. The gray ellipse represents the beam size, while the black line indicates the linear scale at the source’s redshift. Contours increase in steps of two starting from 0.6, 0.6, 1.3, 1.3 times the noise level in each map, from top left to bottom, respectively. |
| In the text | |
|
Fig. A.13. Full-resolution images of PKS 2153−69. The gray ellipse represents the beam size, while the black line indicates the linear scale at the source’s redshift. Contours increase in steps of two starting from 1.3, 2, 1.3, 1.5 times the noise level in each map, from top left to bottom, respectively. |
| In the text | |
|
Fig. B.1. Multi-epoch tapered images of 1258−321. |
| In the text | |
|
Fig. B.2. Multi-epoch tapered images of 1333−337. |
| In the text | |
|
Fig. B.3. Multi-epoch tapered images of 1549−790.s |
| In the text | |
|
Fig. B.4. Multi-epoch tapered images of 1733−565. |
| In the text | |
|
Fig. B.5. Multi-epoch tapered images of 2027−308. |
| In the text | |
|
Fig. B.6. Multi-epoch tapered images of 2152−699. |
| In the text | |
|
Fig. B.7. Plots of flux of modeled Gaussian components versus time. |
| In the text | |
Current usage metrics show cumulative count of Article Views (full-text article views including HTML views, PDF and ePub downloads, according to the available data) and Abstracts Views on Vision4Press platform.
Data correspond to usage on the plateform after 2015. The current usage metrics is available 48-96 hours after online publication and is updated daily on week days.
Initial download of the metrics may take a while.