Fig. 11.
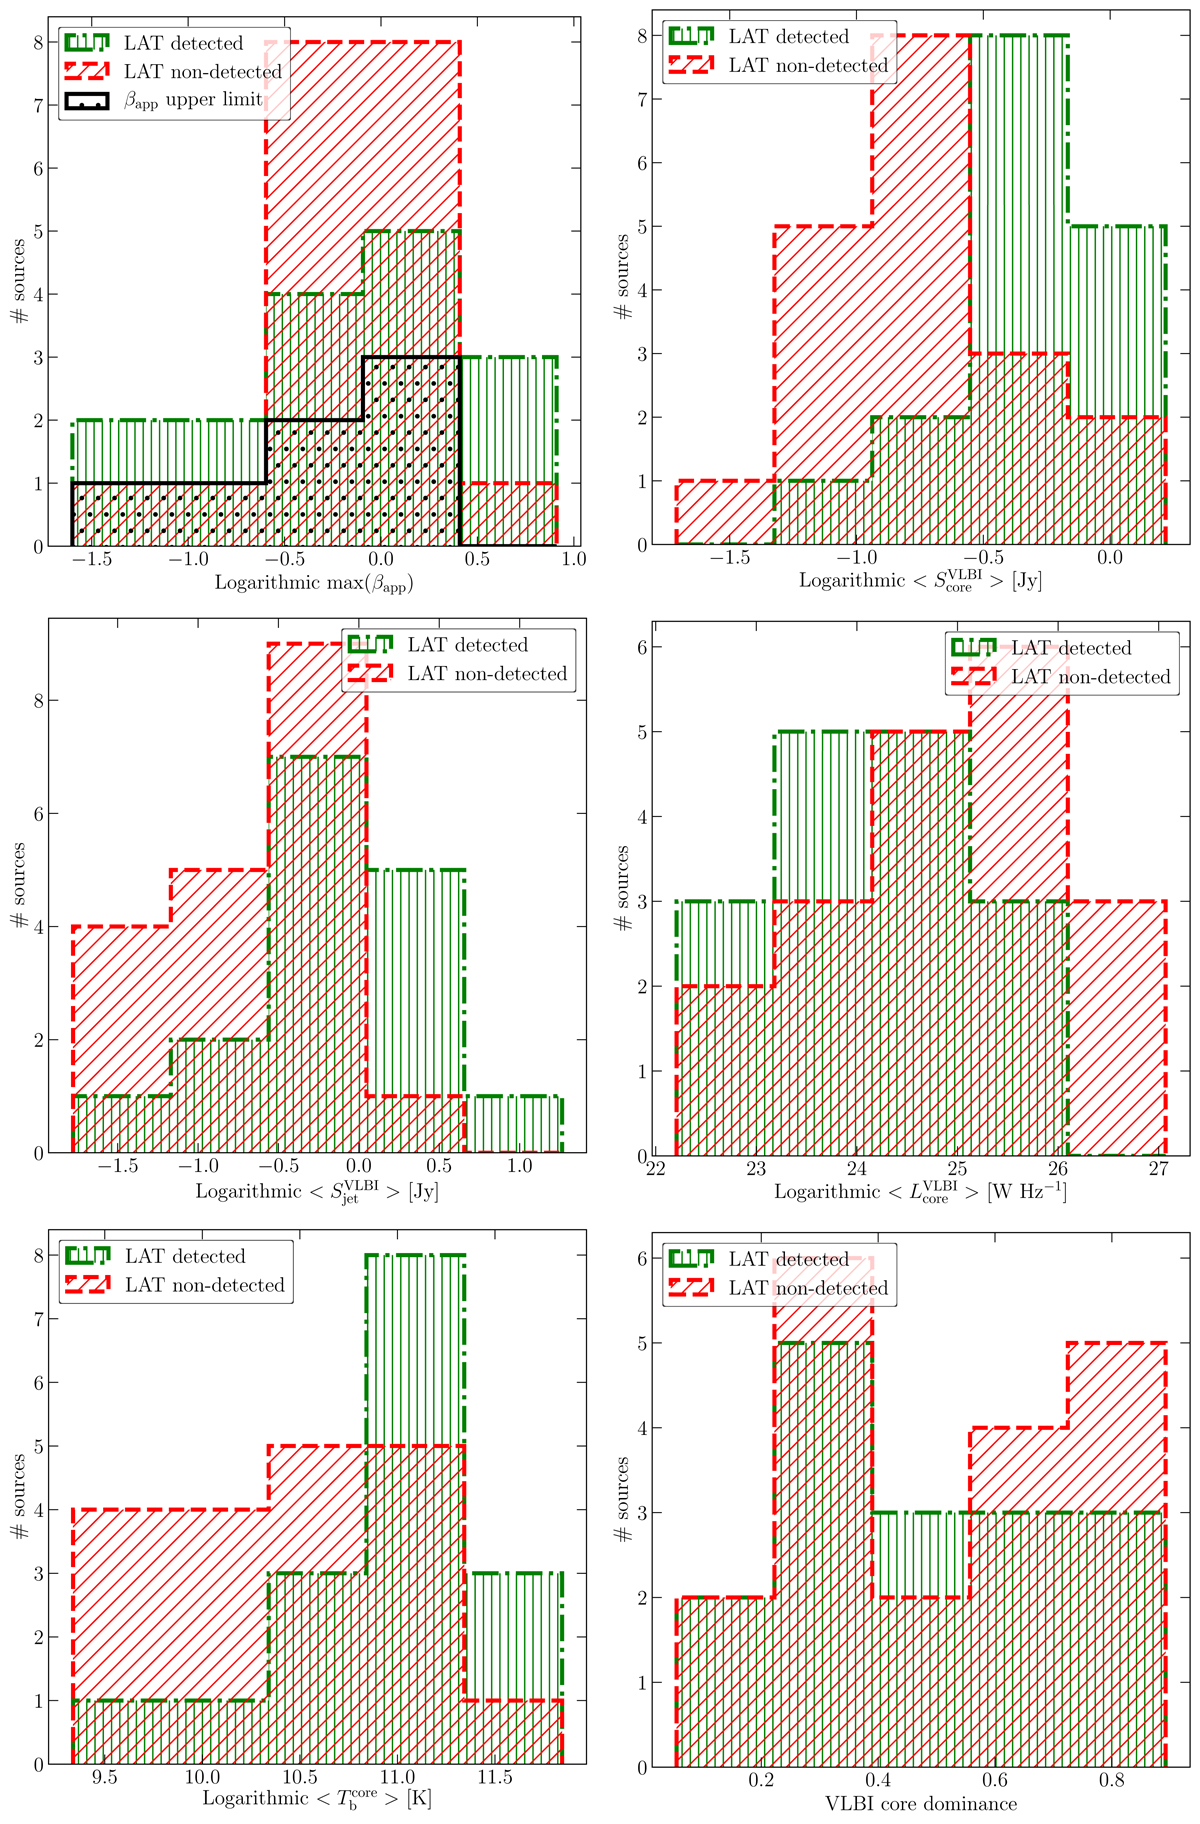
Histograms of radio VLBI properties for LAT-detected (green vertical hatch) and undetected radio galaxies (red slashed hatch) from the MOJAVE and TANAMI monitoring programs. Top left: maximum measured apparent speed. Top right: median VLBI core flux density. Center left: median logarithmic VLBI jet flux density. Center right: median logarithmic VLBI core luminosity. Bottom left: median logarithmic core brightness temperature. Bottom right: median VLBI core dominance.
Current usage metrics show cumulative count of Article Views (full-text article views including HTML views, PDF and ePub downloads, according to the available data) and Abstracts Views on Vision4Press platform.
Data correspond to usage on the plateform after 2015. The current usage metrics is available 48-96 hours after online publication and is updated daily on week days.
Initial download of the metrics may take a while.