Free Access
Fig. A.12.
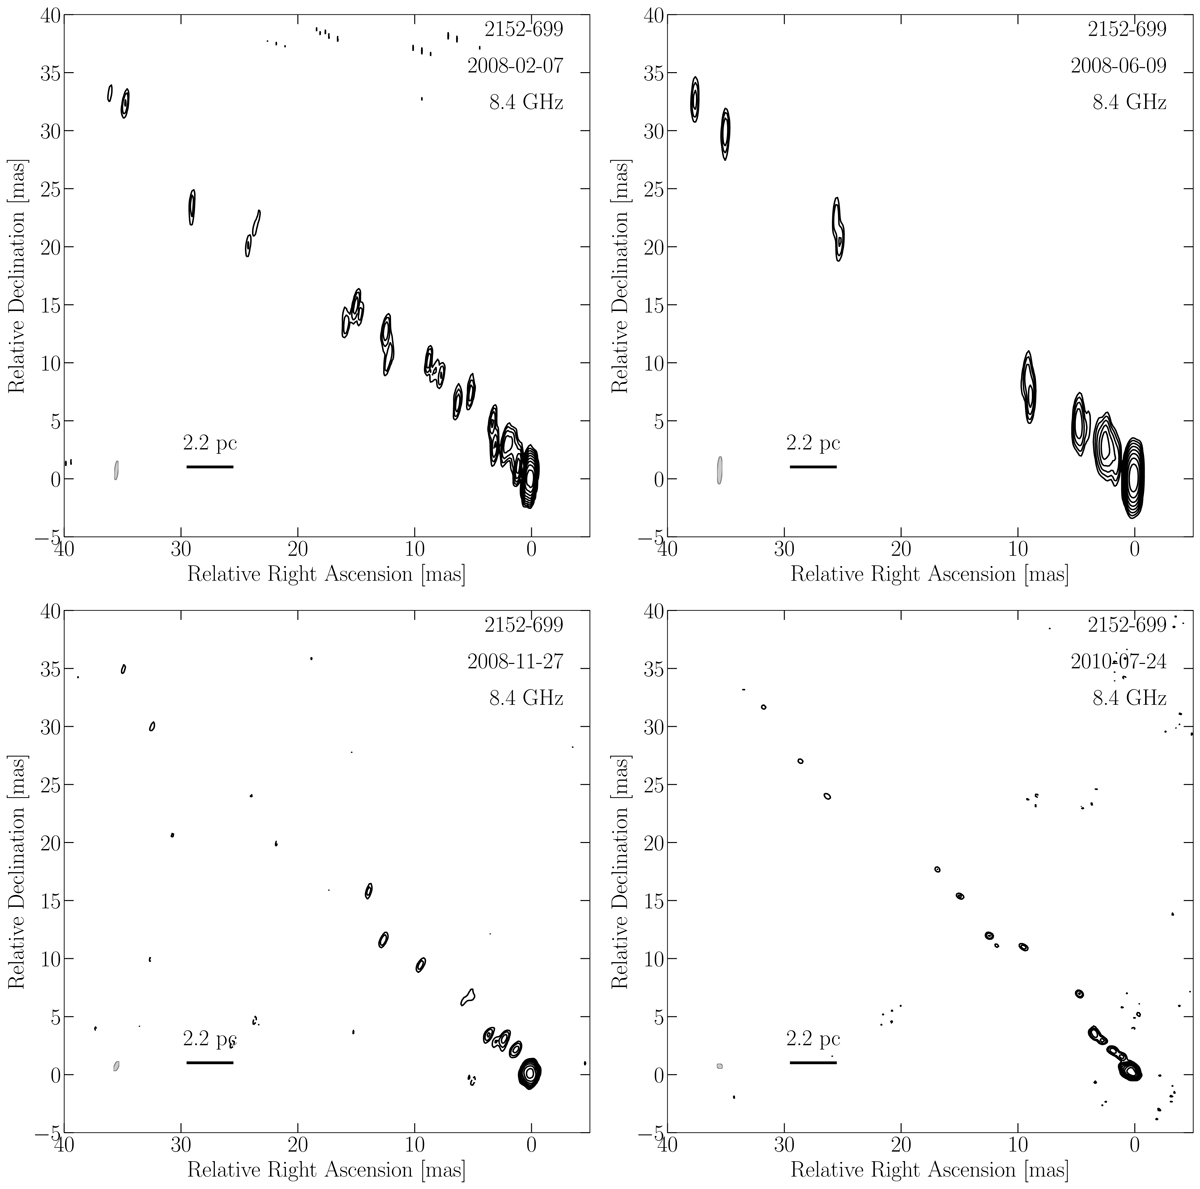
Full-resolution images of PKS 2153−69. The gray ellipse represents the beam size, while the black line indicates the linear scale at the source’s redshift. Contours increase in steps of two starting from 0.6, 0.6, 1.3, 1.3 times the noise level in each map, from top left to bottom, respectively.
Current usage metrics show cumulative count of Article Views (full-text article views including HTML views, PDF and ePub downloads, according to the available data) and Abstracts Views on Vision4Press platform.
Data correspond to usage on the plateform after 2015. The current usage metrics is available 48-96 hours after online publication and is updated daily on week days.
Initial download of the metrics may take a while.