Fig. 12.
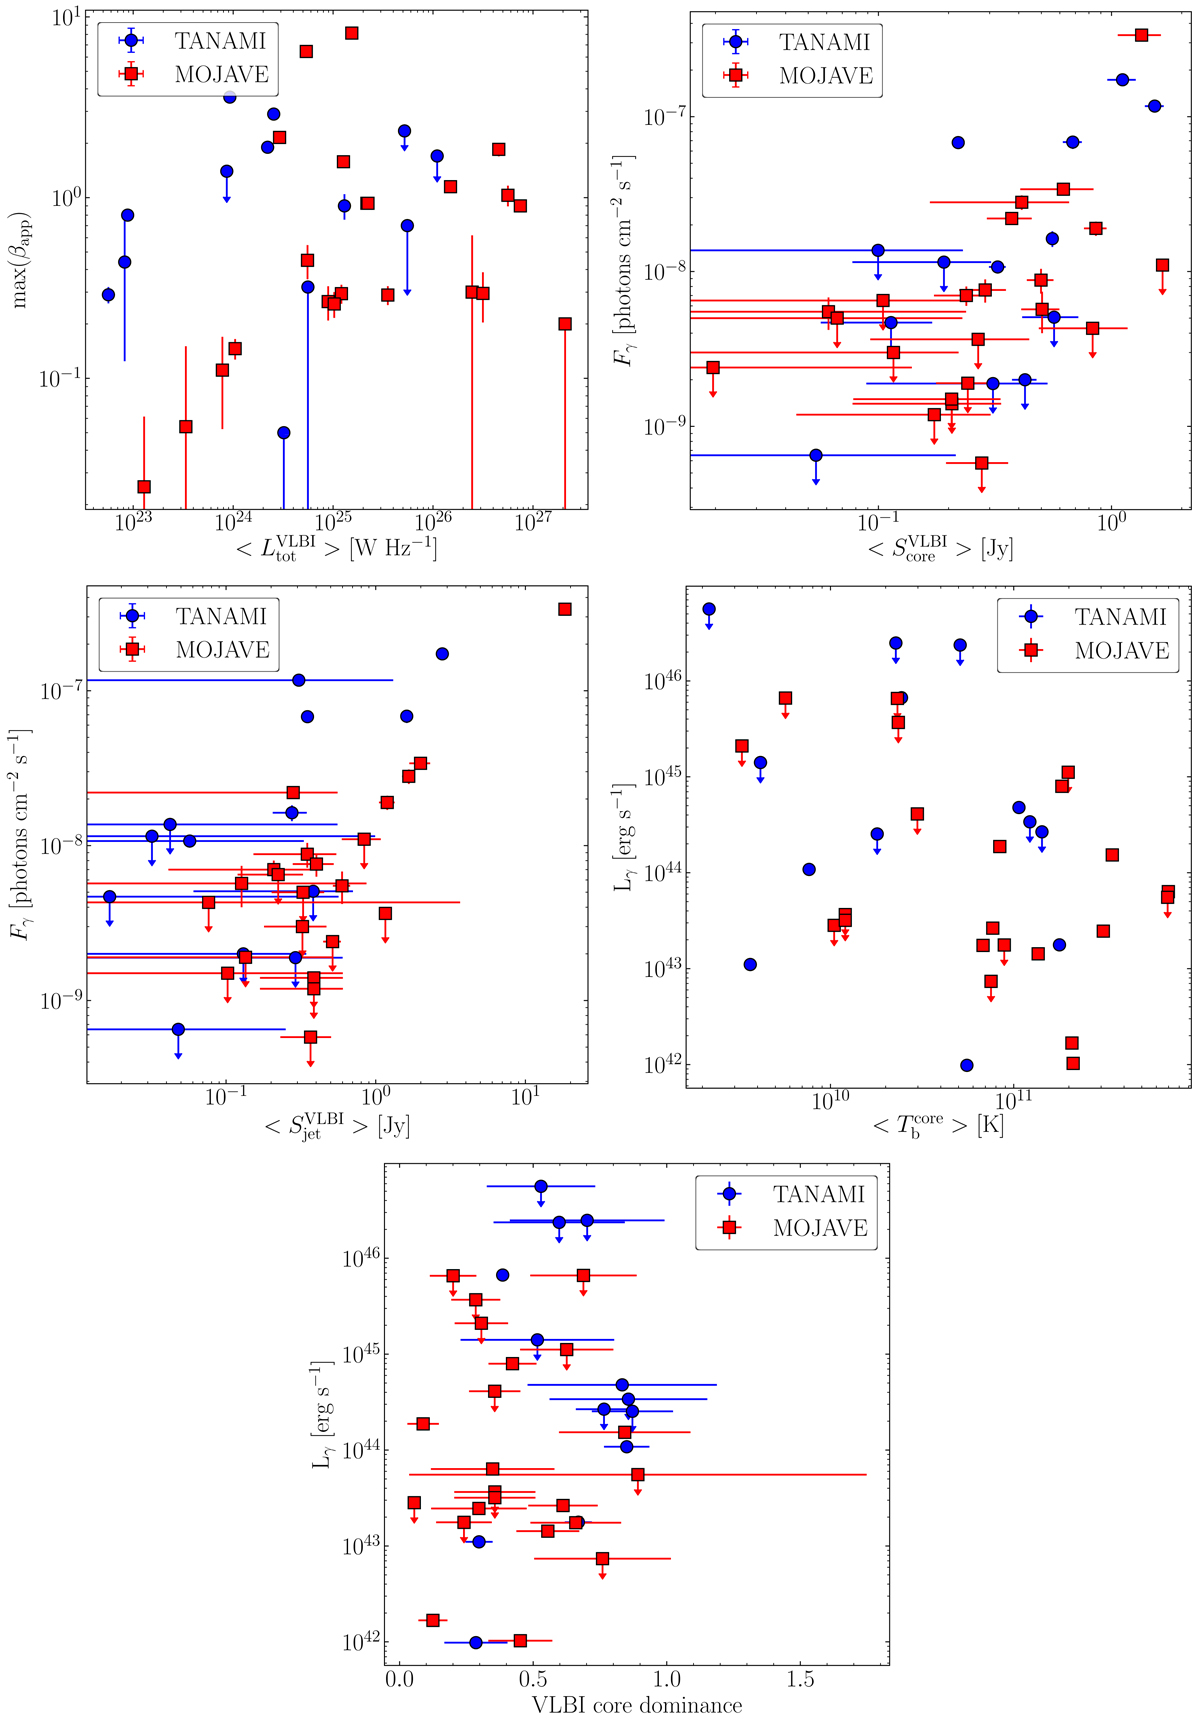
Top left: maximum observed apparent speed as a function of total VLBI luminosity. Top right: Fermi-LAT flux as a function of average VLBI core flux. Center left: Fermi-LAT flux as a function of average VLBI jet flux. Center right: average VLBI core brightness temperature as a function of Fermi-LAT luminosity. Center bottom: Fermi-LAT luminosity as a function of average VLBI core dominance.
Current usage metrics show cumulative count of Article Views (full-text article views including HTML views, PDF and ePub downloads, according to the available data) and Abstracts Views on Vision4Press platform.
Data correspond to usage on the plateform after 2015. The current usage metrics is available 48-96 hours after online publication and is updated daily on week days.
Initial download of the metrics may take a while.