Fig. 9.
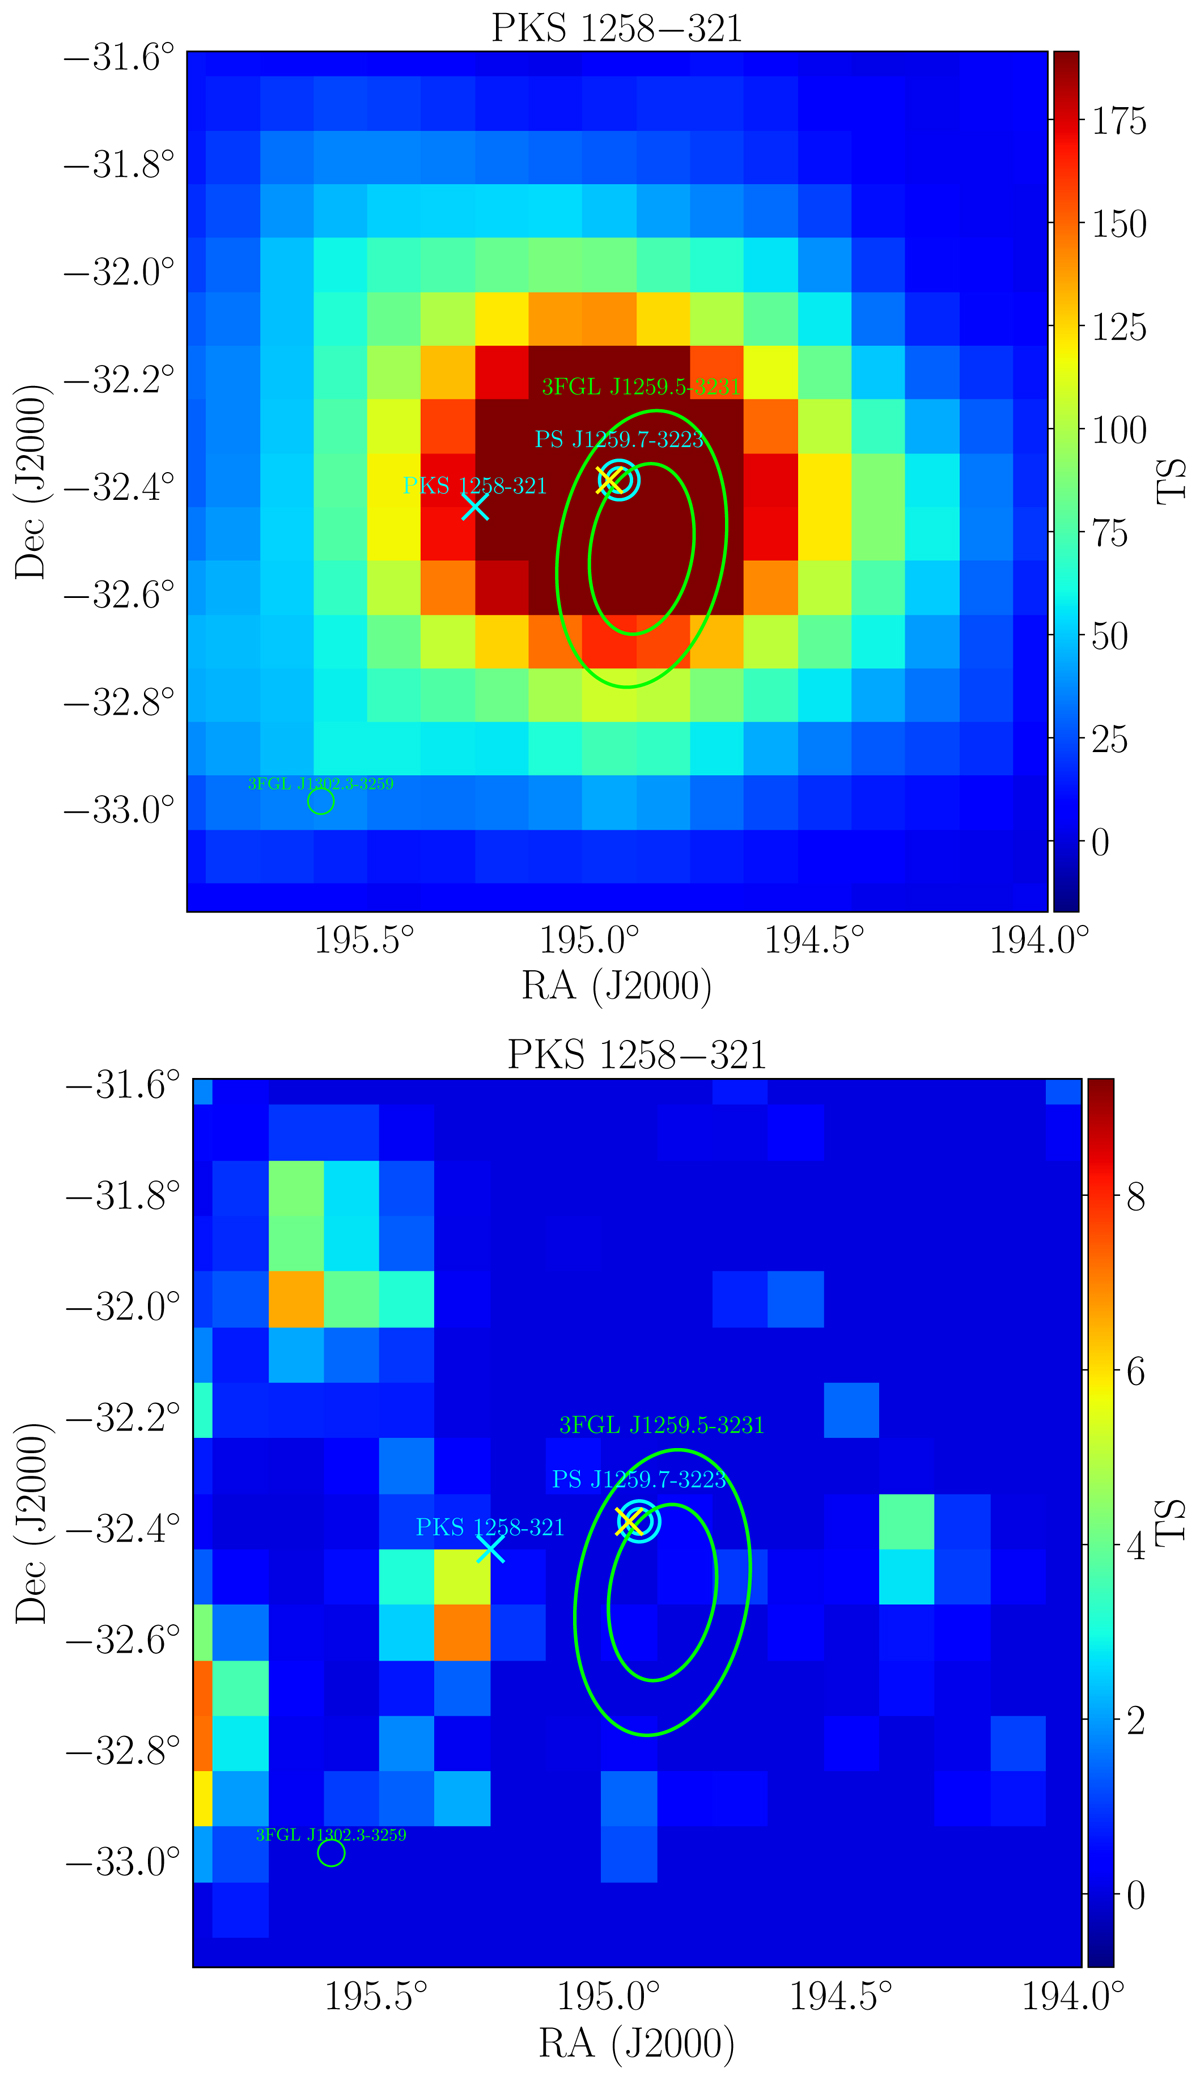
Top panel: map of excess TS in the inner region of the ROI centered on PKS 1258−321, after removing the unidentified catalog source 3FGL J1259.5−3231 from the model. Bottom panel: residual excess TS map after modeling and localizing the new source PS J1259.7−3223. Both panels: The cyan cross represents the radio position of PKS 1258−321. The yellow cross represents the position of NVSS J125949−322329. The yellow ellipses represent the 68% and 95% positional uncertainties from the catalog for 3FGL J1259.5−3231. The cyan circles represent the 68% and 95% positional uncertainties for the new source PS J1259.7−3223. The map radius is 0.8°. Each pixel corresponds to 0.1°.
Current usage metrics show cumulative count of Article Views (full-text article views including HTML views, PDF and ePub downloads, according to the available data) and Abstracts Views on Vision4Press platform.
Data correspond to usage on the plateform after 2015. The current usage metrics is available 48-96 hours after online publication and is updated daily on week days.
Initial download of the metrics may take a while.