| Issue |
A&A
Volume 641, September 2020
|
|
|---|---|---|
| Article Number | A95 | |
| Number of page(s) | 16 | |
| Section | Extragalactic astronomy | |
| DOI | https://doi.org/10.1051/0004-6361/201936098 | |
| Published online | 15 September 2020 | |
NGC 4104: A shell galaxy in a forming fossil group⋆
1
Instituto de Astronomia, Geofísica e Ciências Atmosféricas, Universidade de São Paulo, Rua do Matão 1226, São Paulo, Brazil
e-mail: This email address is being protected from spambots. You need JavaScript enabled to view it.
2
Sorbonne Université, CNRS, UMR 7095, Institut d’Astrophysique de Paris, 98bis Bd Arago, 75014 Paris, France
3
Núcleo de Astrofísica, Universidade Cruzeiro do Sul/Universidade Cidade de São Paulo, R. Galvão Bueno 868, Liberdade, São Paulo, SP 01506-000, Brazil
4
Departamento Acadêmico de Física, Universidade Tecnológica Federal do Paraná, Rua Sete de Setembro 3165, Curitiba, Brazil
5
Aix Marseille Univ, CNRS, CNES, LAM, Marseille, France
6
IRFU, CEA, Université Paris-Saclay, Université Paris Diderot, AIM, Sorbonne Paris Cité, CEA, CNRS, Observatoire de Paris, PSL Research University, 91191 Gif-sur-Yvette Cedex, France
Received:
13
June
2019
Accepted:
24
June
2020
Abstract
Context. Groups are the most common association of galaxies in the Universe and they are found in different configuration states, such as loose, compact, and fossil groups.
Aims. We studied the galaxy group MKW 4s, dominated by the giant early-type galaxy NGC 4104 at z = 0.0282, with the aim of understanding the evolutionary stage of this group and to place it within the framework of the standard ΛCDM cosmological scenario.
Methods. We obtained deep optical data with CFHT/Megacam (g and r bands) and we applied both the GALFIT 2D image fitting program and the IRAF/ELLIPSE 1D radial method to model the brightest group galaxy (BGG) and its extended stellar envelope. We also analysed the publicly available XMM-Newton and Chandra X-ray data. From N-body simulations of dry-mergers with different mass ratios of the infalling galaxy, we were able to constrain the dynamical stage of this system.
Results. Our results show a stellar shell system feature in NGC 4104 and an extended envelope that was reproduced by our numerical simulations of a collision with a satellite galaxy taking place about 4−6 Gyr ago. The initial pair of galaxies had a mass ratio of at least 1:3. Taking into account the stellar envelope contribution to the total r band magnitude and the X-ray luminosity, MKW 4s falls into the category of a fossil group.
Conclusions. Our results show that we are witnessing a rare case of a shell elliptical galaxy in a forming fossil group.
Key words: galaxies: individual: NGC 4104 / galaxies: groups: general / galaxies: photometry / X-rays: galaxies / methods: numerical
Reduced optical images in g and r bands are only available at the CDS via anonymous ftp to cdsarc.u-strasbg.fr (130.79.128.5) or via http://cdsarc.u-strasbg.fr/viz-bin/cat/J/A+A/641/A95
© ESO 2020
1. Introduction
According to our current understanding of a cold dark matter and dark energy dominated universe, large-scale structure is built up hierarchically. There is a gradual assembly of mass in a process that we observe on many different scales (e.g. Diemand & Moore 2011). At the super-cluster scale, gravitational collapse is an ongoing process, which still remains in the linear phase (Dünner et al. 2006; O’Mill et al. 2015).
On the other hand, smaller structures such as galaxies and groups of galaxies are already collapsed structures, most of them remaining in quasi-equilibrium, but still accreting mass at a very low rate. In our own Galaxy, we observe the stellar streams that have probably borne witnesses to past and current accretion (Helmi et al. 1999).
In groups of galaxies, the typical velocity dispersion is of the order of the stellar velocity dispersion inside the galaxy members. Therefore, collisions followed by mergers are among the most important phenomena that drive galaxy evolution in these environments. These often build up through merger events, leaving behind morphological features such as tidal streams, stellar shells, rings, and plumes. One bit of evidence for galactic cannibalism is the feature known as shells or ripples in early-type galaxies (Malin & Carter 1980; Quinn 1984; Athanassoula & Bosma 1985). The first comprehensive catalogue of shell galaxies was compiled by Malin & Carter (1983), who identified 137 galaxies with shells. Shells are concentric interleaved ripples that appear on both sides of the galaxy centre extending to large galactocentric distances.
Although some spiral galaxies reveal the presence of a low surface brightness stellar shell (e.g. Martínez-Delgado et al. 2010; de Blok et al. 2014), shells appear to be more common in red early-type galaxies than in blue galaxies (14% against 6% according to Atkinson et al. 2013) and they are, therefore, more commonly detected in massive early-type galaxies (galaxies with stellar mass greater than 1010.5 M⊙, cf., Malin & Carter 1983; Schweizer & Thonnard 1985; Tal et al. 2009).
Several mechanisms for the origin of shells have been proposed over the last decades. The most widely accepted formation scenario advocates that shells are tidal features derived from the result of a minor merger of a smaller galaxy with an elliptical galaxy (see, e.g. recent studies by Amorisco 2015; Hendel & Johnston 2015), resulting in a series of faint concentric ripples in surface brightness observed throughout the main stellar component.
Extensive analytical and numerical work lends support to the merger scenario, in which shells are the outcome of the process of hierarchical assembly. They have also been seen in the context of ΛCDM cosmological simulations (see, e.g. Cooper et al. 2010, 2011). Out of the most massive galaxies in the Illustris simulation, 39 galaxies in a sample of 220 massive ellipticals exhibit shells (Pop et al. 2018). These simulations also confirm that shells in massive galaxies form through mergers with massive satellites. More specifically, mergers with stellar mass ratios, μstar > 1 : 10.
Any material falling into and passing through a galaxy tends to spend more time in the outer region than in the centre (since its velocity will be higher at the centre). Therefore, the outer regions of galaxies should be the locus for assembly clues. Tidal features, and among them shell-like structures, provide a powerful tool for studying both the structure and accretion histories of galaxies (Martínez-Delgado et al. 2012; Romanowsky et al. 2012; Foster et al. 2014; Amorisco 2015; Longobardi et al. 2015). For instance, the number and distribution of shells could be considered to constrain the mass distribution of the host galaxy, as well as the timing of the merger event itself (Quinn 1984; Dupraz & Combes 1986; Canalizo et al. 2007; Duc 2016). Also, the most extreme examples of ongoing assembly are expected to be the brightest cluster and group galaxies, which reside in the centre of clusters and groups and are expected to involve very active merger histories (Ruszkowski & Springel 2009). We can also study the dynamics of shell galaxies to date the last merging and physical processes that could be related to that event. For instance, Ebrová et al. (2020) used an N-body modelling of NGC 4993 (a shell galaxy) in order to estimate a lower limit for the age of the neutron star binary system that may have been responsible for the short gamma-ray burst observed in 2017.
As far as fossil groups are concerned, observations both in X-rays (Adami et al. 2018) and at optical wavelengths (Santos et al. 2007; La Barbera et al. 2009; Girardi et al. 2014) have led to the idea that these objects are the result of a large dynamical activity at high redshift, located in a large-scale environment that is too poor to evolve into a cluster. However, Kim et al. (2018) found that the NGC 1132 fossil group had a disturbed asymmetrical X-ray profile, suggesting dynamical activity. This also seems to be the case in the NGC 4104 fossil group that we are studying here, as derived from the presence of shells around the central brightest galaxy detected here for the first time. Therefore, the study of fossil groups showing traces of recent or ongoing dynamical evolution is important to illustrate the fact that some structures considered “fossils” may still be fully “alive”.
Detecting shells remains challenging specially due to their low surface brightness levels. There are a few tens of known shell galaxies, but NGC 4104 is not yet among them (Fig. 1). Located at 12:06:38.9, +28:10:27 (J2000), it is the brightest galaxy of the X-ray emitting group MKW 4s1 (Morgan et al. 1975; Koranyi & Geller 2002), showing shell features and an extended stellar halo. This galaxy is at redshift z = 0.02816 (from SDSS2 spectroscopy) and has been studied at many wavelengths (Mulchaey et al. 1996; Lin & Mohr 2004; O’Dea et al. 2008; Quillen et al. 2008), and its optical SDSS spectrum shows strong Hα and [NII] lines (i.e. unusually strong for an elliptical galaxy), but very weak [OIII] lines, suggesting that there is star-forming activity in NGC 4104 and that if an active galactic nucleus (AGN) is present, it must be very weak.
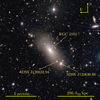 |
Fig. 1. Centre of the MKW 4s group, showing NGC 4104 and two of the main galaxies which are on the line-of-sight of the extended stellar envelope. This is a composite CFHT/Megacam image which combines two bands, g and r (see text), with size 16 × 16 arcmin2 ( |

Also shown in Fig. 1, the second brightest galaxy, SDSS J120630.86+280816.0, a red elliptical galaxy with an SDSS redshift z = 0.02968, and SDSS J120633.94+280837.5 at redshift z = 0.02543. These galaxies will also both be modelled in our 2D surface brightness fit.
However, none of the previous studies reported the shell-like features of NGC 4104 and its formation history considering that MKW 4s could be classified as a fossil group. The term fossil group was coined by Ponman et al. (1994) for an X-ray luminous group dominated by a bright elliptical galaxy. More precisely, Jones et al. (2003) define a group to be fossil when the difference in the R-band between the brightest and second brightest galaxies is larger than 2 mag, both galaxies being within half the group virial radius, and the X-ray luminosity being larger than  erg s−1. Such objects are viewed as evolved groups, in other words, “fossils” of a once dynamically active group of galaxies. To our knowledge, the only fossil group where shells have been detected around the central elliptical galaxy is that of NGC 1132 (Alamo-Martínez et al. 2012).
Thus, with deep r and g imaging obtained with the 3.6 m CFHT and X-ray publicly available data from the XMM-Newton and Chandra telescopes, our goal is to understand the evolutionary state of this group and to place it within the framework of the ΛCDM scenario of large-scale structure formation. N-body numerical simulations were performed to give support to our analysis, demonstrating that we are witnessing a rare case of a shell galaxy in a forming fossil group.
Our paper proceeds as follows. In Sect. 2 we describe theX-ray data and analysis. In Sect. 3 we describe the optical data and main results. The dynamical analysis, including N-body simulations of the substructure origins is explored in Sect. 4. In Sect. 5, we discuss MKW 4s as an example of an unusual disturbed fossil group and in Sect. 6, we summarise the findings of this study. We assume a standard ΛCDM cosmology: at the redshift of MKW 4s, the group luminosity distance is 123  Mpc, and 1 arcmin corresponds to
  kpc.
kpc.
2. X-ray analysis
2.1. X-ray data and data reduction
The MKW 4s group, also called the NGC 4104 group, has been observed in X-rays with various satellites: ROSAT (Dahlem & Thiering 2000), Chandra (Kim et al. 2019) and XMM-Newton (Laganá et al. 2013).
In this section, we describe the X-ray analysis. We used Chandra (OBSID 3234, PI David Buote), and XMM-Newton (OBSID 0301900401, PI Anna Wolter) publicly available observations that are shown in Fig. 2, in comparison with the optical image.
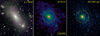 |
Fig. 2. Left: composite g-r image of NGC 4104 with X-ray Chandra contours overlaid. Middle: Chandra adaptively smoothed image in the [0.5–7.0 keV] band. Right: XMM-Newton merged MOS1, MOS2, and pn image in the same energy band as the Chandra image. The contours and colours of the X-ray images are in logarithmic scale. The circles on the images, with R = 25″ and 90″, correspond to the extraction regions for the spectral analysis. The overall shape of the X-ray emission follows the ellipticity of NGC 4104. We note that the two brightest galaxies on the stellar envelope to the southwest, SDSS J120633.94 and SDSS J120630.86, are themselves X-ray sources. |
MKW 4s was observed in a single ACIS-S pointing for 30 ks and faint diffuse X-ray emission is detectable to the very outskirts of the ACIS field of view. The Chandra data reduction was carried out applying the standard procedure as described in CIAO Threads pages3. The Chandra exposure-map corrected image was produced in the broad-band [0.5−7.0 keV] by the script merge_obs from CIAO.
The XMM-Newton data reduction was done with SAS version 20160201 and calibration files updated in September 2016. Background flares were identified and rejected by applying a 1.8σ clipping to the high-energy count rate histogram. We used the resulting “cleaned” exposure files to detect and exclude point sources from our analysis.
For both Chandra and XMM-Newton datasets, the spectral analysis was performed in the [0.5−7.0 keV] band. For the spectral fit, we applied XSPEC v12.9 and χ2 statistics, adopting an absorbed single temperature plasma model MEKAL (Kaastra & Mewe 1993; Liedahl et al. 1995), fixing the redshift and letting all the other parameters (temperature, metallicity, normalisation, and hydrogen column density) vary as free parameters. We adopted the solar metal abundances of Anders & Grevesse (1989).
2.2. X-ray results
In order to measure the gas mass and the total mass based on hydrostatic equilibrium, as well as the X-ray luminosity, we first need to determine the gas temperature and surface brightness radial profiles. We start by fitting both Chandra and XMM-Newton X-ray spectra in a central region (R < 25″, see Table 1), and then in an external annulus, in the region (25″ < R < 90″, see Table 2). Both flux and luminosity were computed using XSPEC, assuming no absorption (i.e. setting NH = 0).
X-ray spectral fits of the central, R < 25″ region.
X-ray spectral fits of the external region, 25″ < R < 90″ region.
The central region needs to be fitted by a two-temperature model in order to obtain an acceptable χ2, i.e. one that is comparable to the number of degrees of freedom of the fit. The fits with only one plasma component yielded a reduced-χ2 = 1.6 and 2.1 for Chandra and XMM-Newton spectra, respectively. This is probably due to the decrease in temperature in the inner cool-core region which can be mimicked by a two component plasma model. A cooling flow was indeed reported by Dahlem & Thiering (2000) based on ROSAT data, and a cool-core more recently by Kim et al. (2019), based on Chandra data. These two components are characterised by the indexes “1” and “2” in Table 1. The temperatures measured by Chandra and XMM-Newton agree well within the error bars, and combining both fits the resulting mean weighted temperatures are kT1 ≃ 0.74 keV and kT2 ≃ 1.5 keV, for the cooler and hotter components in the inner region. As seen in Table 1, the metallicity was fixed to solar in three of the fits, because the signal to noise ratio was not sufficient to let it free. The metallicity could be left free for Chandra component 2, but the large error bars show it is also consistent with being solar.
In the outer region, the mean temperature (using both Chandra and XMM-Newton) is  keV and the mean weighted metallicity is
  .
.
The temperature difference between the centre and the outer annulus confirms the previously quoted presence of a cool-core. Also, the possible difference in metallicity may suggest a gradient, but the error bars are too large for any meaningful conclusion.
Furthermore, we did a 2D fit of the X-ray intensity map using only the Chandra (exposure-corrected, [0.5−7.0 keV] band) image, since it has less artefacts (such as bad pixels and CCD gaps), better signal-to-noise ratio (S/N), and higher spatial resolution than the XMM-Newton image. For this fit we used the SHERPA package4 and modelled the diffuse X-ray emission with a β-model:
![Mathematical equation: $$ \begin{aligned} I(R) = I_0 \left[1 + (R/r_{\rm c})^2 \right]^{(0.5 - 3\beta )};\;R^2 = x^2 + { y}^2/(1-\varepsilon )^2, \end{aligned} $$](/articles/aa/full_html/2020/09/aa36098-19/aa36098-19-eq24.gif) (1)
(1)
where ε is the ellipticity, (1 − ε) = b/a, with a and b the major and minor semi-axes, respectively. The fit is done adding a flat background to the β-model. Table 3 shows the best-fit parameters.
Chandra [0.5–7.0 keV] image best-fit elliptical β-model parameters.
It is not surprising that we measured such a small core radius,  kpc, which reflects the central cusp in surface brightness, and thus in gas density, associated with cool-core clusters.
In order to determine the gas density radial profile, we need to calculate the central density of the hot plasma. This is done by normalising the expected emission from the gas distribution (in this case, a simple β-model) with the so-called emission measure,  , where ne and np are the electron and proton numerical density, respectively. The numerical factor corresponds to a metallicity Z = 0.36 Z⊙, the mean value obtained by combining XMM-Newton and Chandra measurements. We have thus normalised the best-fit elliptical β-model with the EM obtained from the spectral analysis. The EM is related to the spectrum normalisation used in XSPEC (the factor in front of the integral takes into account the gas metallicity). We considered the emission from an elliptical ring (with ellipticity ε = 0.25) between an inner radius of 25″ and an outer radius of 150″ where we compute the EM. This region is in fact somewhat arbitrary, as far as the surface brightness is well described by a β-model. Thus, we avoided the inner and outer regions where the surface brightness model may fail. The central numerical density obtained is n0 = (0.33 ± 0.05) cm−3. With the central density and assuming that ne follows a β-model (derived from the deprojection of Eq. (1)), we compute the integrated gas mass radial profile, which we show in Fig. 3.
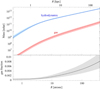 |
Fig. 3. Top: hot gas (red) and hydrodynamic (blue) mass profiles derived from X-ray data. Bottom: gas to total mass ratio. The coloured bands correspond to 1σ confidence limits. |
The total mass is computed by assuming the standard hydrostatic equilibrium hypothesis of the intra-group gas with the group gravitational potential, assuming elliptical symmetry and that the pressure is only thermal (e.g. Lea 1975; Sarazin 1986). We also assume that the intra-group gas is isothermal, with mean temperature derived above (kT = 2.3 keV). Figure 3 shows the total mass, baryonic plus dark matter, also known as the hydrodynamical mass radial profile, as well as the X-ray emitting gas fraction profile, Mgas/Mtotal, for the MKW 4s group.
Based on the total mass radial profile, we can estimate the R200 and R500 radii5, and the corresponding masses within these radii:
In Laganá et al. (2013), NGC 4104 was fitted with a single temperature using only XMM-Newton data, while here we have also used Chandra and modelled the X-ray emission as a two-temperature plasma. Also, here we have considered a 2D β-model to fit the Chandra X-ray surface brightness while Laganá et al. (2013) have taken a radial profile based on XMM-Newton. The different methodology may explain the different values for R500 (in Laganá et al. 2013, they found R500 = 502.5 kpc). This, in turn, results in a different total mass estimation (they have measured M500 = 0.27 × 10¹⁴ M⊙).
In order to estimate the total X-ray luminosity up to R200 we need to extrapolate the luminosity measured within R = 90″ (see Tables 1 and 2) using the fitted β-model (Table 3). The X-ray luminosity within 90″, taking into account all the detectors, is LX(90″) = (2.9 ± 0.2) × 1042 erg s−1.
The projected luminosity as a function of radius is LX(R) = 2π∫I(R)RdR, so the extrapolated X-ray luminosity is obtained by integrating Eq. (1), resulting in:
![Mathematical equation: $$ \begin{aligned} L_{\rm X}^\mathrm{extrap}(R) = 1.753 [1 - 1/(1 + 0.1413 R^2)^{0.12}] \times L_{\rm X}^\mathrm{measured}(90^{{\prime\prime }}), \end{aligned} $$](/articles/aa/full_html/2020/09/aa36098-19/aa36098-19-eq28.gif) (2)
(2)
where we have taken the best-fit β-model parameters. Therefore, we have LX(R200) = (4.0 ± 0.3) × 1042 erg s−1.
With the above bolometric X-ray luminosity and temperature, MKW 4s is hotter than we would expect from its luminosity when compared to the scaling relation LX–TX obtained, for instance, by Kundert et al. (2015; based on a sample of ten fossil groups observed with Suzaku) and Zou et al. (2016; based on a sample of 23 Chandra observed groups). This appears clearly in Fig. 4 and may indicate some peculiarity in the MKW 4s system, since fossil groups usually follow the LX–TX relation defined by non-fossil groups (e.g. Khosroshahi et al. 2007; Kundert et al. 2015). This property may be related with the event that produced the shell structure in MKW 4s (described in detail in Sect. 3.2.2), which may have heated the intragroup plasma either from a shock or from feedback of the (possibly) central supermassive back hole. Deeper X-ray observations could resolve this issue. In Fig. 4, the blue point at almost the same temperature as MKW 4s but with a lower X-ray luminosity is XMMXCS J030659.8+000824.9, analysed by Harrison et al. (2012). They note that this system is an outlier of the LX–TX relation and although it satisfies all criteria to be classified as a fossil group, they reckon this classification is uncertain.
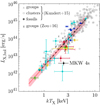 |
Fig. 4. LX–TX relation for a sample of groups and clusters at low and intermediate redshift (z ≲ 0.3) from Kundert et al. (2015, their Fig. 5) and Zou et al. (2016, also their Fig. 5). MKW 4s is shown for comparison. The pink shaded area and the red line correspond to the fit by Zou et al. (2016) and the black dashed line is the fit from Kundert et al. (2015). |
3. Optical analysis
3.1. Optical imaging: the data
We obtained very deep g and r imaging of NGC 4104 with Megacam at the 3.6 m Canada-France-Hawaii Telescope (CFHT, observation Program 13AF002 in May and June 2013) and we applied the Elixir-LSB pipeline developed at CFHT (Duc et al. 2011), specially designed for detecting low surface brightness features: dithering during the observations and then merging the images together. The images we used were further binned, resulting in a plate scale of 0.561″ per pixel. The exposure time was 2240 s for each band.
The point spread function (PSF) in each band was modelled by a Moffat-function (e.g. Moffat 1969; Trujillo et al. 2001):
![Mathematical equation: $$ \begin{aligned} \mathrm{PSF}(R) = \frac{\beta -1}{\pi \,\alpha } \left[ 1 + (r/\alpha )^2 \right]^{-\beta },\;\mathrm{with}\,FWHM = \alpha \, 2\sqrt{2^{1/\beta } -1}, \end{aligned} $$](/articles/aa/full_html/2020/09/aa36098-19/aa36098-19-eq29.gif) (3)
(3)
where FWHM is the full width at half maximum related to the Moffat parameters α and β. This allows us to model the surface brightness at radii smaller than the PSF scale (about 1 arcsec), as will be shown in Sect. 3.2.1.
We choose 30 bright, non-saturated stars around the brightest galaxy, avoiding crowded places and stray light around bright stars. For each star, we fit a circular Moffat function using the IRAF/imexamine task. For the r band, the best-fit values are β = 4.49 ± 2.13 and FWHM = 1.063″ ± 0.071″; for the g band we have β = 4.76 ± 1.50 and FWHM = 1.065″ ± 0.059″.
Furthermore, for the 2D image analysis (Sect. 3.2.1 below), an image of the PSF is produced by stacking non-saturated stellar images after subpixel recentring. The stars were chosen far from the brightest galaxies and far from the refraction stray light around the very bright stars.
Both the g and r bands have ZP = 29.61 mag, thus, their magnitudes are defined as m = 29.61−2.5 log(ADU/0.3147), where the constant 0.3147 corresponds to the plate scale of 0.561″ per pixel.
Using wavelet decomposition6, we checked that for both bands, the images were indeed flat throughout the whole field of view. The background levels, measured using a 3σ-clipping method around the median value, are 610.6 ± 2.1 and 386.8 ± 1.8 ADU per pixel for the r and g bands, respectively. This translates to 21.390 ± 0.005 and 21.886 ± 0.006 mag arcsec−2 for the r and g bands, respectively.
Figure 5 shows the extension of the stellar envelope down to surface brightness μr = 28 mag arcsec−2. We do not detect intragroup light in the form of streams or substructure, only the smoothly decreasing envelope around NGC 4104. The envelope shows a pronounced boxy or peanut shape as defined by the 4th cosine coefficient of the Fourier series describing the non-ellipticity of isophotes (e.g. Lauer 1985; Bender et al. 1989).
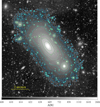 |
Fig. 5. Grayscale r-band image of NGC 4104 with overlaid surface brightness contours spaced from 22 to 28 mag in steps of 1 mag (see text for the conversion of ADU to magnitude). The overall shape shows a distinct boxy shape. The stellar envelope extends to about five arcmin from the centre ( |

3.2. Optical results
In this section, we report the results obtained using two different 2D fitting techniques with the aim of studying the structural components of NGC 4104. For this purpose, we used IRAF/ELLIPSE (Busko 1996) and GALFIT (Peng et al. 2002) codes, which are briefly described in the sections below.
3.2.1. Radial surface brightness fit
For each of the two bands, g and r, we followed the same procedure. First, we masked all the bright stars and the stray light coming from diffraction and reflected starlight within the telescope and camera. The diffuse light from stars has a surface brightness comparable to that of the outer galaxy stellar envelope and of the eventual intra-group light.
We used the ELLIPSE task from IRAF (Jedrzejewski 1987; Busko 1996). This task fits the surface brightness with isophote ellipses, without assuming a radial profile model. It applies a 3-sigma clipping technique to eliminate faint point-like emission from the ellipse fitting. A 2D model was then reconstructed with the IRAF/BMODEL task. All bright and extended objects in the field were masked to fit the isocontours of NGC 4104. The ELLIPSE task outputs a radial profile along the major axis that we can fit with a parametric model such as the Sérsic profile.
The radial surface brightness profile we adopted is a single Sérsic profile convolved with a Moffat function describing the point spread function.
Taking into account the PSF as a Moffat function, we fitted the following radial profile (Trujillo et al. 2001):
![Mathematical equation: $$ \begin{aligned} \displaystyle I_{\rm c}(r) =&(1- \varepsilon ) \int _0^\infty r^\prime I(r^\prime ) \mathrm{d} r^\prime \int _0^{2\pi } \frac{(\beta -1)}{\pi \alpha ^2}\nonumber \\[10pt] \displaystyle&\times \left[ 1 + \frac{r^2 + {r^\prime }^2 - 2r r^\prime \cos \theta ^\prime + \varepsilon (\varepsilon -2)(r^\prime \sin \theta ^\prime )^2}{\alpha ^2} \mathrm{d} \theta ^\prime \right]^{-\beta }, \end{aligned} $$](/articles/aa/full_html/2020/09/aa36098-19/aa36098-19-eq31.gif) (4)
(4)
where we have kept the Moffat parameters, β and α, fixed, using the values shown in Sect. 3, and fixing the ellipticity to the same value for both bands, using the mean value obtained by the ELLIPSE task. For a given radius r, the integral in Eq. (4) is computed numerically. Fitting the surface brightness radial profile convolved with the Moffat PSF allows the use of all data points, including the ones with radius smaller than the PSF FWHM, about 1 arcsec for both bands.
The results are shown in Table 4 and in Figs. 6 and 7. The best-fit Sérsic parameters are 3.29 and 3.41 in the r and g bands respectively, somewhat below the de Vaucouleurs n = 4 value. The fits with a single Sérsic parameter show an oscillating residue (Figs. 6 and 7 lower panels), which may indicate that a more complex model should be considered.
Results of the one component Sérsic function fit of the radial surface brightness profile obtained with ELLIPSE/IRAF.
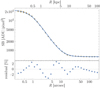 |
Fig. 6. Best-fit PSF convolved Sérsic profile for the r band surface brightness profile. The residuals are given in percents relative to the observed profile. The orange points represent 1σ error bars. |
There are four clear structures on the line of sight, as can be seen in the histogram of Fig. 8. These four structures are spatially distributed as shown in Fig. 9, where each structure is shown with a different colour. NGC 4104 belongs to a structure with 148 galaxies within the redshift range of 0.015 < z < 0.04 (indicated by the green-filled circles in this figure). The main structure has a redshift, z = 0.0278 ± 0.0030. There is a difference compared with the spectroscopic redshift of NGC 4104, Δz = 0.0004, but this is smaller than the uncertainty on the mean redshift of the main structure, so we can assume that NGC 4104 is at rest with respect to the MKW 4s group.
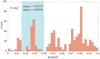 |
Fig. 8. Redshift histogram of 718 galaxies selected in a 4° ×4° box centred on NGC 4104 with redshift between 0.001 and 0.1 from SDSS. There are at least three more structures on the line-of-sight. Focusing on the NGC 4104 structure (0.015 < z < 0.04), we have z̅ = 0.0278 and σz = 0.00304 (148 galaxies). |
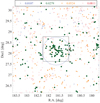 |
Fig. 9. Spatial distribution of the galaxies shown in Fig. 8. The structures identified in the four portions of the histogram are shown with different symbols and colours, identified by their mean redshift just above the figure. The MegaCam field-of-view is shown as a black square. The blue circle has a radius equal to R200, as computed in Sect. 2, centred on NGC 4104. |
3.2.2. Surface brightness 2D fit
With the latest version of GALFIT (Peng et al. 2002, 2010), it is possible to recover low surface brightness tidal features beneath and beyond luminous galaxies that can be described by traditional parametric functions such as Sérsic, Moffat, King etc, profiles. To produce a realistic-looking galaxy model image of NGC 4104, we used a multi-component Sérsic model: three components that describe the three brightest galaxies (NGC 4104, and the second and third brightest galaxies inside the BGG envelope). All the other objects were masked. The initial conditions were obtained fitting first each galaxy individually, and then fitting the three galaxies simultaneously. The PSF was taken into account by using a synthetic image of a Moffat radial profile described by Eq. (3). The GALFIT zero point (ZP) is given by ZPgf = ZP + 2.5log(1/Texp), where Texp is the exposure time.
The best-fit parameters are given in Tables 5 and 6 for the g and r bands, respectively. In Fig. 10 we show the r-band image, the best-fit model and the residual image in which the interleaved ripples that appear on both sides of the galaxy centre are evident and coincide spatially with optical stellar shells.
GALFIT 2D best-fit results for the g band.
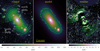 |
Fig. 10. Best result of the 2D fit using GALFIT. Left: original r-band image with the positions of the various shells labelled from 1 to 6, with “s” and “n” referring to the southern and northern shells, respectively. The shells were drawn as circular arcs, symmetric with respect to the centre of NGC 4104. The dashed lines correspond to the shells that we could not measure the magnitude, see Table 7. Middle: best-fit model (with a flat background included), simultaneously taking into account the three brightest galaxies in the group. The isocontours from the original r-band image, corresponding to 24 and 26 mag arcsec−2 (shown in red and green, respectively), are displayed for reference. Right: residue, that is, the original image minus model, with the positions of the shells superimposed. Left and middle images: the background component is present and the same colour scale is used. |
We identified the shells by carefully masking all sources (foreground stars, fore- and back-ground galaxies), using the residual map (Fig. 10), as concentric circular arcs, symmetric with respect to the centre at (12h06m39s, 28° 10′27″) J2000, coincident with the centre of NGC 4104. In Table 7 we give their distances from the centre, measured mean surface brightnesses in the r-band and mean g − r colours.
Surface brightnesses in the r-band and mean g − r colour indexes of the shells.
Half of the shells (numbers 2, 3, and 4) are detected on opposite sides with respect to the centre of symmetry. Their surface brightnesses range from 24.7 mag arcsec−2 (shell 2n) to 28.9 mag arcsec−2 (shell 6s), both in the r-band. They have roughly the same colour index as NGC 4104, but we note that the error bars are large.
3.2.3. Colour information
We measured the colour index in elliptical annuli centred on NGC 4104, excluding the central two arcsec (that will be discussed below).
The radial profile of the g − r colour index is very smooth, dropping from 0.70 ± 0.02 mag in the first annulus (mean major axis of 5″) to 0.50 ± 0.01 mag at ∼90″ and becoming flat until at least 160″. The shells have the same colour index, as far as we could measure, as the stellar envelope. This would imply that there was no recent or significant star formation when the shells were produced. It then suggests that the galaxy that collided with NGC 4104 was gas-poor and it was possibly a dry merger that produced the shells.
3.2.4. Central region
Figure 11 shows the central region of NGC 4104, inside a radius of  kpc. In the left panel, we can see that there is a filamentary region, perpendicular to the major axis of the galaxy and inside the 19 mag arcsec−2 isocontour, with an approximate elliptical shape with semi-major and minor axes of 2.5″ and 1.0″.
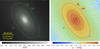 |
Fig. 11. Left: r-band image of the central region of NGC 4104. The contours correspond to surface brightness from 19 to 22 mag arcsec−2 and the yellow bars give the linear scale length. Right: g − r color image of the same region, with the same contours. There is a faint linear structure crossing the image perpendicular to the major axis with a distinctive red colour. Each panel covers an area of |

In the r-band, this filament has a surface brightness fainter by about 0.17 mag than the brighter region surrounding it. In the right panel, we can also see that this fainter central filament is also redder, with (g − r) ≈ 0.86 mag. These images suggest that this filament may be due to an excess of dust in the very inner region of NGC 4104.
This possible dust extinction is also observed on the Chandra X-ray image, and suggests the presence of a small central dust lane. This dust may be associated to some kind of activity in the central  kpc (2.5″). The evidence suggests, based on the optical spectrum and radio emission (O’Dea et al. 2008; Quillen et al. 2008), that there is no or a very weak AGN. However, the presence of strong Hα and [NII] lines may indicate that the observed dust in the centre may be related to some recent star formation episode. We may speculate that this event of star formation has been triggered by gas brought by the merging of the galaxy that also produced the shells.
4. Dynamical analysis of the MKW 4s/NGC 4104 group
4.1. Galaxy velocity distribution
We analysed SDSS data (DR12), selecting galaxies in a 4° × 4° box centred on NGC 4104, with spectroscopic redshifts between 0.001 and 0.1, as shown in Fig. 8. There are 718 galaxies in this initial sample.
In Fig. 12, we show the redshift histogram of the 148 galaxies of the NGC 4104 group. Both a three Gaussian fit and an adaptive kernel7 1D distribution suggest a main structure at z ≃ 0.0279 (σ = 0.0013) with two smaller substructures in velocity space, at z ≃ 0.0218 (σ = 0.0021) and z ≃ 0.0346 (σ = 0.0022). For the main structure, with the highest peak in the histogram, the dispersion in redshift corresponds to a velocity dispersion of 382 km s−1.
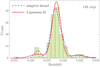 |
Fig. 12. Redshift histogram of the 148 galaxies of NGC 4104 group. Both a three Gaussian fit and an adaptive kernel 1D distribution suggest a main structure with two smaller substructures in velocity space. |
4.2. Substructures around the NGC4104 group
In order to further analyse the presence of substructures around the NGC 4104 group, we investigate this region by applying the Serna & Gerbal (1996) technique, an agglomerative hierarchical clustering model based on dynamical arguments (pairwise binding energies), to the subsample of 148 galaxies selected in redshift space (as discussed above). This technique has been successfully employed in the past (e.g. Girardi et al. 2011; Barrena et al. 2014; Guennou et al. 2014) to characterise substructures from a dynamical standpoint.
The hierarchical clustering algorithm creates a tree of similarities called a dendrogram, that is shown in Fig. 13. This figure clearly shows three dynamically distinct substructures (two small ones represented in blue and red, and the main one in black), in line with the result obtained from the fit of the histogram of the 148 members. The galaxies marked in blue and red on the dendrogram correspond well to those included in the blue and red features of Fig. 12.
 |
Fig. 13. Dendrogram obtained by applying the Serna & Gerbal (1996) technique for 148 galaxies in the interval 0.015 < z < 0.040 in a 16 deg2 square centred on NGC 4104 (object number 83 in this figure). The main structure is represented by the black labels (numbers). Two small substructures are shown in red and blue, and a few “isolated” galaxies (not strongly bound to any of the three structures) are in grey, on the right side of the horizontal axis. The horizontal dashed line represents our cut to define the substructures (see text). |
This result is consistent with a previous analysis made by Beers et al. (1995) with 53 galaxies, which also suggested the presence of two smaller substructures around NGC 4104. The more prominent of these two substructures can be seen in Fig. 9, the green points clustered near coordinates (RA, Dec) = (179.5° ,28.4°), about two degrees to the west of NGC 4104 (about  Mpc in the plane of the sky). This West structure agrees with that seen in Beers et al. (1995) where it is identified with Zwicky cluster Z1154.9+2806.
4.3. Large scale structure around the NGC 4104 group
We investigated the isolation degree of the NGC 4104 group of galaxies (as was done in Adami et al. 2007, Sect. 2, also see Adami et al. 2012). We searched for galaxies brighter than NGC 4104 which could be BCGs of larger groups or clusters of galaxies and could show that the NGC 4104 group of galaxies is not the dominant one within the considered region. For this, we selected two different sky regions, both limited to the blue shaded redshift range in Fig. 8 (corresponding to a 107 Mpc width at the group redshift).
The first region is the same as in Fig. 9, corresponding to ∼8.1 Mpc on the sky and to a 4° × 4° area. NGC 4104 is clearly the brightest galaxy in this area with an available spectroscopic redshift (the second one is half a magnitude fainter).
We chose, therefore, the second region in order to have a size of the order of typical cosmological voids: ∼50 Mpc (24.5 deg on the sky). In this area, we find in NED three galaxies brighter than NGC 4104 (g′ = 13.06), or fainter than NGC 4104 by less than 0.1 mag: NGC 3842 (g′ = 12.8), NGC 4789 (g′ = 13.12), and NGC 4555 (g′ = 13.1).
It is thus clear that NGC 4104 is the dominant galaxy of its immediate vicinity (within about 8 Mpc), and is among the dominant galaxies in a volume corresponding to a 50 Mpc diameter. The environment of NGC 4104 is therefore relatively poor in terms of bright galaxies, allowing us to argue that the NGC 4104 group is among the dominant structures of its cosmological bubble, despite its relatively low mass.
4.4. N-body simulations
We ran a series of dry merger N-body simulations in order to gain insight on the dynamical process that shaped NGC 4104. Here, we present the results of a set of models, noting that this is not meant to be a precise mass reconstruction of the observed system. Rather, these simulations aim to motivate our interpretation of the underlying physical mechanism that led to the formation of the shells, and to broadly attempt to constrain a few of the collision parameters. In this sense, they should be regarded merely as a first-order approximation. We simulated the merger of two galaxies: a more massive galaxy (the “primary”) and a less massive galaxy (the “secondary”, but not to be confused with the second largest galaxy, J120630.86).
We aimed to set up a simulated collision whose outcome is comparable to the observed NGC 4104. The detailed properties of the progenitor galaxies before the collision could not be known a priori. However, the current observed profile of NGC 4104 may be used as a reasonable first guess for the initial conditions. First, we set up a reference mass model inspired by the observational fits for the system. The total mass of the galaxy is obtained from its luminosity (Table 6) once a mass-to-light ratio is given. Assuming a typical M/L = 10 for elliptical galaxies (Cappellari et al. 2006), the virial mass of the galaxy would be M200 = 1.1 × 10¹² M⊙. Given this mass, and assuming a NFW radial profile (Navarro et al. 1997), the concentration should be approximately c = 7.8 at low redshift (Duffy et al. 2008; Dutton & Macciò 2014). Consequently, the virial radius is r200 = 213 kpc and the scale length of the NFW profile is rs = 27 kpc. If a different mass-to-light ratio had been adopted, say M/L = 5, the virial radius would have been shorter by about 20%. The total mass of the galaxy is dominated by dark matter and to represent the stars, we adopt a Sérsic profile motivated by the fits from Sect. 3.2. Thus, a model is obtained for an elliptical galaxy consisting of a dark matter halo described by an NFW profile, and also a stellar component described by a Sérsic profile. The orange lines in Fig. 14 show the cumulative mass profile of this galaxy, where one sees that the stars dominate only in the inner region but then are overtaken by the dark matter.
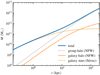 |
Fig. 14. Cumulative mass profiles of the reference model used to set up initial conditions for the simulations. The elliptical galaxy is composed of stars with a Sérsic profile (dashed orange line) and a dark matter halo with an NFW profile (solid orange). The galaxy is embedded in a dark matter halo with an NFW profile (grey), corresponding to the group it belongs to. The total mass profile (blue) is the sum of these three components. |
The galaxies reside within a group whose total mass was estimated in Sect. 2.2. This contribution will also be taken into account, because it affects the collision dynamics at the bottom of the group gravitational potential well. The grey line in Fig. 14 represents the NFW profile of a galaxy group with virial mass M200 = 1.49 × 10¹⁴ M⊙, virial radius r200 = 1096 kpc and concentration c = 4.9. The NFW scale length is rs = 226 kpc. As will be discussed below, for numerical reasons, the profile of the group will be replaced in practice by an equivalent Hernquist (1993) profile having a scale length a = 309 kpc. In the region of interest the NFW and Hernquist profiles are nearly identical, but the analytical formulae for the Hernquist profile are far more convenient.
The total cumulative mass of the system is then given by the blue line in Fig. 14. The total enclosed mass within 200 kpc is nearly 3 × 10¹³ M⊙. This is comparable, by construction, to the blue line in Fig. 3. These mass profiles need not coincide precisely in the innermost region, however. This reference mass model will be used to create the initial conditions of the simulation in the following manner. The mass of the group is fixed. The total mass of the galaxy (stars and dark matter) in the reference model is then divided into the primary and the secondary galaxies, with the mass ratios given in Table 8. This is done such that the total mass of the merged system is always the same. For example, in the simulation labelled S1, the secondary has 10% of the mass of the primary, and so forth. Thus the two galaxies effectively used in the initial conditions of the simulations are proportionally scale-down versions of the galaxy presented in the reference model of Fig. 14. The primary galaxy is created in equilibrium in the presence of the group mass. The particles representing the group are then excised, leaving only the bare galaxy. This is done because the group will be replaced by an analytic fixed potential in the calculations. The primary galaxy is then made mildly prolate and begins with a minor-to-major axis ratio of ∼0.8.
Initial condition parameters of the simulations.
To set up the collision, the galaxies were placed at an initial separation of 100 kpc and with an initial relative velocity of −100 km s−1 pointed along the major axis of the slightly prolate primary, with impact parameter b = 0.
The realisations of the initial conditions were performed with the code DICE8. The simulations were carried out with the Gadget-2 code (Springel 2005) with a gravitational softening length of 0.1 kpc, and the evolution was followed for 10 Gyr. The code was modified to include the forces caused by an analytic Hernquist potential. At each time step of the computations, all dark matter and gas particles feel their own self gravity and additionally the accelerations due to an external fixed potential. In each simulation, the galaxies are represented by approximately 106 dark matter particles and 106 stellar particles, meaning that the mass resolution is better for the stars. With this setting, the mass resolution is 3.5 × 10⁵ and 9.5 × 10⁵ M⊙, for stars and dark matter particles, respectively.
With the procedures described above, initial conditions were created with the parameters of Table 8 and five simulated collisions were carried out with mass ratios from 10 to 90%.
In Fig. 15 we present the time evolution of four of these runs, namely simulations S1, S3, S5, and S7. The 300 × 300 kpc frames display the projected stellar mass during 9 Gyr, counting from the instant of central passage. The snapshots were rotated merely to match the position angle of NGC 4104, but in Fig. 15 there is no inclination between the collision axis and the plane of the sky. If the aim is to obtain a simulated galaxy whose morphology approximately resembles that of NGC 4104, we found that simulation S1 provided the poorest results. On the other hand, the morphological evolution of models S3–S9 are rather similar to each other (for conciseness, S9 is not shown in Fig. 15). A comparison of the simulations with different mass ratios in Fig. 15, shows that throughout their entire evolution, models S3–S7 indeed present some subtle but systematic evolutionary trends. However, their morphological differences are not sufficient to confidently rule any of them out. Only model S1 is significantly different, failing to develop the desired shells and overall shape. Thus, we conclude that minor mergers of ratio about 1:10 may be ruled out. However, since simulations S3–S9 did not provide a clear constraint, only a lower limit of approximately 1:3 can be offered.
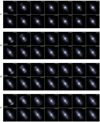 |
Fig. 15. Time evolution of simulations S1, S3, S5, and S7. Different models correspond to different mass ratios with parameters given in Table 8. Maps of projected stellar mass are given. Each frame is 300 kpc wide. Times are given with respect to the instant of central passage. We note that the final frames are more widely spaced in time. |
A visual inspection of S3–S7 in Fig. 15 allows us to set an approximate time range for the “best instant” of these simulations, that is, the moment when the morphology appears to be qualitatively similar to the observed NGC 4104. We first notice that the secondary galaxy is disrupted after only a few crossings and within less than a Gyr, it is no longer identifiable as a separate object. Also, it is interesting to note that this merging system becomes quite elongated along the collision axis, even though the initial prolateness of the primary galaxy was only mild. Shells develop early on but are noticeably asymmetric at first. Given the symmetry of NGC 4104, we propose that the first few Gyr may be ruled out for this reason – surely before 2 Gyr, but possibly before 3 Gyr. At the other end, shells tend to become more tenuous and the overall shape of the galaxy seems less boxy. These qualitative considerations suggest a preferred time range of 3−8 Gyr.
However, the number of shells might help further constrain this time interval since the resolution is sufficient for them to be counted. For S3−S7 in Fig. 15, starting at ∼4 Gyr, it becomes possible to identify five or six shells on each side. On the other hand, by ∼7 Gyr seven or eight shells may be counted on each side. These criteria are quite uncertain, because this counting would depend on which of the outermost and innermost shells have sufficient contrast to be discerned; these qualitative judgements would be based on mass distribution rather than light. It would be doubtful that at a precise instant, it would be possible to precisely match each observed shell to each simulated one. Thus, the approximate time interval of 4−6 Gyr suggested by the counting of shells should be regarded with less confidence than the 3−8 Gyr range. In any case, within either of these intervals, the maximum extent of the shells reaches 100−150 kpc (depending on whether the outermost very tenuous shells should be counted), which is in fair agreement with the observed value.
In order to make a more quantitative comparison between the simulations and NGC 4104, we produced synthetic images by projecting the particles representing the stars onto a plane. Then this projection was written into a FITS file with the same size and angular scale as the observation. For these images, we have proceeded as we did with NGC 4104, by fitting an elliptical symmetric model with GALFIT. Figure 16 shows the residual images after subtracting the GALFIT best-fit model. We show the images that best approach the shell position and intensity as observed in NGC 4104, which is simulation S3 at t = 5 Gyr.
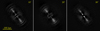 |
Fig. 16. Residual images computed by subtracting an elliptical symmetric model obtained by fitting a synthetic image GALFIT, following the same procedure as with NGC 4104 (see Fig. 10). The synthetic image was generated using only the stellar component of simulation S3 at t = 5 Gyr. From left to right: three different projection angles of the collision axis on the plane of the sky, 10°, 20°, and 30°. Middle panel: our preferred projection, where the number and intensity of the shells on the residual image are closer to what we observe on NGC 4104. |
We also explored the possibility that the collision that generated the shells were not exactly on the plane of the sky. Therefore, we also produced synthetic images assuming projections at i = 10, 20 and 30°, where i is the angle between the collision axis and the plane of the sky. The sharpness of the shells in the residuals is sensitive to the inclination. We found that for i = 0 the simulated shells are much sharper than the observed ones, while for i ≳ 30° they nearly vanish. An angle of about 20° seems to best reproduce the observed shells, both in number and intensity.
Shell galaxies have been found to form within cosmological simulations of galaxy formation. In fact, out of the most massive galaxies in the Illustris simulation, nearly 18% exhibit shells (Pop et al. 2018). It is interesting to note that our highly idealised simulations give rise to morphologies resembling those seen in cosmological simulations. For instance, Torrey et al. (2015) analyse galaxies from the Illustris simulation, whose synthetic images are not too dissimilar from idealised binary mergers. More generally, the statistical findings of Pop et al. (2018) show that shell galaxies at redshift z = 0 in Illustris form preferentially from mergers with mass ratios greater than 10%, that progenitors are accreted from orbits of low angular momentum (i.e. nearly radial) and that the preferred time window for mergers is 4−6 Gyr ago. In our attempt to constrain the age of the merger of NGC 4104 and the masses of its progenitors, we obtained ranges of time and mass which are compatible with the global statistics of cosmological simulations. Even though these estimates are somewhat uncertain, their general consistency would indicate that the essential physical mechanisms are being sufficiently well represented by the simplified simulations, in spite of their many limitations. In other words, the main processes that shaped NGC 4104 must have their origin in stellar dynamics, governed by gravity.
We probed only one dimension of the parameter space, namely the mass ratios, while keeping all other parameters fixed. The evolution of these simulated collisions has allowed us to estimate rough intervals of age and of mass ratio. The intervals that we obtained are broadly compatible with the statistical predictions from cosmological simulations (Pop et al. 2018). A fuller exploration of the parameter space of possible collisions (and possible initial galaxies) is a substantial undertaking that is beyond the scope of the current work. Additional variations of parameters might include different initial velocities, non-frontal collisions, the axis ratios of the initial galaxies, projection effects, and the inclusion of gas and star formation. These are relevant prospects both for tailored simulations that attempt to model individual objects such as NGC 4104, but also for simulations aiming to understand the phenomenon of shell formation in general.
It is not possible to claim that a given solution is unique when attempting to model one particular object in detail. Even though in our specific runs, the resulting morphologies exhibit acceptable agreement around 4−6 Gyr, simulations with other combinations of parameters might have led to other best moments. Nevertheless, as a first approximation, they allow us to offer a somewhat qualitative but physically plausible scenario for the merger event that may have given rise to the shells of NGC 4104.
5. Discussion
While galaxies displaying shells have recently been dynamically disturbed, we have, on the other side, fossil groups, which are thought to be old systems that relaxed following elliptical galaxy assembly. Fossil groups are X-ray-bright galaxy groups dominated by a large elliptical galaxy and the “fossil” nomenclature indicates that such systems are the remnants of galaxy mergers, in which the elliptical galaxy with an X-ray halo is the only result of the process.
Jones et al. (2003) defined fossil groups as spatially extended X-ray sources with  erg s−1 and with an R band magnitude gap of 2 or more between the brightest and second brightest galaxy member (Δm12), inside half of the group virial radius. Recent studies of local fossil groups and clusters show that their X-ray luminosities are in the range of 1042−1045 erg s−1 (Girardi et al. 2014; Bharadwaj et al. 2016), 1−3 orders of magnitude higher than those of typical giant elliptical galaxies with similar optical luminosities (e.g. Kim & Fabbiano 2015). Their X-ray surface brightness is usually extended and smooth, as expected for old relaxed systems; also, the Δm12 conditions ensure the systems are indeed relaxed and evolved after the elliptical galaxy assembly.
The most widely accepted scenario for the formation of fossil groups is one where dynamical friction causes galaxies close to the centre of the group to merge and a large elliptical galaxy with a hot X-ray halo is left (D’Onghia et al. 2005). However, it is still unclear whether the properties of fossil systems make them a particular class of system and also whether these are the final stages of mass assembly or, instead, a transient phase in the formation of larger structures. Based on 25 objects (SDSS and ROSAT All-Sky Survey data), La Barbera et al. (2009) find no difference between fossil groups and non-fossil groups, suggesting that they are the final stages of mass assembly in a region without enough surrounding matter.
For the MKW 4s group, NGC 4104 is two magnitude brighter than the galaxy ranked second in the r band, satisfying the Δm12 condition. Also, the X-ray luminosity is brighter than 5 × 1041 erg s−1, suggesting MKW 4s is a fossil group.
In a contradiction of the “fossil” nomenclature, NGC 4104, which is the brightest galaxy of MKW 4s, shows shell features, which are imprints of a merging that happened roughly between 3 to 8 Gyr ago (or, possibly between 4 to 6 Gyr ago), with a galaxy that had at least ∼30% of NGC 4104 mass at that moment. This makes MKW 4s an unusual and disturbed fossil group, just as NGC 1132, for which Kim et al. (2018) suggested a formation scenario where the growth of the massive central galaxy occurs through continuous infall from its environment; this infall may continue even after the group has entered the fossil phase (Dariush et al. 2010; Kanagusuku et al. 2016). Contrary to NGC 1132 – and closer to the “fossil group” definition – the X-ray surface brightness of NGC 4104 shows a rather symmetrical morphology, aligned with the optical counterpart, and a cool-core, suggesting that it is a more dynamically evolved system than NGC 1132. To our knowledge, the only fossil groups known until now with shells around their central galaxies are NGC 1132 and NGC 4104. According to Aguerri et al. (2011), the Fossil Group Origins (FOGO) survey is only expected to reach a limiting surface brightness of ∼26 mag arcsec−2, so it should have detected some shells if there were any, even though the magnitude limit is barely deep enough. Using the same instrument and method as us, Bílek et al. (2016) reached 29 mag arcsec−2 in the g band and detected shells around the elliptical galaxy NGC 3923, but this galaxy is not in a fossil group.
6. Conclusions
We measured the surface brightness radial profile along the major axis using the ELLIPSE task from IRAF. We fitted it with a single Sérsic profile taking into account the PSF, which was modelled by a Moffat function, which allowed us to consider data points (pixels) inside the PSF length scale (of about 1 arcsec). This method, however, cannot fit properly the extended stellar envelope. Therefore, we used GALFIT, a 2D fitting program, to model NGC 4104 plus the second and third brightest galaxies inside the BGG envelope. The residual image clearly shows the shell features that were probably created by the merger of the second brightest galaxy with NGC 4104, as corroborated by our N-body simulation results.
From the X-ray data, MKW 4s could be classified either as a rich group or a poor cluster, with virial temperature ∼2.3 keV and bolometric X-ray luminosity (extrapolated to R200) ∼4 × 1042 erg s−1. The X-ray surface brightness morphology follows the optical counterpart, both being elongated with ellipticities of 0.25 and 0.15, for the X-ray and optical components, respectively. The X-ray emission suggests a dynamically evolved system, with a cool-core and no notable asymmetries in the surface brightness emission.
From our dynamical analysis, the NGC 4104 group is certainly formed by three dynamically distinct substructures: two small structures and a main one. This result was obtained both by a clustering technique and by fitting three Gaussians and an adaptive kernel to the redshift histogram. This indicates that the NGC 4104 group had recently assembled and its history could explain the shell features.
We also carried out a set of N-body simulations of mergers. These numerical models suggest that a radial collision with a satellite galaxy may have led to the formation of the observed shell features. Simulations allowed us to rule out minor mergers with mass ratio 1:10 and to set a lower limit of at least 1:3, and an upper limit as high as 90%, an almost equal mass collision. The age of the collision was estimated to be at least in the range between 3−8 Gyr, but also possibly considering 4−6 Gyr with lower confidence.
We also note that neither the optical imaging nor the N-body simulations show any sign of intra-group light down to magnitude 28 in the r and g bands, except for the extended stellar envelope around NGC 4104. There is no sign of features resembling tidal debris or “plumes” of stars such as the ones observed in more massive systems, for instance, in the Virgo cluster (Mihos et al. 2017). In this sense, NGC 4104 would be dynamically older than some of these massive systems or would have had a less eventful dynamical history.
Given the magnitude gap between the first and second brightest galaxies, it seems that we are witnessing the formation of an object that falls within the fossil group classification but still has scars from a past dynamical interaction.
Not be confused with galaxy group MKW 4.
Sloan Digital Sky Survey, https://www.sdss.org/
SHERPA is part of ciao: http://cxc.harvard.edu/sherpa/
These are the radii where the mean density is 200 and 500 times the critical density of the Universe, respectively.
We have applied the code wvdecomp from the package ZHTOOLS developed by A. Vikhlinin.
We apply the method implemented in Mathematica, SmoothKernelDistribution where the histogram is represented by the interpolation of a smooth, continuous function and the kernel varies according to the Silverman (1986) rule. The starting kernel that we took had a width of δz = 0.007 in redshift.
Acknowledgments
We thank the referee for constructive suggestions that helped improve the clarity of this paper. GBLN is grateful for the financial support from FAPESP (grant 2018/17543-0) and CNPq, and thanks the hospitality of IAP. TFL acknowledges financial support from FAPESP and CNPq (through grants 18/02626-8 and 303278/2015-3, respectively). REGM acknowledges support from CNPq through grants 303426/2018-7 and 406908/2018-4. F.D. acknowledges long-term support from CNES. NM acknowledges support from a fellowship of the Centre National d’Etudes Spatiales (CNES). This work made use of the Laboratory of Astroinformatics (IAG/USP, NAT/Unicsul), whose purchase was made possible by the Brazilian agency FAPESP (grant 2009/54006-4) and the INCT-A. Based on observations obtained with MegaPrime/MegaCam, a joint project of CFHT and CEA/DAPNIA, at the Canada-France-Hawaii Telescope (CFHT) which is operated by the National Research Council (NRC) of Canada, the Institut National des Sciences de l’Univers of the Centre National de la Recherche Scientifique of France, and the University of Hawaii (observation Program 13AF002). The authors acknowledge the National Laboratory for Scientific Computing (LNCC/MCTI, Brazil) for providing HPC resources of the SDumont supercomputer, which have contributed to the research results reported within this paper.
References
- Adami, C., Russeil, D., & Durret, F. 2007, A&A, 467, 459 [NASA ADS] [CrossRef] [EDP Sciences] [Google Scholar]
- Adami, C., Jouvel, S., Guennou, L., et al. 2012, A&A, 540, A105 [NASA ADS] [CrossRef] [EDP Sciences] [Google Scholar]
- Adami, C., Giles, P., Koulouridis, E., et al. 2018, A&A, 620, A5 [NASA ADS] [CrossRef] [EDP Sciences] [Google Scholar]
- Aguerri, J. A. L., Girardi, M., Boschin, W., et al. 2011, A&A, 527, A143 [NASA ADS] [CrossRef] [EDP Sciences] [Google Scholar]
- Alamo-Martínez, K. A., West, M. J., Blakeslee, J. P., et al. 2012, A&A, 546, A15 [NASA ADS] [CrossRef] [EDP Sciences] [Google Scholar]
- Amorisco, N. C. 2015, MNRAS, 450, 575 [NASA ADS] [CrossRef] [Google Scholar]
- Anders, E., & Grevesse, N. 1989, Geochim. Cosmochim. Acta, 53, 197 [Google Scholar]
- Athanassoula, E., & Bosma, A. 1985, ARA&A, 23, 147 [CrossRef] [Google Scholar]
- Atkinson, A. M., Abraham, R. G., & Ferguson, A. M. N. 2013, ApJ, 765, 28 [NASA ADS] [CrossRef] [Google Scholar]
- Barrena, R., Girardi, M., Boschin, W., De Grandi, S., & Rossetti, M. 2014, MNRAS, 442, 2216 [NASA ADS] [CrossRef] [Google Scholar]
- Beers, T. C., Kriessler, J. R., Bird, C. M., & Huchra, J. P. 1995, AJ, 109, 874 [NASA ADS] [CrossRef] [Google Scholar]
- Bender, R., Surma, P., Doebereiner, S., Moellenhoff, C., & Madejsky, R. 1989, A&A, 217, 35 [Google Scholar]
- Bharadwaj, V., Reiprich, T. H., Sanders, J. S., & Schellenberger, G. 2016, A&A, 585, A125 [CrossRef] [EDP Sciences] [Google Scholar]
- Bílek, M., Cuillandre, J. C., Gwyn, S., et al. 2016, A&A, 588, A77 [NASA ADS] [CrossRef] [EDP Sciences] [Google Scholar]
- Busko, I. C. 1996, in Astronomical Data Analysis Software and Systems V, eds. G. H. Jacoby, & J. Barnes, ASP Conf. Ser., 101, 139 [Google Scholar]
- Canalizo, G., Bennert, N., Jungwiert, B., et al. 2007, ApJ, 669, 801 [NASA ADS] [CrossRef] [Google Scholar]
- Cappellari, M., Bacon, R., Bureau, M., et al. 2006, MNRAS, 366, 1126 [NASA ADS] [CrossRef] [Google Scholar]
- Cooper, A. P., Cole, S., Frenk, C. S., et al. 2010, MNRAS, 406, 744 [NASA ADS] [CrossRef] [Google Scholar]
- Cooper, A. P., Martínez-Delgado, D., Helly, J., et al. 2011, ApJ, 743, L21 [NASA ADS] [CrossRef] [Google Scholar]
- Dahlem, M., & Thiering, I. 2000, PASP, 112, 148 [NASA ADS] [CrossRef] [Google Scholar]
- Dariush, A. A., Raychaudhury, S., Ponman, T. J., et al. 2010, MNRAS, 405, 1873 [NASA ADS] [Google Scholar]
- de Blok, W. J. G., Józsa, G. I. G., Patterson, M., et al. 2014, A&A, 566, A80 [NASA ADS] [CrossRef] [EDP Sciences] [Google Scholar]
- Diemand, J., & Moore, B. 2011, Adv. Sci. Lett., 4, 297 [NASA ADS] [CrossRef] [Google Scholar]
- D’Onghia, E., Sommer-Larsen, J., Romeo, A. D., et al. 2005, ApJ, 630, L109 [NASA ADS] [CrossRef] [Google Scholar]
- Duc, P.-A. 2016, L’Astronomie, 130, 26 [Google Scholar]
- Duc, P.-A., Cuillandre, J.-C., Serra, P., et al. 2011, MNRAS, 417, 863 [NASA ADS] [CrossRef] [Google Scholar]
- Duffy, A. R., Schaye, J., Kay, S. T., & Dalla Vecchia, C. 2008, MNRAS, 390, L64 [NASA ADS] [CrossRef] [Google Scholar]
- Dünner, R., Araya, P. A., Meza, A., & Reisenegger, A. 2006, MNRAS, 366, 803 [NASA ADS] [CrossRef] [Google Scholar]
- Dupraz, C., & Combes, F. 1986, A&A, 166, 53 [NASA ADS] [Google Scholar]
- Dutton, A. A., & Macciò, A. V. 2014, MNRAS, 441, 3359 [Google Scholar]
- Ebrová, I., Bílek, M., Yıldız, M. K., & Eliášek, J. 2020, A&A, 634, A73 [CrossRef] [EDP Sciences] [Google Scholar]
- Foster, C., Lux, H., Romanowsky, A. J., et al. 2014, MNRAS, 442, 3544 [CrossRef] [Google Scholar]
- Girardi, M., Bardelli, S., Barrena, R., et al. 2011, A&A, 536, A89 [NASA ADS] [CrossRef] [EDP Sciences] [Google Scholar]
- Girardi, M., Aguerri, J. A. L., De Grandi, S., et al. 2014, A&A, 565, A115 [NASA ADS] [CrossRef] [EDP Sciences] [Google Scholar]
- Guennou, L., Adami, C., Durret, F., et al. 2014, A&A, 561, A112 [NASA ADS] [CrossRef] [EDP Sciences] [Google Scholar]
- Harrison, C. D., Miller, C. J., Richards, J. W., et al. 2012, ApJ, 752, 12 [NASA ADS] [CrossRef] [Google Scholar]
- Helmi, A., White, S. D. M., de Zeeuw, P. T., & Zhao, H. 1999, Nature, 402, 53 [NASA ADS] [CrossRef] [Google Scholar]
- Hendel, D., & Johnston, K. V. 2015, MNRAS, 454, 2472 [NASA ADS] [CrossRef] [Google Scholar]
- Hernquist, L. 1993, ApJS, 86, 389 [NASA ADS] [CrossRef] [Google Scholar]
- Jedrzejewski, R. I. 1987, MNRAS, 226, 747 [Google Scholar]
- Jones, L. R., Ponman, T. J., Horton, A., et al. 2003, MNRAS, 343, 627 [NASA ADS] [CrossRef] [Google Scholar]
- Kaastra, J. S., & Mewe, R. 1993, A&AS, 97, 443 [NASA ADS] [Google Scholar]
- Kanagusuku, M. J., Díaz-Giménez, E., & Zandivarez, A. 2016, A&A, 586, A40 [NASA ADS] [CrossRef] [EDP Sciences] [Google Scholar]
- Khosroshahi, H. G., Ponman, T. J., & Jones, L. R. 2007, MNRAS, 377, 595 [NASA ADS] [CrossRef] [Google Scholar]
- Kim, D.-W., & Fabbiano, G. 2015, ApJ, 812, 127 [NASA ADS] [CrossRef] [Google Scholar]
- Kim, D.-W., Anderson, C., Burke, D., et al. 2018, ApJ, 853, 129 [CrossRef] [Google Scholar]
- Kim, D.-W., Anderson, C., Burke, D., et al. 2019, ApJS, 241, 36 [NASA ADS] [CrossRef] [Google Scholar]
- Koranyi, D. M., & Geller, M. J. 2002, AJ, 123, 100 [NASA ADS] [CrossRef] [Google Scholar]
- Kundert, A., Gastaldello, F., D’Onghia, E., et al. 2015, MNRAS, 454, 161 [NASA ADS] [CrossRef] [Google Scholar]
- La Barbera, F., de Carvalho, R. R., de la Rosa, I. G., et al. 2009, AJ, 137, 3942 [NASA ADS] [CrossRef] [Google Scholar]
- Laganá, T. F., Martinet, N., Durret, F., et al. 2013, A&A, 555, A66 [NASA ADS] [CrossRef] [EDP Sciences] [Google Scholar]
- Lauer, T. R. 1985, MNRAS, 216, 429 [NASA ADS] [Google Scholar]
- Lea, S. M. 1975, Astrophys. Lett., 16, 141 [Google Scholar]
- Liedahl, D. A., Osterheld, A. L., & Goldstein, W. H. 1995, ApJ, 438, L115 [NASA ADS] [CrossRef] [Google Scholar]
- Lin, Y.-T., & Mohr, J. J. 2004, ApJ, 617, 879 [NASA ADS] [CrossRef] [Google Scholar]
- Longobardi, A., Arnaboldi, M., Gerhard, O., & Mihos, J. C. 2015, A&A, 579, L3 [NASA ADS] [CrossRef] [EDP Sciences] [Google Scholar]
- Malin, D. F., & Carter, D. 1980, Nature, 285, 643 [NASA ADS] [CrossRef] [Google Scholar]
- Malin, D. F., & Carter, D. 1983, ApJ, 274, 534 [NASA ADS] [CrossRef] [Google Scholar]
- Martínez-Delgado, D., Gabany, R. J., Crawford, K., et al. 2010, AJ, 140, 962 [NASA ADS] [CrossRef] [Google Scholar]
- Martínez-Delgado, D., Romanowsky, A. J., Gabany, R. J., et al. 2012, ApJ, 748, L24 [NASA ADS] [CrossRef] [Google Scholar]
- Mihos, J. C., Harding, P., Feldmeier, J. J., et al. 2017, ApJ, 834, 16 [NASA ADS] [CrossRef] [Google Scholar]
- Moffat, A. F. J. 1969, A&A, 3, 455 [NASA ADS] [Google Scholar]
- Morgan, W. W., Kayser, S., & White, R. A. 1975, ApJ, 199, 545 [NASA ADS] [CrossRef] [Google Scholar]
- Mulchaey, J. S., Davis, D. S., Mushotzky, R. F., & Burstein, D. 1996, ApJ, 456, 80 [NASA ADS] [CrossRef] [Google Scholar]
- Navarro, J. F., Frenk, C. S., & White, S. D. M. 1997, ApJ, 490, 493 [NASA ADS] [CrossRef] [Google Scholar]
- O’Dea, C. P., Baum, S. A., Privon, G., et al. 2008, ApJ, 681, 1035 [NASA ADS] [CrossRef] [Google Scholar]
- O’Mill, A. L., Proust, D., Capelato, H. V., et al. 2015, MNRAS, 453, 868 [NASA ADS] [CrossRef] [Google Scholar]
- Peng, C. Y., Ho, L. C., Impey, C. D., & Rix, H.-W. 2002, AJ, 124, 266 [Google Scholar]
- Peng, C. Y., Ho, L. C., Impey, C. D., & Rix, H.-W. 2010, AJ, 139, 2097 [NASA ADS] [CrossRef] [Google Scholar]
- Ponman, T. J., Allan, D. J., Jones, L. R., et al. 1994, Nature, 369, 462 [NASA ADS] [CrossRef] [Google Scholar]
- Pop, A.-R., Pillepich, A., Amorisco, N. C., & Hernquist, L. 2018, MNRAS, 480, 1715 [NASA ADS] [CrossRef] [Google Scholar]
- Quillen, A. C., Zufelt, N., Park, J., et al. 2008, ApJS, 176, 39 [NASA ADS] [CrossRef] [Google Scholar]
- Quinn, P. J. 1984, ApJ, 279, 596 [NASA ADS] [CrossRef] [Google Scholar]
- Romanowsky, A. J., Strader, J., Brodie, J. P., et al. 2012, ApJ, 748, 29 [NASA ADS] [CrossRef] [Google Scholar]
- Ruszkowski, M., & Springel, V. 2009, ApJ, 696, 1094 [NASA ADS] [CrossRef] [Google Scholar]
- Santos, W. A., Mendes de Oliveira, C., & Sodré, L., Jr. 2007, AJ, 134, 1551 [NASA ADS] [CrossRef] [Google Scholar]
- Sarazin, C. L. 1986, Rev. Mod. Phys., 58, 1 [NASA ADS] [CrossRef] [Google Scholar]
- Schweizer, F., & Thonnard, N. 1985, PASP, 97, 104 [CrossRef] [Google Scholar]
- Serna, A., & Gerbal, D. 1996, A&A, 309, 65 [NASA ADS] [Google Scholar]
- Silverman, B. W. 1986, Density Estimation for Statistics and Data Analysis (Chapman and Hall/CRC) [Google Scholar]
- Springel, V. 2005, MNRAS, 364, 1105 [NASA ADS] [CrossRef] [Google Scholar]
- Tal, T., van Dokkum, P. G., Nelan, J., & Bezanson, R. 2009, AJ, 138, 1417 [NASA ADS] [CrossRef] [Google Scholar]
- Torrey, P., Snyder, G. F., Vogelsberger, M., et al. 2015, MNRAS, 447, 2753 [NASA ADS] [CrossRef] [Google Scholar]
- Trujillo, I., Aguerri, J. A. L., Cepa, J., & Gutiérrez, C. M. 2001, MNRAS, 328, 977 [NASA ADS] [CrossRef] [Google Scholar]
- Zou, S., Maughan, B. J., Giles, P. A., et al. 2016, MNRAS, 463, 820 [NASA ADS] [CrossRef] [Google Scholar]
All Tables
Results of the one component Sérsic function fit of the radial surface brightness profile obtained with ELLIPSE/IRAF.
All Figures
|
Fig. 1. Centre of the MKW 4s group, showing NGC 4104 and two of the main galaxies which are on the line-of-sight of the extended stellar envelope. This is a composite CFHT/Megacam image which combines two bands, g and r (see text), with size 16 × 16 arcmin2 ( |
| In the text | |
|
Fig. 2. Left: composite g-r image of NGC 4104 with X-ray Chandra contours overlaid. Middle: Chandra adaptively smoothed image in the [0.5–7.0 keV] band. Right: XMM-Newton merged MOS1, MOS2, and pn image in the same energy band as the Chandra image. The contours and colours of the X-ray images are in logarithmic scale. The circles on the images, with R = 25″ and 90″, correspond to the extraction regions for the spectral analysis. The overall shape of the X-ray emission follows the ellipticity of NGC 4104. We note that the two brightest galaxies on the stellar envelope to the southwest, SDSS J120633.94 and SDSS J120630.86, are themselves X-ray sources. |
| In the text | |
|
Fig. 3. Top: hot gas (red) and hydrodynamic (blue) mass profiles derived from X-ray data. Bottom: gas to total mass ratio. The coloured bands correspond to 1σ confidence limits. |
| In the text | |
|
Fig. 4. LX–TX relation for a sample of groups and clusters at low and intermediate redshift (z ≲ 0.3) from Kundert et al. (2015, their Fig. 5) and Zou et al. (2016, also their Fig. 5). MKW 4s is shown for comparison. The pink shaded area and the red line correspond to the fit by Zou et al. (2016) and the black dashed line is the fit from Kundert et al. (2015). |
| In the text | |
|
Fig. 5. Grayscale r-band image of NGC 4104 with overlaid surface brightness contours spaced from 22 to 28 mag in steps of 1 mag (see text for the conversion of ADU to magnitude). The overall shape shows a distinct boxy shape. The stellar envelope extends to about five arcmin from the centre ( |
| In the text | |
|
Fig. 6. Best-fit PSF convolved Sérsic profile for the r band surface brightness profile. The residuals are given in percents relative to the observed profile. The orange points represent 1σ error bars. |
| In the text | |
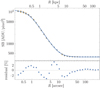 |
Fig. 7. Same as Fig. 6 for the g-band. |
| In the text | |
|
Fig. 8. Redshift histogram of 718 galaxies selected in a 4° ×4° box centred on NGC 4104 with redshift between 0.001 and 0.1 from SDSS. There are at least three more structures on the line-of-sight. Focusing on the NGC 4104 structure (0.015 < z < 0.04), we have z̅ = 0.0278 and σz = 0.00304 (148 galaxies). |
| In the text | |
|
Fig. 9. Spatial distribution of the galaxies shown in Fig. 8. The structures identified in the four portions of the histogram are shown with different symbols and colours, identified by their mean redshift just above the figure. The MegaCam field-of-view is shown as a black square. The blue circle has a radius equal to R200, as computed in Sect. 2, centred on NGC 4104. |
| In the text | |
|
Fig. 10. Best result of the 2D fit using GALFIT. Left: original r-band image with the positions of the various shells labelled from 1 to 6, with “s” and “n” referring to the southern and northern shells, respectively. The shells were drawn as circular arcs, symmetric with respect to the centre of NGC 4104. The dashed lines correspond to the shells that we could not measure the magnitude, see Table 7. Middle: best-fit model (with a flat background included), simultaneously taking into account the three brightest galaxies in the group. The isocontours from the original r-band image, corresponding to 24 and 26 mag arcsec−2 (shown in red and green, respectively), are displayed for reference. Right: residue, that is, the original image minus model, with the positions of the shells superimposed. Left and middle images: the background component is present and the same colour scale is used. |
| In the text | |
|
Fig. 11. Left: r-band image of the central region of NGC 4104. The contours correspond to surface brightness from 19 to 22 mag arcsec−2 and the yellow bars give the linear scale length. Right: g − r color image of the same region, with the same contours. There is a faint linear structure crossing the image perpendicular to the major axis with a distinctive red colour. Each panel covers an area of |
| In the text | |
|
Fig. 12. Redshift histogram of the 148 galaxies of NGC 4104 group. Both a three Gaussian fit and an adaptive kernel 1D distribution suggest a main structure with two smaller substructures in velocity space. |
| In the text | |
|
Fig. 13. Dendrogram obtained by applying the Serna & Gerbal (1996) technique for 148 galaxies in the interval 0.015 < z < 0.040 in a 16 deg2 square centred on NGC 4104 (object number 83 in this figure). The main structure is represented by the black labels (numbers). Two small substructures are shown in red and blue, and a few “isolated” galaxies (not strongly bound to any of the three structures) are in grey, on the right side of the horizontal axis. The horizontal dashed line represents our cut to define the substructures (see text). |
| In the text | |
|
Fig. 14. Cumulative mass profiles of the reference model used to set up initial conditions for the simulations. The elliptical galaxy is composed of stars with a Sérsic profile (dashed orange line) and a dark matter halo with an NFW profile (solid orange). The galaxy is embedded in a dark matter halo with an NFW profile (grey), corresponding to the group it belongs to. The total mass profile (blue) is the sum of these three components. |
| In the text | |
|
Fig. 15. Time evolution of simulations S1, S3, S5, and S7. Different models correspond to different mass ratios with parameters given in Table 8. Maps of projected stellar mass are given. Each frame is 300 kpc wide. Times are given with respect to the instant of central passage. We note that the final frames are more widely spaced in time. |
| In the text | |
|
Fig. 16. Residual images computed by subtracting an elliptical symmetric model obtained by fitting a synthetic image GALFIT, following the same procedure as with NGC 4104 (see Fig. 10). The synthetic image was generated using only the stellar component of simulation S3 at t = 5 Gyr. From left to right: three different projection angles of the collision axis on the plane of the sky, 10°, 20°, and 30°. Middle panel: our preferred projection, where the number and intensity of the shells on the residual image are closer to what we observe on NGC 4104. |
| In the text | |
Current usage metrics show cumulative count of Article Views (full-text article views including HTML views, PDF and ePub downloads, according to the available data) and Abstracts Views on Vision4Press platform.
Data correspond to usage on the plateform after 2015. The current usage metrics is available 48-96 hours after online publication and is updated daily on week days.
Initial download of the metrics may take a while.