Fig. 4.
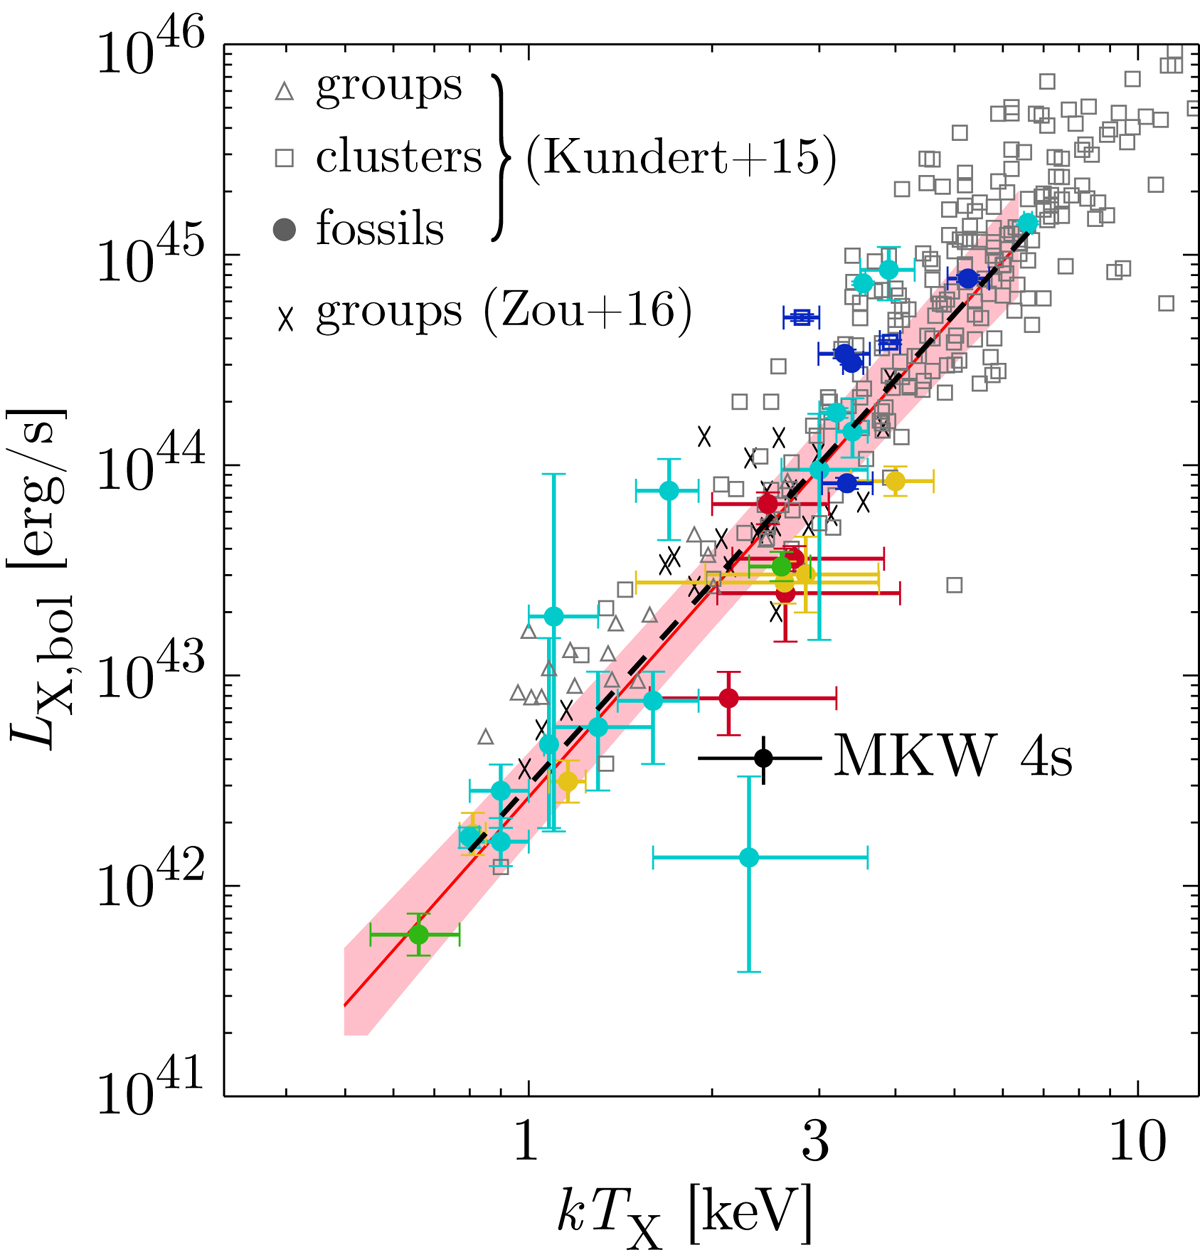
LX–TX relation for a sample of groups and clusters at low and intermediate redshift (z ≲ 0.3) from Kundert et al. (2015, their Fig. 5) and Zou et al. (2016, also their Fig. 5). MKW 4s is shown for comparison. The pink shaded area and the red line correspond to the fit by Zou et al. (2016) and the black dashed line is the fit from Kundert et al. (2015).
Current usage metrics show cumulative count of Article Views (full-text article views including HTML views, PDF and ePub downloads, according to the available data) and Abstracts Views on Vision4Press platform.
Data correspond to usage on the plateform after 2015. The current usage metrics is available 48-96 hours after online publication and is updated daily on week days.
Initial download of the metrics may take a while.