Fig. 13.
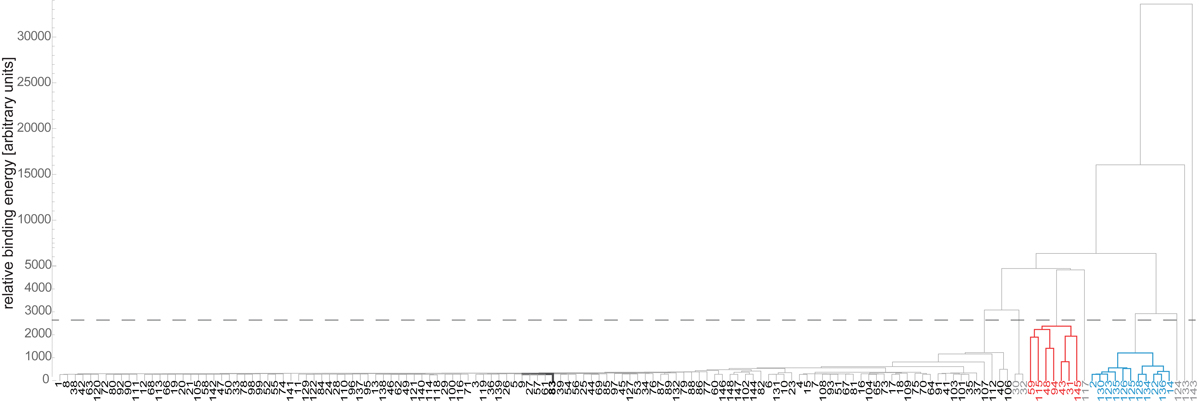
Dendrogram obtained by applying the Serna & Gerbal (1996) technique for 148 galaxies in the interval 0.015 < z < 0.040 in a 16 deg2 square centred on NGC 4104 (object number 83 in this figure). The main structure is represented by the black labels (numbers). Two small substructures are shown in red and blue, and a few “isolated” galaxies (not strongly bound to any of the three structures) are in grey, on the right side of the horizontal axis. The horizontal dashed line represents our cut to define the substructures (see text).
Current usage metrics show cumulative count of Article Views (full-text article views including HTML views, PDF and ePub downloads, according to the available data) and Abstracts Views on Vision4Press platform.
Data correspond to usage on the plateform after 2015. The current usage metrics is available 48-96 hours after online publication and is updated daily on week days.
Initial download of the metrics may take a while.