Fig. 15.
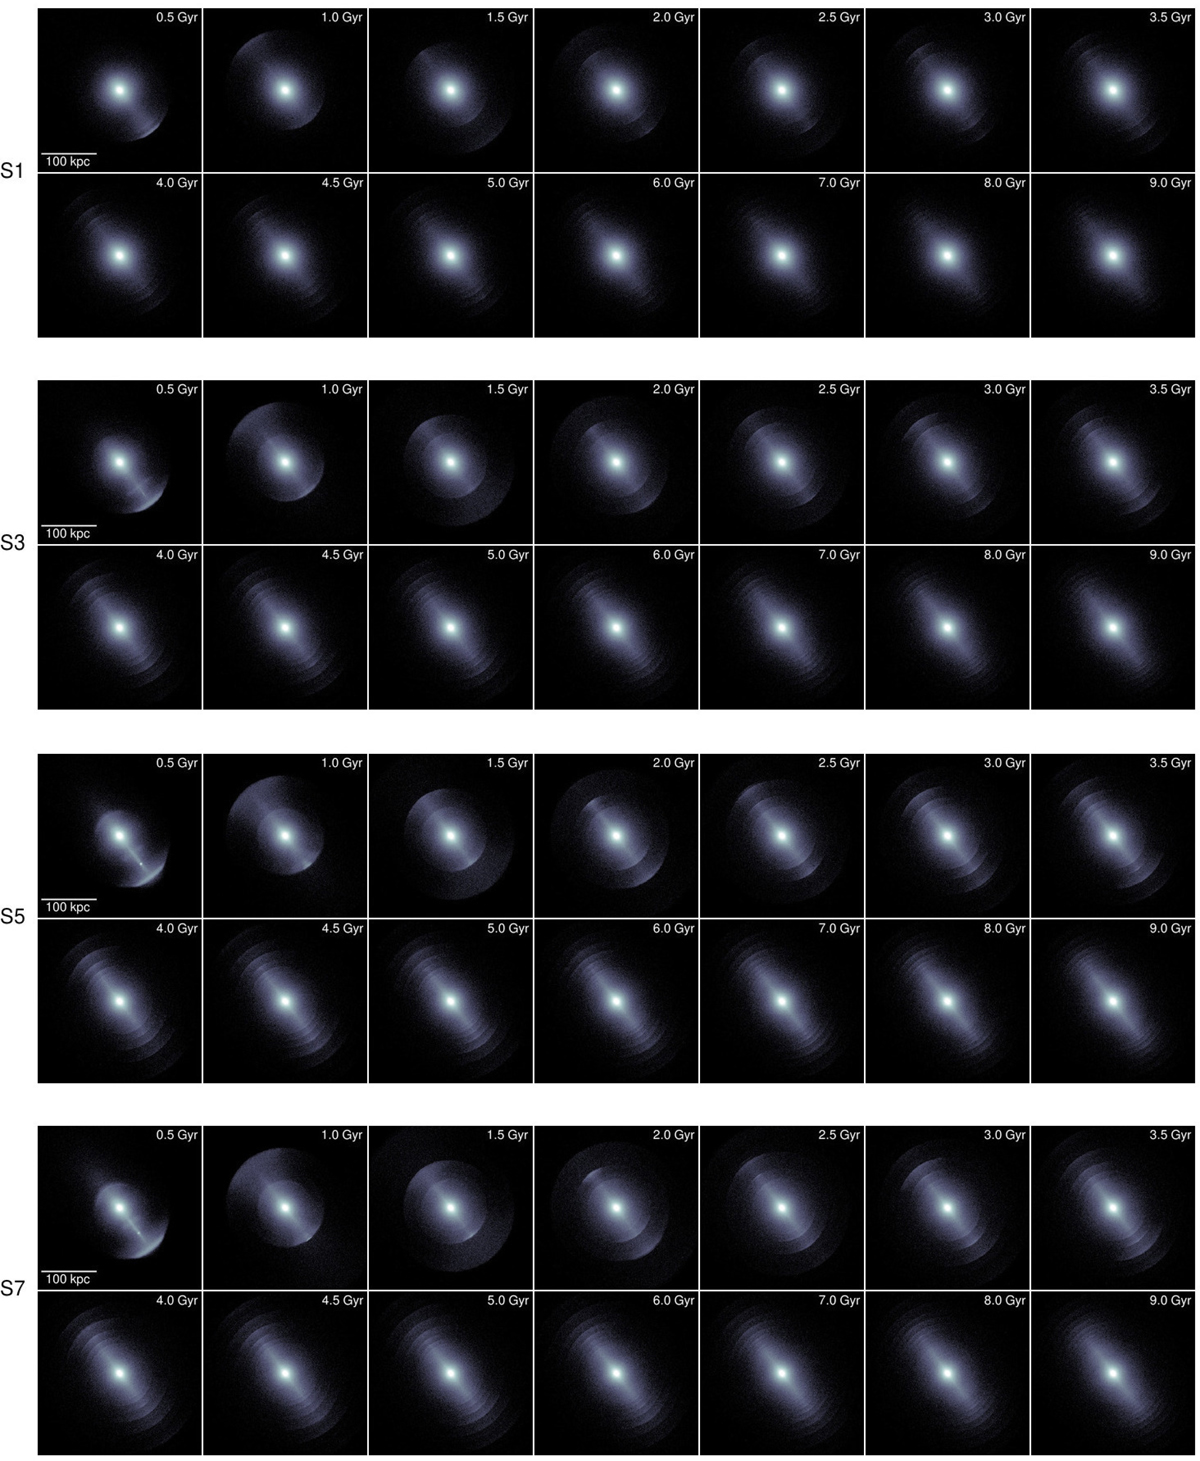
Time evolution of simulations S1, S3, S5, and S7. Different models correspond to different mass ratios with parameters given in Table 8. Maps of projected stellar mass are given. Each frame is 300 kpc wide. Times are given with respect to the instant of central passage. We note that the final frames are more widely spaced in time.
Current usage metrics show cumulative count of Article Views (full-text article views including HTML views, PDF and ePub downloads, according to the available data) and Abstracts Views on Vision4Press platform.
Data correspond to usage on the plateform after 2015. The current usage metrics is available 48-96 hours after online publication and is updated daily on week days.
Initial download of the metrics may take a while.