| Issue |
A&A
Volume 640, August 2020
|
|
|---|---|---|
| Article Number | A70 | |
| Number of page(s) | 10 | |
| Section | Cosmology (including clusters of galaxies) | |
| DOI | https://doi.org/10.1051/0004-6361/202038326 | |
| Published online | 13 August 2020 | |
Massive disc galaxies too dominated by dark matter in cosmological hydrodynamical simulations⋆
1
INAF – Osservatorio Astrofisico di Arcetri, Largo E. Fermi 5, 50127 Firenze, Italy
e-mail: This email address is being protected from spambots. You need JavaScript enabled to view it.
2
Université de Strasbourg, CNRS UMR 7550, Observatoire astronomique de Strasbourg, 11 rue de l’Université, 67000 Strasbourg, France
3
Institute for Computational Cosmology, Department of Physics, Durham University, South Road, Durham DH1 3LE, UK
4
Kapteyn Astronomical Institute, University of Groningen, Postbus 800, 9700 AV Groningen, The Netherlands
Received:
2
May
2020
Accepted:
14
June
2020
Abstract
We investigated the disc-halo connection in massive (M⋆ > 5 × 10¹⁰ M⊙) disc galaxies from the cosmological hydrodynamical simulations EAGLE and IllustrisTNG, and compared this connection with that inferred from the study of H I rotation curves in nearby massive spirals from the Spitzer Photometry and Accurate Rotation Curves dataset. We find that discrepancies between the simulated and observed discs arise both on global and local scales. Globally, the simulated discs inhabit halos that are a factor ∼4 (in EAGLE) and ∼2 (in IllustrisTNG) more massive than those derived from the rotation curve analysis of the observed dataset. We also used synthetic rotation curves of the simulated discs to demonstrate that the recovery of the halo masses from rotation curves are not systematically biased. We find that the simulations predict systems dominated by dark matter with stellar-to-total enclosed mass ratios that are a factor of 1.5−2 smaller than real galaxies at all radii. This is an alternative manifestation of the ‘failed feedback problem,’ since it indicates that simulated halos hosting massive discs have been too inefficient at converting their baryons into stars, possibly owing to an overly efficient stellar and/or AGN feedback implementation.
Key words: galaxies: kinematics and dynamics / galaxies: halos / galaxies: spiral / methods: numerical
Full Table A.1 is only available at the CDS via anonymous ftp to cdsarc.u-strasbg.fr (130.79.128.5) or via http://cdsarc.u-strasbg.fr/viz-bin/cat/J/A+A/640/A70
© ESO 2020
1. Introduction
In the standard Λ cold dark matter (ΛCDM) framework, galaxies form via the cooling and gravitational collapse of baryonic matter within the potential wells provided by dark matter halos (e.g. White & Rees 1978). Assuming a universal baryonic-to-dark matter fraction, fb ≡ Ωb/Ωc ≃ 0.188 (Planck Collaboration VI 2020), we should expect that on average halos of mass Mhalo host gas reservoirs with masses of fbMhalo out of which galaxies can form. However, the efficiency of the baryons-to-stars conversion process, f⋆ = M⋆/(fbMhalo), along with the morphological, kinematic, and chemical properties of the resulting system, depend on the complex interplay between the various physical processes that orchestrate galaxy evolution, and cannot be easily predicted a priori. Independent estimates of the so-called galaxy-halo connection at different masses, different epochs, and for galaxies of different morphological types are required to provide constraints on the whole theoretical framework of galaxy formation.
One of the key ingredients of the galaxy-halo connection is the relation between M⋆ and Mhalo (or, equivalently, between M⋆ and f⋆), the stellar-to-halo mass relation (SHMR; see Wechsler & Tinker 2018, for a recent review). This relation is commonly probed via a semi-empirical technique known as abundance matching (AM), which relates central galaxies to halos by matching the observed galaxy stellar mass function to the theoretical halo mass function, under the assumption that stellar mass increases monotonically with the mass of the host halo (Vale & Ostriker 2004; Behroozi et al. 2010; Moster et al. 2013; Kravtsov et al. 2018). Taken together, different AM studies build up a coherent picture, where f⋆ peaks at ∼20% in L⋆ galaxies and rapidly decreases at lower and higher masses. Such global inefficiency of baryon-to-star conversion is interpreted as evidence for “negative” feedback from star formation itself (for Mhalo ≲ 1012 M⊙) and active galactic nuclei (AGN) activity (for Mhalo ≳ 1012 M⊙).
Observationally, the SHMR can be probed via different techniques such as galaxy-galaxy weak lensing (Mandelbaum et al. 2006; Leauthaud et al. 2012), satellite kinematics (van den Bosch et al. 2004, 2019; More et al. 2011), internal galaxy dynamics (Persic et al. 1996; Cappellari et al. 2013; Read et al. 2017) or a combination of these (Dutton et al. 2010). While these studies generally confirm the scenario predicted by AM techniques, some of them have signalled a bimodality in the SHMR for the most luminous late- and early-type systems, in which the former systematically occupy halos with Mhalo < 1013 M⊙, and the latter are preferentially located in groups and clusters with Mhalo > 1013 M⊙. However, the paucity of spirals at M⋆ > 1011 M⊙ makes precise measurements challenging, and it is unclear whether the observed bimodality arises naturally from the shape and scatter of the SHMR (Moster et al. 2019) or is symptomatic of different star formation efficiencies associated with different galaxy types (Mandelbaum et al. 2016).
Recently, Posti et al. (2019a, hereafter PFM19) have determined the SHMR in a sample of nearby isolated disc galaxies from the Spitzer Photometry and Accurate Rotation Curves (SPARC; Lelli et al. 2016) dataset via the mass decomposition of their H I rotation curves. Their results show the existence of a monotonic SHMR for discs spanning more than four orders of magnitude in M⋆, where the most massive spirals inhabit ‘light’ dark matter halos and have f⋆ close to unity; this result is in striking contrast with predictions from AM methods. The existence of such a monotonic SHMR is intimately connected to the monotonicity of the relations between the stellar masses, sizes, and rotational velocities of discs (Posti et al. 2019b), and is evidence for the presence of different pathways for the formation of early- and late-type galaxies. This result is not incompatible with AM per se, assuming that the high-mass end of the galaxy stellar mass function is dominated by early-type systems, but outlines the existence of a class of galaxies for which feedback has failed at quenching the star formation efficiency (the “failed feedback problem”; Posti et al. 2019b). Nonetheless, while this discrepancy was noted on global scales, the main culprit (i.e. feedback), acts on the scales of galactic discs. This leads us to ask whether the detailed structure of discs is also affected by this phenomenon; in other words, we wonder whether the local dynamical structure of real massive spirals behaves as expected from the most updated models.
In this work we compare these observational results with the predictions from two of the latest cosmological hydrodynamical simulation suites, EAGLE (Schaye et al. 2015) and IllustrisTNG (Pillepich et al. 2018). While the parameters of these simulations are tuned to reproduce a number of observables at z = 0, including the galaxy stellar mass function, the detailed connection between galaxies and their hosting halos is not forced “by hand”, but follows from the complex physics of galaxy formation, which is treated self-consistently. These models are adequate to resolve the morphology and internal dynamics for several tens of massive spirals at z = 0, which makes them the best possible tools to investigate the connection between galaxy type and the SHMR.
2. Simulated and observed galaxy samples
We focus our analysis on isolated, regularly rotating disc galaxies with stellar masses M⋆ larger than 5 × 10¹⁰ M⊙. As shown by PFM19, in this mass range the derived f⋆ of discs diverges significantly from the behaviour predicted by AM methods. Our observed sample therefore consists of the 21 massive discs selected by PFM19 in this mass range. We note that the original SPARC sample includes an additional 11 massive galaxies which have been excluded in the study of PFM19, either because of their low inclination (2) or because the rotation curve modelling led to a poor inference on M⋆ or Mhalo (9). The latter case also comprises three edge-on spirals for which the rotation curve in the inner regions suffers from projection effects.
We built our simulated galaxy sample using two suites of very well-known, publicly available cosmological hydrodynamical simulations of galaxy formation in the ΛCDM framework: EAGLE and IllustrisTNG. Both simulation suites follow self-consistently the formation and evolution of galaxies and of their environments, and include treatments for star formation, stellar evolution, black-hole accretion, feedback from supernovae and AGN, primordial and metal-line gas cooling and, in the case of IllustrisTNG, the amplification and evolution of seed magnetic fields. The parameters of both models are calibrated to output a realistic population of galaxies at z = 0 in terms of their number densities, sizes, central black-hole masses, and star formation rates. Differences between the predictions of the two models are most often caused by the following: differences in the treatment of the sub-grid physics (e.g. stellar and AGN feedback implementation); differences in the accuracy with which the model calibration succeeds in reproducing the observed calibrators; the inclusion of magnetic field physics in IllustrisTNG (absent in EAGLE); and the use of different solvers for (magneto-)hydrodynamical equations1. Further details on these simulations can be found in Schaye et al. (2015), Crain et al. (2015) and Pillepich et al. (2018).
We considered the runs Ref-L0100N1504 (in EAGLE) and TNG100-1 (in IllustrisTNG). The former (latter) considers a cubic volume with a side length of 100 Mpc (111 Mpc) and uses dark matter particles with a mass of 9.7 (7.4) × 106 M⊙, gas particles (cells) with initial masses 1.8 (1.4) × 106 M⊙, and a gravitational softening length of 0.70 (0.74) kpc. Thus, both runs are adequate to resolve the morphology and kinematics of hundreds of galaxies in the mass range of interest.
Using the EAGLE and IllustrisTNG galaxy catalogues from the public releases of McAlpine et al. (2016) and Nelson et al. (2019), we selected all central sub-halos at z = 0 in our stellar mass range of interest2. We focus our study on central galaxies (centrals), given that the SPARC spirals do not show clear signs of major interactions and do not lie in the proximity of more massive systems. In order to extract a sub-sample of regularly rotating disc galaxies, we used two morpho-kinematical estimators: the ratio of the stellar rotational velocity to velocity dispersion (ℛ⋆) and the stellar disc fraction (ℱ⋆). The former is given by the ratio of the mass-weighted median rotational speed for stars orbiting within the galactic plane to their velocity dispersion perpendicular to it, while the latter is based on the fraction of non-counter-rotating stars within R < 30 kpc (Thob et al. 2019). While both estimators were already available in the EAGLE catalogues, only ℱ⋆ was pre-computed for IllustrisTNG, so we determined ℛ⋆ for our sub-sample using the procedure of Thob et al. (2019).
We label as discs those systems having ℛ⋆ > 1.7 and ℱ⋆ > 0.7. These thresholds ensure that the resulting fraction of disc galaxies decreases as a function of M⋆, following a trend that is compatible with observations from the Galaxy And Mass Assembly (GAMA) survey (Driver et al. 2011) derived by Moffett et al. (2016) (see the first panel of Fig. 1). We stress that the comparison is purely qualitative because the morphological classification used in GAMA is based on visual inspection of optical and near-infrared images. Yet, both EAGLE and IllustrisTNG galaxies seem to be in agreement with the observed trend. As an additional step, we visually inspected the morphology of the simulated discs using the (synthetic) edge-on and face-on composite optical images available from the two simulation databases, and we discarded those (few) galaxies which either appeared to be strongly warped or showed visible signs of recent interactions with companions. These selections resulted in a final sample of 46 systems for EAGLE and 130 systems for IllustrisTNG. Virtually all galaxies in this sample occupy halos with 12 < log(Mhalo/ M⊙) < 12.7, that is, consistent with environments similar to that of the Local Group. We stress, and discuss below, that our results do not depend on the adopted thresholds for ℛ⋆ and ℱ⋆. Tables listing the main properties of the galaxies studied in this work, along with examples of synthetic optical images, are presented in Appendix A.
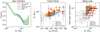 |
Fig. 1. Left panel: fraction of disc galaxies as a function of their stellar mass in EAGLE (blue lines) and IllustrisTNG (orange lines), compared to that measured in the GAMA survey by Moffett et al. (2016, shaded green area). Solid lines only show central discs; dashed lines include satellites. Central panel: stellar TFR for our sub-sample of simulated (central) discs with M⋆ > 5 × 10¹⁰ M⊙ in EAGLE (blue triangles) and IllustrisTNG (orange squares) compared with the population of nearby spirals from the SPARC dataset (circles with error bars). Galaxies from SPARC are shown as circles with error bars. Filled red circles show the sub-sample of massive discs studied in this work. Right panel: stellar mass-size relation for the same systems. |
In the central panel of Fig. 1 we compare the stellar Tully-Fisher relation (TFR; Tully & Fisher 1977) for our sample of simulated galaxies and for the SPARC sample. The definition of vflat (the velocity at which the rotation curve flattens) used for the simulated discs is based on their circular velocity profile derived assuming spherical symmetry,  . We computed vc for each galaxy in our sample, along with its decomposition into the separate contributions of stars, gas (in the case of IllustrisTNG, including “wind” particles), and dark matter. To ensure the best possible comparison with the data, we truncated our vc profiles at the H I radius as determined from the H I mass-size relation of Lelli et al. (2016)3, under the assumption that the simulated discs have an H I content analogous to that of SPARC galaxies with similar stellar mass. This stratagem allows us to bypass the various pitfalls that arise when dealing with rotation curves derived directly from simulated H I data (e.g. Oman et al. 2019, see also Sect. 4), and is based on the ansatz that H I rotation curves in real galaxies are excellent proxies for vc. We verified visually that the vast majority of vc profiles flatten out in the outer disc regions (see Appendix A) and that rotational speeds extracted in the proximity of RHI are good proxies for vflat. We therefore set vflat to the mean velocity measured in the interval between RHI and 3 kpc inward of this radius.
In general, there is a very good agreement between the simulated and observed data, with the former producing a very narrow sequence in the vflat − M⋆ plane passing in between the SPARC data points. However, important differences appear at M⋆ ≳ 1011 M⊙, where most simulated discs have large (> 250 km s−1) vflat while observed spirals show a wider distribution of rotational speeds and have a mean shifted towards lower velocities. In the right panel of Fig. 1 we compare the size-M⋆ relation for the SPARC and simulated galaxies under the assumption that the 3.6 μm effective radii (for the observed sample) are good proxies for the half-M⋆ radii (for the simulated sample). Also in this case the agreement is good, but less accurate; the simulated galaxies preferentially occupy the upper tail of the observed size distribution at fixed M⋆.
In summary, overall good agreement exists between simulated and real discs in terms of global scaling relations, although the former have slightly larger sizes and rotational speeds than the latter, especially at the high-M⋆ end. As we show below, these small differences become more evident when investigating the disc-halo connection.
3. Results
3.1. Global disc-halo connection
The authors of PFM19 determined the stellar and dark matter content of SPARC galaxies via the analysis of their H I rotation curves and 3.6 μm Spitzer photometry. A Bayesian approach led these authors to infer uni-modal, well-defined posteriors on the mass-to-light ratio and on Mhalo for 137 galaxies. In the simulations, we have the luxury of knowing precisely the stellar and dark matter content of our galaxies, which opens the possibility to two complementary approaches: we can either use the stellar and halo masses reported in the catalogues, or we can carry out rotation curve decompositions using the same vc profiles discussed in Sect. 2. We present the results derived with the former approach below, while in Appendix B we demonstrate that they do not change if we use the latter, more observationally orientated, method. This is a confirmation of the validity and robustness of the methodology of PFM19: mass decomposition of H I rotation curves is a powerful tool to determine halo masses in a ΛCDM universe, at least in the mass regime studied in this work.
In Fig. 2 we show the relation between f⋆ and M⋆ for the whole population of massive centrals in EAGLE and IllustrisTNG, the sub-sample of simulated discs, and the SPARC sample, along with the prediction from the AM method in Moster et al. (2013). In general, the SPARC massive discs have higher f⋆ compared to the simulated galaxies, which is expected given that spheroids dominate in the high-mass regime. On average, at fixed M⋆, IllustrisTNG centrals have a higher f⋆ than EAGLE centrals due to an overall higher (by a factor of ∼2) normalisation of the stellar mass function in this mass range, which implies that more numerous (i.e. less massive) halos are populated by galaxies of that M⋆. This factor of ∼2 higher normalisation, combined with the 1.4 difference in the simulated volume, explains why we find a larger abundance of massive discs in IllustrisTNG with respect to EAGLE (130 vs. 46).
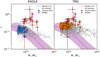 |
Fig. 2. Stellar fraction as a function of the stellar mass for simulated centrals in EAGLE (left panel) and IllustrisTNG (right panel) with M⋆ > 5 × 10¹⁰ M⊙, compared to nearby spirals from the SPARC dataset (red circles with error bar). Coloured symbols are used for our sub-sample of simulated discs. The purple shaded region shows the AM relation and related scatter from Moster et al. (2013). |
Moving our focus to disc galaxies, we notice that EAGLE and IllustrisTNG discs systematically occupy the high end of the f⋆ distribution; these discs have on average 35% (0.13 dex) higher f⋆ than the typical simulated galaxy with the same stellar mass. However, this is not enough to match the exceptionally high f⋆ of the observed spirals, which sit well above predictions from both AM methods and hydrodynamical simulations. The mismatch is expected given the offset in the TFR at high M⋆ (Fig. 1), but is also because of an additional offset in the vflat − Mhalo relation, which implies that, at a given vflat, simulated discs inhabit more massive halos than real discs. The combination of these two effects produces the mismatch observed.
Simulated discs partially overlap with the data in the (f⋆, M⋆) plane, but the comparison is limited as the former are very rare at M⋆ > 1011 M⊙ (see Sect. 4). Lowering the thresholds in ℛ⋆ and ℱ⋆ would allow for a larger sample of discs at higher M⋆ (grey squares in Fig. 2), but these would not compare favourably with SPARC given that the observed and simulated populations diverge significantly at higher masses. At 1 < M⋆/ M⊙ < 3 × 10¹¹, the median f⋆ of EAGLE (IllustrisTNG) discs is 0.13 (0.23), while in SPARC it is 0.48, with some individual systems reaching unity. These considerations highlight the difficulty of producing massive disc galaxies in numerical simulations with the observed global stellar-to-dark matter mass ratio.
3.2. Local disc-halo connection
Additional insights into the disc-halo connection can be obtained by studying the mass distribution at local scales, that is within the galaxy discs. In Fig. 3 we show how the ratio of the stellar mass M⋆(R) to the total dynamical mass Mdyn(R) enclosed within a given radius R varies as a function of R for the massive discs in SPARC and in the simulations. For SPARC galaxies we derive M⋆(R) from their 3.6 μm surface brightness profile assuming a razor-thin disc geometry and mass-to-light ratios from PFM19. Provided that the contribution of the gas to the mass budget within the disc is very small, we set  . In the simulations, instead, we compute enclosed masses directly from the particle data.
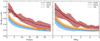 |
Fig. 3. Left panel: stellar-to-total enclosed mass profiles for massive disc galaxies in the EAGLE (blue) and IllustrisTNG (orange) simulations, compared with the data from SPARC (red). The solid lines show the median profiles, while the shaded areas represent the scatter given by the difference between the 84th and the 16th percentiles. Individual measurements for SPARC spirals are shown as red triangles. Right panel: as in the left panel, but the radii are normalised to the effective radius Reff of each galaxy. |
Figure 3 clearly shows that the simulations underestimate the contribution of stars to the total mass budget at all radii. The discrepancy is a factor of ∼2 between 1 and 2× the effective radius (Reff), and decreases down to a factor 1.5 at smaller and larger radii. Simulated discs already become dominated by dark matter at R ∼ 5 kpc, while stars in SPARC spirals constitute the main dynamical component out to R ∼ 15 kpc. This implies not only that simulated discs inhabit heavier halos than observed, but that also the internal dynamics of these discs on local scales is more dominated by dark matter than observed. In this context, the offset in the size-M⋆ relation noticeable from Fig. 1 plays an important role since, at a given M⋆, larger discs have lower stellar surface densities corresponding to lower radial acceleration at any given radius. Furthermore, the concentrations inferred from a decomposition of the rotation curves of simulated galaxies (Appendix B) are a factor of ∼2 higher than those determined for SPARC galaxies of the same inferred Mhalo. This drives down M⋆(R)/Mdyn(R) even further in the inner galactic regions of the simulated galaxies.
This local discrepancy is another important manifestation of the peculiar galaxy-halo connection of massive discs, which is coupled to the global discrepancy already noted by PFM19. Our new findings on the local stellar-to-dynamical mass ratio are important in this context. We could argue that to solve the f⋆ discrepancy on global scales, discs would need to inhabit even higher-concentration halos such that the same circular velocity is obtained in less massive halos. However, this would further exacerbate the (M⋆/Mdyn)( < R) discrepancy on local scales, ruling this out as a viable solution. Thus, all of our results combined suggest that to explain their observed properties massive spirals need to have less dark matter throughout than expected from AM models.
4. Discussion and summary
The relation between the stellar and dark matter masses in nearby disc galaxies seem to be well described by a simple power law (Posti et al. 2019b), which translates into a monotonic relation between M⋆ and the star formation efficiency f⋆ (PFM19). As a consequence, massive (M⋆ ≳ 5 × 10¹⁰ M⊙) spirals depart significantly from the predictions of AM methods, reaching f⋆ of about unity at the high-M⋆ end (failed feedback problem). This result is largely independent of the halo profile model adopted in the kinematic decomposition, which we also verified using the various mass models provided by Ghari et al. (2019) and Li et al. (2020) for the SPARC dataset.
In this work we analysed this discrepancy, both on a global and local scale, comparing observations with predictions from two of the best-known recent cosmological hydrodynamical simulations, EAGLE and IllustrisTNG. These simulations feature an optimal compromise between box size and particle masses, which allows us to sample at sub-kiloparsec-scale resolution several tens of discs in the interested range of stellar masses. Also, the parameters of these models are explicitly tuned to reproduce several properties of the z = 0 galaxy population, providing a solid starting point to carry out further investigations. Our results show that simulated discs appear to inhabit overly massive dark matter halos, and that their dynamics, unlike real spirals, are everywhere dark matter dominated by a wide margin.
An important question is whether our results are unique to the EAGLE and IllustrisTNG runs studied in this work or can be generalised to other simulations that adopt different resolution and/or sub-grid schemes. As already pointed out in other studies (Scannapieco et al. 2012; Hopkins et al. 2018), feedback implementation is likely to have a much larger impact on the properties of simulated galaxies than the resolution itself. As an example, the EAGLE L025N0752 run has about twice the linear resolution of the L100N1504 run studied in this paper, yet the SHMR is the same (see Fig. 8 in Schaye et al. 2015), simply because feedback has been re-calibrated to achieve this. On the other hand, the original Illustris suite (Vogelsberger et al. 2014) is comparable with IllustrisTNG in terms of resolution, but the different feedback implementation leads to enormous differences in the galaxy mass profiles (Figs. 3 and 4 in Lovell et al. 2018) Interestingly, the Magneticum simulations have a factor ∼6 lower mass resolution than the runs considered in this paper and feature both discs and spheroids with very large f⋆ (up to ∼0.5; Teklu et al. 2017), suggesting that particle mass and f⋆ may be positively correlated. Moving to zoom-in runs, in the NIHAO suite (Wang et al. 2015) the mass resolution varies depending on the system mass. This mass resolution still remains several times higher than EAGLE and IllustrisTNG for the most massive galaxies, yet the SHMR very closely follows the prediction from AM that has a maximum f⋆ of ∼0.3 (Fig. 5 in Wang et al. 2015). Similar values of f⋆ are found in the NIHAO-UHD runs (Buck et al. 2020). The most massive (M⋆ ∼ 1011 M⊙) discs in the Latte/FIRE-2 simulations (Hopkins et al. 2018) have a gas particle mass of ∼104 M⊙ and f⋆ between 0.3 and 0.4 (Ma et al. 2018), which is similar to what we find in IllustrisTNG. We acknowledge the existence of a broad range of predictions in theoretical models, mostly originating from different implementations of the stellar and AGN feedback physics. We stress, however, that the goal of the present work is not to offer a complete picture of the disc-halo connection in the vast realm of simulations, but rather to highlight the presence of important discrepancies between models and data using two complementary, well-studied suites that have been specifically designed to capture the properties of z = 0 galaxies.
In the simulations we computed stellar and halo masses using two different approaches. We extracted these values directly from the galaxy catalogues and determined them via a mass-decomposition of circular velocity profiles. The two methods lead to compatible results (see Fig. B.1), which incidentally validates the approach adopted by PFM19 for their analysis. However, rotation curves in SPARC are determined from H I (and, in part, Hα) data, and we may argue that tracing the azimuthal speed of cold gas in the simulated galaxies, rather then extracting their vc profile, would lead to a more direct comparison with the observations. We checked this using the approach described by Oman et al. (2019) to derive the H I content of the gas particles in the simulations, and we measured the H I rotational speed in annuli of 1 kpc width orientated according to the H I angular momentum vector of each galaxy. Unfortunately, we found that the H I kinematics of simulated discs is strongly disturbed (especially in EAGLE) and only approaches the circular velocity in rare cases. The reasons for this remain to be clarified, but may well be related to disturbances induced by over-efficient feedback from star formation.
Another explanation for the lack of massive discs with high f⋆ in the models may be that the SPARC sample, which is not volume-limited, is made of rare, special systems that are not representative of the overall population of spirals. A simple argument demonstrates that this is not the case: 13 out of the 21 high-f⋆ SPARC galaxies are located within a distance of 62 Mpc, which encompasses a spherical volume equivalent to those of the runs studied in this work. The systematic lack of these objects in the simulations must therefore be due to a deficiency of the models, rather than to a bias in the observations.
We have shown that the discrepancy in the stellar-to-dark matter ratio of simulated to observed systems is both global and local and extends well into their inner regions, where the former are dominated by dark matter at all radii (except for the innermost ∼5 kpc), while in the latter the stellar component dominates the galaxy dynamics. The dynamical importance of stars in observed massive spirals is well known and emerges directly from the shape of their rotation curves, which follows the light profile very closely (the so-called Renzo’s rule; Sancisi et al. 2004) for several kiloparsec before flattening out. The small-scale discrepancy was already outlined by Ludlow et al. (2017) when investigating the radial acceleration relation4 (McGaugh et al. 2016) in EAGLE discs, by Lovell et al. (2018) for high-mass IllustrisTNG galaxies, and seems to be even stronger in other simulation suites such as SIMBA (Davé et al. 2019; Glowacki et al. 2020). In this work, we highlighted how the problem exists at all scales. Clearly, at a fixed f⋆, differences in the halo density profiles and in the disc sizes can lead to very diverse M⋆/Mdyn profiles, thus the relation between small and large scales is not trivially set by f⋆. The simulated halos appear to be highly concentrated, probably as a result of halo contraction, which represents a plausible explanation for the discrepancy with observations in the regions of the discs.
It is possible to draw a parallel between these simulated discs and dwarf galaxies, another category of objects dominated by dark matter. The dominance of dark matter in the simulated discs results in a poor variety in their circular velocity profiles (not shown in this work). As the star formation efficiency of the host halos is nearly constant (Fig. 2), this results in a very narrow TFR (Fig. 1) and little scatter in the M⋆/Mdyn profiles (Fig. 3). In contrast, the observed galaxies seem to show more variety in their f⋆, rotation curves and M⋆/Mdyn profiles. This echoes the ‘diversity problem’ for dwarf galaxies (Oman et al. 2015), where the self-similar shape of vc profiles in simulated dwarfs is in tension with the diversity in the H I rotation curves that can be found in the observed population, at a fixed rotational speed. There are however two important differences between the low- and high-mass regimes. The first is that the H I kinematics in dwarf galaxies is typically more disturbed (Oh et al. 2015; Iorio et al. 2017) and this results in more uncertain rotation curves which can be, to some extent, model-dependent (e.g. Spekkens & Sellwood 2007). The second is that the diversity problem in dwarfs is closely related to the cusp-core issue (Flores & Primack 1994; Moore 1994), which concerns the innermost central regions of dwarfs, whereas the discrepancy at the high-mass end is both local and global.
The results of PFM19 suggest the existence of multiple pathways for the creation of massive late-type and early-type systems; the former result from more gentle merging histories, which would lead to lower dark matter content and higher star formation efficiencies; although rejuvenation of ancient spheroids via gas-rich mergers is also a possibility (see Jackson et al. 2020).
We note that such a scenario is not inconsistent with the existence of a unique SHMR (with scatter), as predicted by current ΛCDM models. As discussed by Moster et al. (2019), active and passive systems are expected to distribute differently within the scatter of the SHMR because of the diverse accretion histories of their halos. This effect, combined with the shallow slope of the SHMR at large masses, is such that at a fixed M⋆ active (passive) galaxies at z = 0 are scattered preferentially towards lower (higher) halo masses; this is in line with the observed trend. However, at a M⋆ of 1011 M⊙, this should lead to a difference of ∼0.2 dex in the f⋆ of active and passive galaxies, which is approximately what we find by comparing our EAGLE and IllustrisTNG discs with the whole population of centrals at similar M⋆, but is largely insufficient to justify the difference between the AM prediction and the observed data.
It is possible, however, that a larger scatter in the SHMR may help in reconciling observations and theory. Indeed, the recent discovery of super-spirals (Ogle et al. 2019a), which are extremely massive (log(M⋆/ M⊙) > 11.5) late-type systems with rotational speed up to ∼570 km s−1 (Ogle et al. 2019b), suggests that the population of high-M⋆ disc galaxies is more heterogeneous than previously thought. Such systems must be rare, as only three objects with H I velocity width (W50) larger than 800 km s−1 are present in the ALFALFA-100 catalogue (Haynes et al. 2018). Yet, their existence is symptomatic of a wider distribution of feedback efficiencies at fixed halo mass. In the specific case of the massive spirals considered in this work, less efficient feedback from stars and/or AGNs can help bring the models closer to the data on both global and local scales; this can lead to higher stellar masses at fixed halo mass and to smaller disc sizes as a consequence of less efficient angular momentum redistribution from the outer to the inner regions of the halo’s gas reservoir (e.g. Brook et al. 2012).
While a lower feedback efficiency may alleviate the problems discussed in this work, the way it would affect other galaxy properties remains to be clarified. For instance, different theoretical models of galaxy evolution give very different predictions for the growth of discs in the absence of galaxy-scale, powerful feedback episodes (e.g. Navarro & Steinmetz 1997; Pezzulli et al. 2017). More importantly, the increase of f⋆ is very likely to have an impact on the dark matter distribution by promoting halo contraction (Blumenthal et al. 1984; Gnedin et al. 2004; Dutton et al. 2016), which may exacerbate the local problem discussed in this work by lowering the M⋆/Mdyn profile in the inner regions, although halo expansion associated with higher f⋆ is sometimes seen in simulations (see Lovell et al. 2018). This local problem might be considered as a residual, restricted to massive discs, of the old problem pointed out by Navarro & Steinmetz (2000) who already found overly concentrated dark matter halos in early hydrodynamical simulations of Milky Way-like systems. In this context, the solution for the local and global discrepancies presented in this work hinges on whether a feedback recipe that increases the star formation efficiency in ∼1012 M⊙ halos, while simultaneously avoiding central over-condensation and excessive halo contraction, is achievable. Future generations of hydrodynamical simulations of galaxy formation may help to clarify this point.
In summary, our findings indicate that the population of high-mass spirals emerging from the latest ΛCDM cosmological simulations EAGLE and IllustrisTNG differs systematically from that which we observe in terms of both local and global stellar-to-dark matter content. The difference cannot be explained in terms of selection effects or limitations in the modelling of the observed data, and clearly points to a mismatch in the efficiency of massive spirals at converting their baryons into stars. Ultimately, the difference can be understood in terms of a more scattered galaxy-halo connection at the high end of the stellar mass function, which, at the current stage, does not seem to emerge from numerical models in ΛCDM framework.
EAGLE uses a modified version of the SPH code GADGET-2 (Springel 2005), while IllustrisTNG uses the moving-mesh code AREPO (Springel 2010).
A “central” galaxy is the most massive sub-halo of a friend-of-friends group. In each sub-halo, M⋆ is computed within a sphere of 30 kpc of radius centred on the minimum of the gravitational potential.
We note that discs in EAGLE and IllustrisTNG reproduces this relation well (Bahé et al. 2016; Diemer et al. 2019).
See also McGaugh et al. (2007) for a discussion of the mass discrepancy at all radii.
Acknowledgments
The authors thank the referee, Florent Renaud, for his careful and thoughtful report. AM and GC acknowledge the support by INAF/Frontiera through the “Progetti Premiali” funding scheme of the Italian Ministry of Education, University, and Research. BF acknowledges funding from the Agence Nationale de la Recherche (ANR project ANR-18-CE31-0006 and ANR-19-CE31-0017) and from the European Research Council (ERC) under the European Union’s Horizon 2020 research and innovation programme (grant agreement No. 834148). LP acknowledges support from the Centre National d’Etudes Spatiales (CNES). KO acknowledges support by the European Research Council (ERC) through Advanced Investigator Grant to C.S. Frenk, DMIDAS (GA 786910).
References
- Bahé, Y. M., Crain, R. A., Kauffmann, G., et al. 2016, MNRAS, 456, 1115 [NASA ADS] [CrossRef] [Google Scholar]
- Behroozi, P. S., Conroy, C., & Wechsler, R. H. 2010, ApJ, 717, 379 [NASA ADS] [CrossRef] [Google Scholar]
- Blumenthal, G. R., Faber, S. M., Primack, J. R., & Rees, M. J. 1984, Nature, 311, 517 [NASA ADS] [CrossRef] [Google Scholar]
- Brook, C. B., Stinson, G., Gibson, B. K., et al. 2012, MNRAS, 419, 771 [NASA ADS] [CrossRef] [Google Scholar]
- Buck, T., Obreja, A., Macciò, A. V., et al. 2020, MNRAS, 491, 3461 [Google Scholar]
- Cappellari, M., Scott, N., Alatalo, K., et al. 2013, MNRAS, 432, 1709 [NASA ADS] [CrossRef] [Google Scholar]
- Crain, R. A., Schaye, J., Bower, R. G., et al. 2015, MNRAS, 450, 1937 [NASA ADS] [CrossRef] [Google Scholar]
- Davé, R., Anglés-Alcázar, D., Narayanan, D., et al. 2019, MNRAS, 486, 2827 [NASA ADS] [CrossRef] [Google Scholar]
- Diemer, B., Stevens, A. R. H., Lagos, C. D. P., et al. 2019, MNRAS, 487, 1529 [NASA ADS] [CrossRef] [Google Scholar]
- Driver, S. P., Hill, D. T., Kelvin, L. S., et al. 2011, MNRAS, 413, 971 [NASA ADS] [CrossRef] [Google Scholar]
- Dutton, A. A., & Macciò, A. V. 2014, MNRAS, 441, 3359 [NASA ADS] [CrossRef] [Google Scholar]
- Dutton, A. A., Conroy, C., van den Bosch, F. C., Prada, F., & More, S. 2010, MNRAS, 407, 2 [NASA ADS] [CrossRef] [Google Scholar]
- Dutton, A. A., Macciò, A. V., Dekel, A., et al. 2016, MNRAS, 461, 2658 [NASA ADS] [CrossRef] [Google Scholar]
- Flores, R. A., & Primack, J. R. 1994, ApJ, 427, L1 [NASA ADS] [CrossRef] [Google Scholar]
- Ghari, A., Famaey, B., Laporte, C., & Haghi, H. 2019, A&A, 623, A123 [Google Scholar]
- Glowacki, M., Elson, E., & Davé, R. 2020, MNRAS, submitted [arXiv:2003.03402] [Google Scholar]
- Gnedin, O. Y., Kravtsov, A. V., Klypin, A. A., & Nagai, D. 2004, ApJ, 616, 16 [NASA ADS] [CrossRef] [Google Scholar]
- Haynes, M. P., Giovanelli, R., Kent, B. R., et al. 2018, ApJ, 861, 49 [Google Scholar]
- Hopkins, P. F., Wetzel, A., Kereš, D., et al. 2018, MNRAS, 480, 800 [NASA ADS] [CrossRef] [Google Scholar]
- Iorio, G., Fraternali, F., Nipoti, C., et al. 2017, MNRAS, 466, 4159 [NASA ADS] [Google Scholar]
- Jackson, R. A., Martin, G., Kaviraj, S., et al. 2020, MNRAS, 494, 5568 [CrossRef] [Google Scholar]
- Kravtsov, A. V., Vikhlinin, A. A., & Meshcheryakov, A. V. 2018, Astron. Lett., 44, 8 [NASA ADS] [CrossRef] [Google Scholar]
- Leauthaud, A., Tinker, J., Bundy, K., et al. 2012, ApJ, 744, 159 [NASA ADS] [CrossRef] [Google Scholar]
- Lelli, F., McGaugh, S. S., & Schombert, J. M. 2016, AJ, 152, 157 [Google Scholar]
- Li, P., Lelli, F., McGaugh, S., & Schombert, J. 2020, ApJS, 247, 31 [Google Scholar]
- Lovell, M. R., Pillepich, A., Genel, S., et al. 2018, MNRAS, 481, 1950 [Google Scholar]
- Ludlow, A. D., Benítez-Llambay, A., Schaller, M., et al. 2017, Phys. Rev. Lett., 118, 161103 [NASA ADS] [CrossRef] [Google Scholar]
- Ma, X., Hopkins, P. F., Garrison-Kimmel, S., et al. 2018, MNRAS, 478, 1694 [NASA ADS] [CrossRef] [Google Scholar]
- Mandelbaum, R., Seljak, U., Kauffmann, G., Hirata, C. M., & Brinkmann, J. 2006, MNRAS, 368, 715 [Google Scholar]
- Mandelbaum, R., Wang, W., Zu, Y., et al. 2016, MNRAS, 457, 3200 [NASA ADS] [CrossRef] [Google Scholar]
- McAlpine, S., Helly, J. C., Schaller, M., et al. 2016, Astron. Comput., 15, 72 [NASA ADS] [CrossRef] [Google Scholar]
- McGaugh, S. S., de Blok, W. J. G., Schombert, J. M., Kuzio de Naray, R., & Kim, J. H. 2007, ApJ, 659, 149 [NASA ADS] [CrossRef] [Google Scholar]
- McGaugh, S. S., Lelli, F., & Schombert, J. M. 2016, Phys. Rev. Lett., 117, 201101 [NASA ADS] [CrossRef] [Google Scholar]
- Moffett, A. J., Ingarfield, S. A., Driver, S. P., et al. 2016, MNRAS, 457, 1308 [NASA ADS] [CrossRef] [Google Scholar]
- Moore, B. 1994, Nature, 370, 629 [NASA ADS] [CrossRef] [Google Scholar]
- More, S., van den Bosch, F. C., Cacciato, M., et al. 2011, MNRAS, 410, 210 [NASA ADS] [CrossRef] [Google Scholar]
- Moster, B. P., Naab, T., & White, S. D. M. 2013, MNRAS, 428, 3121 [NASA ADS] [CrossRef] [Google Scholar]
- Moster, B. P., Naab, T., & White, S. D. M. 2019, MNRAS, submitted [arXiv:1910.09552] [Google Scholar]
- Navarro, J. F., & Steinmetz, M. 1997, ApJ, 478, 13 [NASA ADS] [CrossRef] [Google Scholar]
- Navarro, J. F., & Steinmetz, M. 2000, ApJ, 528, 607 [NASA ADS] [CrossRef] [Google Scholar]
- Navarro, J. F., Frenk, C. S., & White, S. D. M. 1996, ApJ, 462, 563 [NASA ADS] [CrossRef] [Google Scholar]
- Nelson, D., Springel, V., Pillepich, A., et al. 2019, Comput. Astrophys. Cosmol., 6, 2 [Google Scholar]
- Ogle, P. M., Lanz, L., Appleton, P. N., Helou, G., & Mazzarella, J. 2019a, ApJS, 243, 14 [Google Scholar]
- Ogle, P. M., Jarrett, T., Lanz, L., et al. 2019b, ApJ, 884, L11 [Google Scholar]
- Oh, S.-H., Hunter, D. A., Brinks, E., et al. 2015, AJ, 149, 180 [NASA ADS] [CrossRef] [Google Scholar]
- Oman, K. A., Navarro, J. F., Fattahi, A., et al. 2015, MNRAS, 452, 3650 [CrossRef] [Google Scholar]
- Oman, K. A., Marasco, A., Navarro, J. F., et al. 2019, MNRAS, 482, 821 [NASA ADS] [CrossRef] [Google Scholar]
- Persic, M., Salucci, P., & Stel, F. 1996, MNRAS, 281, 27 [NASA ADS] [CrossRef] [Google Scholar]
- Pezzulli, G., Fraternali, F., & Binney, J. 2017, MNRAS, 467, 311 [NASA ADS] [Google Scholar]
- Pillepich, A., Springel, V., Nelson, D., et al. 2018, MNRAS, 473, 4077 [NASA ADS] [CrossRef] [Google Scholar]
- Planck Collaboration VI. 2020, A&A, in press, https://doi.org/10.1051/0004-6361/201833910 [Google Scholar]
- Posti, L., Fraternali, F., & Marasco, A. 2019a, A&A, 626, A56 [NASA ADS] [CrossRef] [EDP Sciences] [Google Scholar]
- Posti, L., Marasco, A., Fraternali, F., & Famaey, B. 2019b, A&A, 629, A59 [CrossRef] [EDP Sciences] [Google Scholar]
- Read, J. I., Iorio, G., Agertz, O., & Fraternali, F. 2017, MNRAS, 467, 2019 [NASA ADS] [Google Scholar]
- Sancisi, R. 2004, in Dark Matter in Galaxies, eds. S. Ryder, D. Pisano, M. Walker, & K. Freeman, IAU Symp., 220, 233 [NASA ADS] [Google Scholar]
- Scannapieco, C., Wadepuhl, M., Parry, O. H., et al. 2012, MNRAS, 423, 1726 [Google Scholar]
- Schaye, J., Crain, R. A., Bower, R. G., et al. 2015, MNRAS, 446, 521 [Google Scholar]
- Spekkens, K., & Sellwood, J. A. 2007, ApJ, 664, 204 [NASA ADS] [CrossRef] [Google Scholar]
- Springel, V. 2005, MNRAS, 364, 1105 [NASA ADS] [CrossRef] [Google Scholar]
- Springel, V. 2010, MNRAS, 401, 791 [NASA ADS] [CrossRef] [Google Scholar]
- Teklu, A. F., Remus, R.-S., Dolag, K., & Burkert, A. 2017, MNRAS, 472, 4769 [NASA ADS] [CrossRef] [Google Scholar]
- Thob, A. C. R., Crain, R. A., McCarthy, I. G., et al. 2019, MNRAS, 485, 972 [Google Scholar]
- Tully, R. B., & Fisher, J. R. 1977, A&A, 500, 105 [Google Scholar]
- Vale, A., & Ostriker, J. P. 2004, MNRAS, 353, 189 [Google Scholar]
- van den Bosch, F. C., Norberg, P., Mo, H. J., & Yang, X. 2004, MNRAS, 352, 1302 [NASA ADS] [CrossRef] [Google Scholar]
- van den Bosch, F. C., Lange, J. U., & Zentner, A. R. 2019, MNRAS, 488, 4984 [NASA ADS] [CrossRef] [Google Scholar]
- Vogelsberger, M., Genel, S., Springel, V., et al. 2014, MNRAS, 444, 1518 [NASA ADS] [CrossRef] [Google Scholar]
- Wang, L., Dutton, A. A., Stinson, G. S., et al. 2015, MNRAS, 454, 83 [NASA ADS] [CrossRef] [Google Scholar]
- Wechsler, R. H., & Tinker, J. L. 2018, ARA&A, 56, 435 [NASA ADS] [CrossRef] [Google Scholar]
- White, S. D. M., & Rees, M. J. 1978, MNRAS, 183, 341 [NASA ADS] [CrossRef] [Google Scholar]
Appendix A: Supplementary material
Tables A.1 and A.2 list the main properties of the samples of simulated and observed massive disc galaxies studied in this work. These tables are available their entirety in electronic form at the CDS.
Main properties of the sample of simulated massive discs studied in this work.
Main properties for the sample of massive nearby spirals studied in this work.
In Figs. A.1 and A.2 we show face- and edge-on images for four representative massive disc galaxies extracted from the simulated sample studied in this work, along with their circular velocity profiles, truncated at the expected H I radius, decomposed into the contributions from stars, gas, and dark matter. A full database of such figures for all simulated galaxies studied in this work can be downloaded online5.
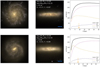 |
Fig. A.1. Two examples of massive (central) disc galaxies from the EAGLE simulations (run Ref-L0100N1504). The left and central panels show the systems from a face- and edge-on perspective. The right panels show the total circular velocity profiles (solid black lines), along with the separate contributions (dashed lines) from stars (orange), gas (blue), and dark matter (magenta). The vertical arrow shows the half-M⋆ radius. |
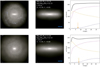 |
Fig. A.2. As in Fig. A.1, but for two massive (central) discs from the IllustrisTNG simulations (run TNG100-1). |
Appendix B: Mass decomposition of synthetic rotation curves
We show in this appendix that our results do not change if we compute stellar and halo masses in the simulations using a procedure analogous to that of PFM19, based on the mass-decomposition of rotation curves. To do so, we consider the synthetic rotation curves of our simulated galaxies truncated at their expected HI radius (see Sect. 2) and model them as
 (B.1)
(B.1)
where vDM, v⋆, and vgas are, respectively, the contributions of dark matter, stars, and gas to the circular velocity profile.
As in PFM19, we assume Navarro-Frank-White (NFW; Navarro et al. 1996) dark matter halo profiles. These are fully described by their virial mass M200 and their concentration c, both of which are free parameters of the model. We assume  , where
  is given by GM⋆(< R)/R and is assumed to be known, and Υ is a free parameter that mimics the effect of a (radially-constant) mass-to-light ratio. With this parametrisation, deviations from Υ = 1 correspond to variations in the inferred stellar mass with respect to its true value. Finally, we fix
  to its true value (GMgas(< R)/R) as this gives only a minor contribution to the vc. Following PFM19, the three free parameters of the model (M200, c and Υ) are fit to the data via a Bayesian approach, which adopts a prior on the c − M200 relation motivated by N-body cosmological simulations (Dutton & Macciò 2014).
In the top panels of Fig. B.1 we compare the stellar and halo masses derived with this method with their true values taken from the simulation catalogues. Clearly, there is excellent agreement between true and inferred masses with consequently little variation in the f⋆ − M⋆ relation (bottom panels of Fig. B.1). We notice systematic shifts upwards for the inferred values of f⋆, with typical δf⋆/f⋆ of 22% in EAGLE and 29% in IllustrisTNG, which however fall well within the quoted uncertainties. This is a confirmation of the validity of the PFM19 method and indicates that NFW halos, in the mass range considered in this work, are good proxies for the dark matter density profiles in EAGLE and IllustrisTNG.
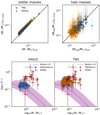 |
Fig. B.1. Top left panel: comparison between the “true” stellar masses of the simulated disc galaxies (x-axis) and those derived via the decomposition of their synthetic rotation curve (y-axis). EAGLE (IllustrisTNG) galaxies are shown as blue triangles (orange squares). Error bars are given from the difference between the 84th and 16th percentiles in the posterior probability distributions. The dashed line shows the one-to-one relation. Top right panel: same, but for the halo masses. Bottom panels: plot of f⋆ − M⋆ for the simulated discs using stellar and halo masses from rotation curve decomposition. Colours and symbols are shown as in Fig. 2. |
All Tables
Main properties of the sample of simulated massive discs studied in this work.
Main properties for the sample of massive nearby spirals studied in this work.
All Figures
|
Fig. 1. Left panel: fraction of disc galaxies as a function of their stellar mass in EAGLE (blue lines) and IllustrisTNG (orange lines), compared to that measured in the GAMA survey by Moffett et al. (2016, shaded green area). Solid lines only show central discs; dashed lines include satellites. Central panel: stellar TFR for our sub-sample of simulated (central) discs with M⋆ > 5 × 10¹⁰ M⊙ in EAGLE (blue triangles) and IllustrisTNG (orange squares) compared with the population of nearby spirals from the SPARC dataset (circles with error bars). Galaxies from SPARC are shown as circles with error bars. Filled red circles show the sub-sample of massive discs studied in this work. Right panel: stellar mass-size relation for the same systems. |
| In the text | |
|
Fig. 2. Stellar fraction as a function of the stellar mass for simulated centrals in EAGLE (left panel) and IllustrisTNG (right panel) with M⋆ > 5 × 10¹⁰ M⊙, compared to nearby spirals from the SPARC dataset (red circles with error bar). Coloured symbols are used for our sub-sample of simulated discs. The purple shaded region shows the AM relation and related scatter from Moster et al. (2013). |
| In the text | |
|
Fig. 3. Left panel: stellar-to-total enclosed mass profiles for massive disc galaxies in the EAGLE (blue) and IllustrisTNG (orange) simulations, compared with the data from SPARC (red). The solid lines show the median profiles, while the shaded areas represent the scatter given by the difference between the 84th and the 16th percentiles. Individual measurements for SPARC spirals are shown as red triangles. Right panel: as in the left panel, but the radii are normalised to the effective radius Reff of each galaxy. |
| In the text | |
|
Fig. A.1. Two examples of massive (central) disc galaxies from the EAGLE simulations (run Ref-L0100N1504). The left and central panels show the systems from a face- and edge-on perspective. The right panels show the total circular velocity profiles (solid black lines), along with the separate contributions (dashed lines) from stars (orange), gas (blue), and dark matter (magenta). The vertical arrow shows the half-M⋆ radius. |
| In the text | |
|
Fig. A.2. As in Fig. A.1, but for two massive (central) discs from the IllustrisTNG simulations (run TNG100-1). |
| In the text | |
|
Fig. B.1. Top left panel: comparison between the “true” stellar masses of the simulated disc galaxies (x-axis) and those derived via the decomposition of their synthetic rotation curve (y-axis). EAGLE (IllustrisTNG) galaxies are shown as blue triangles (orange squares). Error bars are given from the difference between the 84th and 16th percentiles in the posterior probability distributions. The dashed line shows the one-to-one relation. Top right panel: same, but for the halo masses. Bottom panels: plot of f⋆ − M⋆ for the simulated discs using stellar and halo masses from rotation curve decomposition. Colours and symbols are shown as in Fig. 2. |
| In the text | |
Current usage metrics show cumulative count of Article Views (full-text article views including HTML views, PDF and ePub downloads, according to the available data) and Abstracts Views on Vision4Press platform.
Data correspond to usage on the plateform after 2015. The current usage metrics is available 48-96 hours after online publication and is updated daily on week days.
Initial download of the metrics may take a while.