Fig. 2.
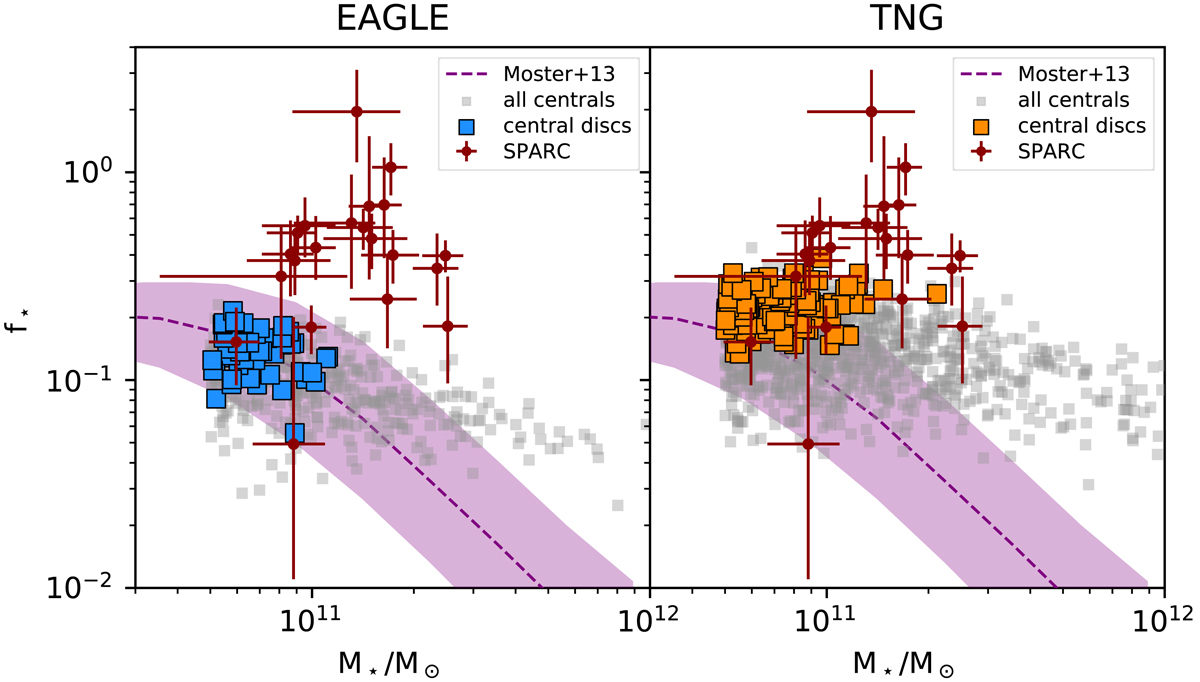
Stellar fraction as a function of the stellar mass for simulated centrals in EAGLE (left panel) and IllustrisTNG (right panel) with M⋆ > 5 × 10¹⁰ M⊙, compared to nearby spirals from the SPARC dataset (red circles with error bar). Coloured symbols are used for our sub-sample of simulated discs. The purple shaded region shows the AM relation and related scatter from Moster et al. (2013).
Current usage metrics show cumulative count of Article Views (full-text article views including HTML views, PDF and ePub downloads, according to the available data) and Abstracts Views on Vision4Press platform.
Data correspond to usage on the plateform after 2015. The current usage metrics is available 48-96 hours after online publication and is updated daily on week days.
Initial download of the metrics may take a while.