| Issue |
A&A
Volume 690, October 2024
|
|
|---|---|---|
| Article Number | A268 | |
| Number of page(s) | 9 | |
| Section | Extragalactic astronomy | |
| DOI | https://doi.org/10.1051/0004-6361/202449413 | |
| Published online | 15 October 2024 | |
The hot circumgalactic medium in the eROSITA All-Sky Survey
II. Scaling relations between X-ray luminosity and galaxies’ mass
1
Max-Planck-Institut für extraterrestrische Physik (MPE), Gießenbachstraße 1, 85748 Garching bei München, Germany
2
INAF-Osservatorio Astronomico di Brera, Via E. Bianchi 46, 23807 Merate (LC), Italy
3
NASA Goddard Space Flight Center, Greenbelt, MD 20771, USA
4
Center for Space Sciences and Technology, University of Maryland, 1000 Hilltop Circle, Baltimore, MD 21250, USA
5
Max-Planck-Institut für Astronomie, Königstuhl 17, 69117 Heidelberg, Germany
6
European Southern Observatory, Karl Schwarzschildstrasse 2, 85748 Garching bei München, Germany
7
Department of Astronomy, University of Science and Technology of China, Hefei 230026, China
8
School of Astronomy and Space Science, University of Science and Technology of China Hefei 230026, China
Received:
30
January
2024
Accepted:
23
June
2024
Abstract
Aims. Understanding how the properties of galaxies relate to the properties of the hot circum-galactic medium (CGM) around them can constrain galaxy evolution models. We aim to measure the scaling relations between the X-ray luminosity of the hot CGM and the fundamental properties (stellar mass and halo mass) of a galaxy.
Methods. We measured the X-ray luminosity of the hot CGM based on the surface brightness profiles of central galaxy samples measured from Spectrum Roentgen Gamma (SRG)/eROSITA all-sky survey data. We related the X-ray luminosity to the galaxies’ stellar and halo mass, and we compared the observed relations to the self-similar model and intrinsic (i.e., not forward-modeled) output of the IllustrisTNG, EAGLE, and SIMBA simulations.
Results. The average hot CGM X-ray luminosity (LX, CGM) correlates with the galaxy’s stellar mass (M*). It increases from (1.6 ± 2.1) × 1039 erg s−1 to (3.4 ± 0.3) × 1041 erg s−1, when log(M*) increases from 10.0 to 11.5. A power law describes the correlation as log(LX, CGM) = (2.4 ± 0.1)×log(M*)+(14.6 ± 1.5). The hot CGM X-ray luminosity as a function of halo mass is measured within log(M500c) = 11.3 − 13.7, extending our knowledge of the scaling relation by more than two orders of magnitude. LX, CGM increases with M500c from (3.0 ± 1.6) × 1039 erg s−1 at log(M500c) = 11.3 to (1.3 ± 0.1) × 1042 erg s−1 at log(M500c) = 13.7. The relation follows a power law of log(LX, CGM) = (1.32 ± 0.05)×log(M500c)+(24.1 ± 0.7). Our observations highlight the necessity of non-gravitational processes at the galaxy group scale while suggesting these processes are sub-dominant at the galaxy scale. We show that the outputs of current cosmological galaxy simulations generally align with the observational results uncovered here but with possibly important deviations in selected mass ranges.
Conclusions. We explore, at the low mass end, the average scaling relations between the CGM X-ray luminosity and the galaxy’s stellar mass or halo mass, which constitutes a new benchmark for galaxy evolution models and feedback processes.
Key words: galaxies: general / galaxies: halos / galaxies: statistics / X-rays: galaxies
Corresponding author; This email address is being protected from spambots. You need JavaScript enabled to view it.
© The Authors 2024
 Open Access article, published by EDP Sciences, under the terms of the Creative Commons Attribution License (https://creativecommons.org/licenses/by/4.0), which permits unrestricted use, distribution, and reproduction in any medium, provided the original work is properly cited.
This article is published in open access under the Subscribe to Open model.
Open Access funding provided by Max Planck Society.
1. Introduction
In the paradigm of hierarchical structure formation driven by gravitation, the primordial density field made of dark matter and baryons undergoes collapse to form virialized objects: halos and galaxies (White & Rees 1978). Galaxies, halos, and their environments co-evolve, and their properties are correlated (Muldrew et al. 2012). For example, Leauthaud et al. (2012a,b) and Coupon et al. (2015) observe a tight relation between the stellar mass (M*) of a galaxy and its host dark matter halo mass (Mhalo). Moreover, galaxies follow a well-known main sequence between star formation rate and stellar mass (Whitaker et al. 2012; Iyer et al. 2018), and show a correlation between their size and stellar mass (Mowla et al. 2019a,b). In this article, we investigate the relation between the total X-ray luminosity of a halo and the stellar or halo mass of the galaxy.
In the local Universe, for the early-type galaxies (ETGs), the relation between LX and M*, dynamical mass (baryon plus dark matter), central optical profile of galaxy, and temperature of gas (TX) within < 50 Mpc has been studied (Kim & Fabbiano 2013, 2015; Goulding et al. 2016; Forbes et al. 2017). The relations measured support the necessity of the active galactic nucleus (AGN) feedback in massive ETGs and demands of stellar feedback in less massive ETGs (Choi et al. 2015). For the late-type galaxies (LTGs), the Chandra survey of nearby (< 30 Mpc) highly inclined disc galaxies finds correlations between LX and SFR, supernova (SN) mechanical energy input rate and TX, which implies a stellar feedback origin of the X-ray emission (Li & Wang 2013; Wang et al. 2016). A weaker correlation between LX and M* is found in disk galaxies, especially star-burst galaxies, compared to ETGs.
To characterize such relations at higher redshift, one needs to resort to stacking techniques to overcome the intrinsic dim X-ray emission of the CGM. By stacking 250 000 galaxies selected from SDSS with the ROSAT ALL-Sky survey data, Anderson et al. (2015) find the LX − M* relation to be steeper than expected from self-similar model predicted above log(M*) > 11.0, implying the existence of non-gravitational heating. For the same galaxy sample, a general correlation between the galaxy stellar mass and the Comptonization Y-parameter is measured by (Planck Collaboration XI 2013). With an improved spatial resolution, the Y-Mass relation is measured at the high mass end (Schaan et al. 2021; Pandey et al. 2022). More recently, Das et al. (2023) extend the relation down to log(M*) > 10.3 by cross-correlating the WISE and SuperCOSmos photometric redshift galaxy sample (Bilicki et al. 2016) with ACT and Planck. They find a steeper Y-Mass relation than the self-similar model predicted.
The extended ROentgen Survey with an Imaging Telescope Array (eROSITA) on board the Spektrum Roentgen Gamma (SRG) orbital observatory provides the new X-ray data for stacking experiments. Recently, with eROSITA and its PV/eFEDS observations covering 140 square degrees, Comparat et al. (2022) stack ∼16 000 central star-forming and quiescent galaxies selected from the GAMA spectroscopic galaxy survey; later, Chadayammuri et al. (2022) stack ∼1600 massive star-forming and quiescent galaxies selected from SDSS in the same eFEDS field. The difference in the sample selection leads to different interpretations of the results (we will discuss in detail in Zhang et al., in prep.).
This work uses the state-of-the-art stacking results obtained in Zhang et al. (2024) (hereafter Paper I). There, we use the first four of the planned eight all-sky surveys (eROSITA all-sky survey, eRASS:4) (Merloni et al. 2012, 2024; Predehl et al. 2021; Sunyaev et al. 2021) and galaxy samples with high completeness (Dey et al. 2019; Zou et al. 2019; Tinker 2021, 2022) to measure the average surface brightness profiles of the CGM, after modeling and subtracting the contaminating X-ray emission from AGN, X-ray Binaries (XRB) and satellite galaxies. In this work, we integrated the X-ray surface brightness profiles in Paper I to calculate the X-ray luminosity. We studied the relations between the X-ray luminosities and galaxies’ stellar or halo masses.
In the literature, the gas within the virial radius is generally called CGM for isolated massive galaxies and is called intragroup medium (IGrM) or intracluster medium (ICM) for more massive systems. However, the separation between them is hard to define physically (and observationally) and is not the goal of this work. For simplicity, we define CGM as the gas within a certain radius (i.e., R500c1) of the central galaxy, regardless of the halo mass.
The eROSITA X-ray data reduction, stacking method, and galaxy samples are detailed in Paper I. This paper is organized as follows. The relevant methods and samples are explained in Sect. 2. The relations between X-ray luminosity and masses of galaxies are presented in Sect. 3. The implication of the observed scaling relations is discussed in Sect. 4. We used Planck Collaboration VI (2020) cosmological parameters: H0 = 67.74 km s−1 Mpc−1 and Ωm = 0.3089. The log in this work designates log10. The stellar mass and halo mass in this work are in units of solar mass (M⊙).
In two additional companion papers also based on the measurements from Paper I, we investigate (i) the trends as a function of specific star formation rate (Zhang et al., in prep.) and (ii) the possible dependence on azimuth angle (Zhang et al., in prep.).
2. Methods
2.1. X-ray luminosity
The total X-ray luminosity LX around a galaxy is calculated by integrating the (background subtracted) surface brightness profiles SX, gal − SX, bg up to a given radius r,
![Mathematical equation: $$ \begin{aligned} L_{\rm X}= \Sigma _{0}^{r} (S_{\rm X,gal}-S_{\rm X,bg})\times A_{\rm shell}\ [\mathrm {erg\,s}^{-1}], \end{aligned} $$](/articles/aa/full_html/2024/10/aa49413-24/aa49413-24-eq1.gif) (1)
(1)
where SX, gal is the observed rest-frame X-ray surface brightness of stacked galaxies, SX, bg is the background X-ray surface brightness, Ashell is the area size of the integrated annulus.
The uncertainty on LX is estimated from the quadratic sum of the Poisson error and uncertainty estimated with Jackknife re-sampling (Paper I; Andrae 2010; McIntosh 2016). The Poisson error is negligible, benefiting from the large galaxy sample. The dominant Jackknife uncertainty reflects the scatter of the mean X-ray luminosities of the stacked galaxy population.
The luminosity is calculated in the energy bin 0.5 − 2 keV (in the rest frame). We integrated the X-ray emission within R500c, and the obtained luminosity is denoted as LX, total. Without masking detected X-ray sources, LX, total is the total X-ray luminosity of all sources within R500c, including the point sources (AGN and XRB) and extended CGM.
We follow the method in Paper I to calculate the CGM luminosity, which we summarize here:
-
We mask detected X-ray point sources, integrate the X-ray emission within R500c, correct for the misclassified centrals, and obtain LX, mask.
-
We estimate the X-ray emission from unresolved AGN and XRB that reside in the stacked galaxies and the satellite galaxies (LX, AGN + XRB + SAT). The XRB luminosity is derived from the stellar mass and SFR of stacked central galaxies according to the empirical model compiled by Aird et al. (2017)2. We estimate the unresolved AGN luminosity in central galaxies by stacking optical-AGN-hosting galaxies. The obtained AGN luminosity agrees well with the empirical AGN model compiled by Comparat et al. (2019). For satellite galaxies, the XRB emission is derived by combining Aird et al. (2017) and the mock SDSS catalog constructed and discussed in Paper I. We neglect the contribution from AGN in satellite galaxies since they have a small occurrence (< 10%) (Comparat et al. 2023).
-
We subtract LX, AGN + XRB + SAT from LX, mask. The residual emission (LX, CGM) comes from the hot CGM within R500c: LX, CGM = LX, mask − LX, AGN + XRB + SAT.
We parametrize the scaling relations between LX, CGM (or LX, total) and masses of galaxies by a single power law:
 (2)
(2)
The single power law has two parameters L0 and the slope α. We use the maximum likelihood method and the Markov chain Monte Carlo (MCMC) chains to estimate the best-fit parameters and their 1σ uncertainties (Paper I, Hogg et al. 2010).
2.2. Galaxy samples
We select galaxies from the SDSS DR7 spectroscopic galaxy catalog (rAB < 17.77) (Strauss et al. 2002). The spectroscopic redshift (zspec) of the galaxy is estimated with an accuracy of Δzspec < 10−4 (Blanton et al. 2005). We limit the maximum redshift of the galaxies, so the sample is approximately volume-limited and complete. The stellar mass of the galaxies is estimated by Chen et al. (2012) and has a typical uncertainty of 0.1 dex. We stack central galaxies only. The central galaxies in SDSS are identified by the halo-based group finder of Tinker (2021). About 1% of the central galaxies are misclassified, and we correct it when measuring LX, mask. For each group, a halo mass (M200m) is inferred and assigned to the central galaxy3 (Alpaslan & Tinker 2020; Tinker 2021, 2022). The Tinker (2022) model reproduces very closely summary statistics of galaxy clustering and galaxy-galaxy lensing (Zehavi et al. 2011; Mandelbaum et al. 2016), meaning that the average halo mass of (large) samples of central galaxies is accurate. The SFR of galaxies is estimated by Brinchmann et al. (2004), which we take to model the XRB emission. In this analysis, we do not separate star-forming and quiescent galaxies. The galaxy sample selection method is detailed in Paper I. The only difference compared to Paper I’s samples is that we split in two the top three stellar and halo mass bins to gain more insight into the scaling relation trend. We build two samples from SDSS DR7:
-
CEN sample. This sample includes 85 222 central galaxies in the stellar mass range 10.0 < log(M*) < 11.5 and spectroscopic redshift 0.01 < zspec < 0.19 (see Table 1).
Table 1.Observed rest-frame X-ray luminosity in the 0.5–2 keV band within R500c in erg s−1 of different components for CEN and isolated samples.
-
CENhalosample. This sample includes 125 512 central galaxies selected in the halo mass range log M200m = 11.5 − 14.0 and spectroscopic redshift 0.01 < zspec < 0.20 (see Table 2).
Table 2.Observed rest-frame X-ray luminosity in the 0.5–2 keV band within R500c in erg s−1 of different components for CENhalo sample.
By having these two samples, the inversion problem of the stellar-to-halo-mass relation (SHMR) is considered from two complementary angles. With the stacks around the CEN and CENhalo samples, we derive the LX, CGM.
The deep (rAB< 23.4) DESI Legacy Survey (LS) DR9 allows us to build another larger galaxy sample extended to lower stellar mass and higher redshift (Dey et al. 2019). The photometric redshift of the galaxy is estimated with an accuracy of Δzphot ≈ 0.01, and the stellar mass is derived with typical uncertainties of 0.2 dex (Zou et al. 2019). Albeit the methods to infer the stellar masses are different for the CEN and isolated samples (Chen et al. 2012; Zou et al. 2019), we find that the stellar masses of the galaxies in common are consistent within their uncertainties. Given the rather large photometric redshift uncertainty, isolated galaxies are selected using angular coordinates only. An isolated galaxy’s halo does not overlap with any other comparable stellar mass galaxies’s halo (see details in Paper I):
-
Isolated sample. This sample includes 213 514 galaxies in the stellar mass range 9.5 < log(M*) < 11.5 and photometric redshift 0.01 < zphot < 0.4 (see Table 1). The galaxies are isolated galaxies living in under-dense environments.
We stack the X-ray around the isolated sample to measure the mean LX, total of galaxies at lower mass and higher redshift than the CEN sample.
2.3. Simulation datasets and computation of the intrinsic X-ray emission
To facilitate the interpretation of our observational results, we utilize publicly available simulated datasets from the three distinguished cosmological hydrodynamical simulations: TNG100 from IllustrisTNG (Marinacci et al. 2018; Naiman et al. 2018; Springel et al. 2018; Pillepich et al. 2018; Nelson et al. 2019b,a), EAGLE (Crain et al. 2015; Schaller et al. 2015; Schaye et al. 2015; McAlpine et al. 2016), and SIMBA (Davé et al. 2019)4. These simulations aim to model galaxy formation and evolution within a ΛCDM universe with consistent cosmological parameters and simulated comoving box (∼100 Mpc per side). The three models, while implementing various astrophysical processes relevant to galaxy formation, differ from each other in terms of modeling feedback from stellar and supermassive black hole activities. These variations on feedback modeling could result in significantly different predictions on the CGM properties (Oppenheimer et al. 2021; Truong et al. 2023; Wright et al. 2024).
We compare the stacking results to simulated galaxies with stellar mass log(M*) > 9.5. The stellar masses of simulated galaxies are measured within twice the half-stellar mass radius. We do not attempt to replicate the selection of the observed galaxy samples, apart from choosing simulated galaxies that are centrals of their host halo. For each simulated galaxy, the X-ray luminosity of the CGM is measured in the 0.5 − 2 keV range and within a radial range of (0.15 − 1) R500c, following the methods detailed in Truong et al. (2021) and Comparat et al. (2022). In short, the X-ray luminosity is derived from the thermodynamic properties of gas particles (non-star-forming) by employing a single-temperature APEC model (Smith et al. 2001). The R500c and M500c are the values obtained directly from the simulations output.
We emphasize that the comparisons between observations and simulations in this work are made at face value, as we do not replicate any of the steps involved in the observational inference of the quantities of the studied scaling relations. The computed X-ray emissions of the CGM are intrinsic and do not account for the observational effects, for example, the selection effects introduced by the measurement of the stellar or halo mass. A complete forward model based on hydro-dynamical simulations of the observational process is left for future studies.
3. Results
This section presents the obtained scaling relations between the X-ray luminosity and M* or M500c. The relationship between LX, total (without masking X-ray sources) and M* of galaxies is presented in Sect. 3.1. The inferred LX, CGM to M* relation compared to the simulations is presented in Sect. 3.2. The relationships between LX, total or LX, CGM and M500c of galaxies with comparison to simulations are presented in Sect. 3.3.
3.1. LX, total − M* relation
Based on the central and isolated galaxies stacking, the LX, total − M* relation is plotted in Fig. 1. Note that LX, total includes the emission from AGN, XRB, and hot gas. LX, total increases from  to
to  , when log10(M*) increases from 9.5 to 11.5 (see Table 1). The increase of log(LX, total) with log(M*) appears non-linear: below log(M*)≈11.0 the increase is slower, above which it gets faster with log(M*). The LX, total − M* relations by stacking the isolated and CEN sample give consistent results, with a difference of less than 1σ. Notice that the isolated and CEN samples have a maximum redshift difference of 0.2, which is about a 2 Gyr age difference. We do not detect redshift evolution of the LX, total − M* relation within the limited redshift range.
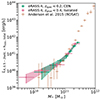 |
Fig. 1. 0.5 − 2 keV X-ray luminosity (LX, total) within R500c of galaxies without masking detected X-ray sources, as a function of stellar mass M*, for central galaxies (green) within zspec = 0.2 and isolated galaxies (pink) within zphot = 0.4. The measurement from Anderson et al. (2015) is plotted in brown. |
In Fig. 1, we also compare our LX, total − M* relation to Anderson et al. (2015, Fig. 5, top panel). They measured the X-ray luminosity of the ‘locally brightest galaxies’ (similar to the CEN sample) using ROSAT. The LX, total − M* relations in the two works agree with a difference less than 1σ, except for the highest three stellar mass bins. The main reason is the different M* estimation, that the stellar mass in Anderson et al. (2015) is about 0.1 dex lower than ours (see the discussions in Taylor et al. 2011 and Chen et al. 2012). The X-ray data and its reduction, and the galaxy selection are also different in the two works. Full forward models of both measurement processes are needed to reconcile the results at high mass. Thanks to eRASS:4, significant progress is made: we narrow down the uncertainties on the relation by a factor of about ten at log(M*) = 10.7. With the isolated sample, we measure for the first time the X-ray luminosity of galaxies with a stellar mass of (3 ∼ 10)×109 M⊙ to be (4.3 ± 2.4) × 1039 erg s−1.
3.2. LX, CGM-M* relation
We present the CGM luminosity LX, CGM and contamination from unresolved sources LX, AGN + XRB + SAT of the CEN sample as a function of M* in Fig. 2. We find that the unresolved AGN and XRB contribute to about 60% of the LX for galaxies with log(M*) = 10.0 − 10.5 and less than 30% for galaxies with log(M*) > 11.0. The hot CGM thus contributes to about 40% of the X-ray luminosity (after masking detected X-ray sources) of the central galaxies at low-mass end and increases to about > 70% at high-mass end. The LX, CGM (purple in Fig. 2, Table 1) increases from (1.6 ± 2.1)×1039 erg s−1 to (3.4 ± 0.3) × 1041 erg s−1, when log(M*) increases from 10.0 to 11.5.
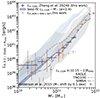 |
Fig. 2. X-ray luminosity vs. stellar mass. The hot CGM X-ray luminosity (LX, CGM) measured around the central galaxies (CEN sample) within R500c in 0.5 − 2 keV as a function of the M* is shown in purple. The purple band displays the best-fit single power law model and its 1σ uncertainty. The modeled X-ray luminosity from unresolved AGN, XRB (LX, AGN + XRB + SAT) is depicted in tan. The LX, CGM − M* measurements from Anderson et al. (2015) are plotted with thin brown crosses, notice the M* is shifted by 0.1 dex to higher mass to account for the difference in M* estimation between Anderson et al. (2015) and this work. The prediction from the EAGLE, TNG100 and SIMBA simulations compiled following the methodology of Truong et al. (2023) are overplotted with 1σ uncertainties. |
We compare our CGM luminosity to stellar mass relation (LX, CGM − M*) to the corresponding ones measured by Anderson et al. (2015, Fig. 5, bottom panel). To remove the AGN emission, Anderson et al. (2015) define LX, CGM as the X-ray emission in (0.15 − 1)×R500. This is different from our direct subtraction of emission coming from unresolved AGN obtained by modeling. Our LX, CGM − M* relation agrees well with Anderson et al. (2015) after shifting their M* by 0.1 dex to higher mass to account for the different M* estimations. Our measurements significantly improved signal-to-noise.
We fit our measurements with a single power-law (Eq. 2). The LX, CGM − M* relation below log(M*) = 11.5 can be described with
 (3)
(3)
We compare the observed LX, CGM − M* relation to the ones predicted by simulations: EAGLE, TNG1000, and SIMBA. The simulations may deviate from the observations at some stellar mass range. Still, given the large scatter, the simulations generally agree with the observations, except for EAGLE (see more discussion in Sect. 4.2).
The baryons follow the gravitational potential well, and the hot CGM luminosity is expected to trace the halo mass (Tumlinson et al. 2011). Thus, by measuring the relation between CGM luminosity and stellar mass, we probe the SHMR in a novel fashion, complementary to probes of SHMR using galaxy clustering and galaxy-galaxy lensing (Leauthaud et al. 2012b; Velander et al. 2014; Coupon et al. 2015). We discuss the implications of our results further in Sect. 4.3.
3.3. LX, total-M500c and LX, CGM-M500c relations
This section presents the stack of the CENhalo sample. The LX, total − M500c relation obtained is plotted in Fig. 3 in green and listed in Table 2. We scale LX, total and LX, CGM by E(z)−2 considering a self-similar redshift evolution5.
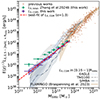 |
Fig. 3. Total X-ray luminosity (LX, total, green) and X-ray luminosity of hot gas (LX, CGM, purple) within R500c in 0.5 − 2 keV as a function of the M500c. The red dashed line is the best-fit single power law to our measurements of the LX, CGM − M500c relation. The brown data points are taken from Eckmiller et al. (2011), Lovisari et al. (2015), Mantz et al. (2016), Schellenberger & Reiprich (2017), Andreon et al. (2017), Adami et al. (2018), Bulbul et al. (2019), Lovisari et al. (2020), Liu et al. (2022), Popesso et al. (2024) (Notice the presence of selection effects and Malmquist bias in these observations). The LX, CGM − M500c relations predicted by simulations EAGLE, TNG100, SIMBA and FLAMINGO with 1σ uncertainties are overplotted (Braspenning et al. 2023). |
The LX, total − M500c relation is measured down to log(M500) = 11.3. The LX, total increases from (1.2 ± 0.5) × 1040 erg s−1 at log(M500c) = 11.3 to (1.6 ± 0.2) × 1042 erg s−1 at log(M500c) = 13.7. The log LX, total − log M500c relation is quasi-linear and can be described with
 (4)
(4)
The X-ray luminosity of the hot CGM within R500c (LX, CGM) as a function of M500c is also plotted in Fig. 3 (purple data points) and listed in Table 2. We find that LX, CGM increases with M500c from (3.0 ± 1.6)×1039 erg s−1 at log(M500c) = 11.3 to (1.3 ± 0.1)×1042 erg s−1 at log(M500c) = 13.7. We fit the LX, CGM − M500c relation with Eq. (2), and get
 (5)
(5)
The LX, CGM − M500c relation has been extensively studied at the high-mass end (log(M500c) > 14.0) (Eckmiller et al. 2011; Lovisari et al. 2015, 2020; Mantz et al. 2016; Schellenberger & Reiprich 2017; Andreon et al. 2017; Adami et al. 2018; Bulbul et al. 2019; Chiu et al. 2022). By stacking the galaxy groups from the GAMA survey, the X-ray emission is detected down to log(M500c) = 13.5 (Popesso et al. 2024). These previous works are compared to our result in Fig. 3. Our measurement extends the LX, CGM − M500c relation down to lower mass structure and narrows down the uncertainty by a factor of > 10 for log(M500c) < 13.5 structures. Due to the selection effects that only X-ray-detectable galaxy groups and galaxy clusters are measured in the previous works (except Popesso et al. 2024), the previously measured LX, CGM appears brighter than our stacking analysis at log(M500c) = 13.0 − 13.7.
With consideration of the selection function of galaxy clusters and uncertainty on the M500c, the slope of LX, CGM − M500c ranges between 1.4 − 2.0 (Lovisari et al. 2020; Chiu et al. 2022). Our observed LX, CGM − M500c relation at log(M500c) < 14.0 has a shallower slope than the literature measurements at log(M500c) > 14.0. Though the same hot medium within R500c is measured, the methodologies differ between ours and the literature. In the literature, the luminosity is derived from spectra fitting and the X-ray profile for each galaxy cluster selected in the X-ray or millimeter wavelength bands (Eckmiller et al. 2011; Bulbul et al. 2019). We measure an average luminosity for a complete central galaxy sample. Further investigation is necessary to figure out the difference caused by the methodology. The shallower slope could be related to the influence of feedback processes, which might be different at low-mass and high-mass (see more discussion in Sect. 4.1). We discuss the comparison with simulations in Sect. 4.2.
4. Discussion
4.1. Comparing LX, CGM − M500c to self-similar model
Under the assumption that the gas is gravitationally heated only, and the systems (galaxies, galaxy groups, galaxy clusters) reached equilibrium and are isothermal, the properties of the hot gas scale with the dark matter halo mass following the self-similar model (Kaiser 1986; Kravtsov & Borgani 2012; Lovisari et al. 2021). The deviation of observed relations from the self-similar model implies that extra non-gravitational mechanisms affect the gas’s heating, cooling, or ejection.
Following Lovisari et al. (2021), to make the comparison to the scaling relations predicted from the self-similar model easier, in this section, we name the systems with log(M500c) > 13.4 as galaxy clusters, log(M500c) = 12.8 − 13.4 as galaxy groups, log(M500c) < 12.8 as galaxies. The self-similar relation of LX, CGM − M500c of galaxy clusters has an index of about 0.78 (solar metallicity gas, Z = Z⊙) to 0.94 (Z = 0.3 Z⊙) (Lovisari et al. 2021). The observed slope of the LX, gas − M500c relation above log(M500c) = 14.0 ranges between 1.4 − 2.0, steeper than self-similar prediction (Lovisari et al. 2020; Chiu et al. 2022). This has given rise to a widespread discussion of AGN feedback models and their role in heating/modifying the ICM (e.g., Fabian 2012; Le Brun et al. 2014; Eckert et al. 2021; Oppenheimer et al. 2021; Pop et al. 2022; Schaye et al. 2023).
For lower-mass systems, the self-similar relation of LX, gas − M500c is expected to change due to the complexity of the emissivity of the hot plasma as a function of temperature and metallicity in the 0.5–2 keV band (Lovisari et al. 2021). For galaxy groups, the index ranges from 0 (Z = Z⊙) to 0.6 (Z = 0.3 Z⊙). However, our observed LX, gas − M500c has an index of ≈1.32, which is much steeper. It strengthens further the need for non-gravitational processes, probably linked to AGN feedback, to explain the properties of the hot CGM at the galaxy group scale (Eckert et al. 2021; Bahar et al. 2024).
For galaxies, the self-similar model index ranges from 1.5 (Z = Z⊙) to 1.6 (Z = 0.3 Z⊙) (Lovisari et al. 2021). Here, we obtain an index of ≈1.33, which is about 11–17% shallower than the self-similar prediction. The two indexes’ closeness might imply that these systems’ non-gravitational processes (for example, AGN and stellar feedback) are sub-dominant. Consistently, the hot CGM around galaxies with log(M200m) > 11.5 and redshift z < 0.5 will reach equilibrium and virialization (Stern et al. 2021; Faucher-Giguère & Oh 2023). In the future, we expect that X-ray spectral fitting will constitute a valuable source of information to gain insights into the physical processes behind this observed luminosity, for example, line cooling, Bremsstrahlung, and metallicity.
4.2. Comparison to cosmological galaxy simulations
The discussion in Sect. 4.1 emphasizes that the observed scaling relations contain information about feedback processes. In Fig. 2 and Fig. 3, we compare the observed LX, CGM − M* and LX, CGM − M500c relations to the EAGLE, TNG100, and SIMBA simulations (as compiled by Truong et al. 2023). In Fig. 3, we also compare to the output of the FLAMINGO (Braspenning et al. 2023) simulation for halo masses above the group-mass scale.
For the LX, CGM − M* relation (Fig. 2), the three simulations EAGLE, TNG100, and SIMBA show considerable model-to-model variation across the considered stellar mass range, in addition to approximately a 1-dex galaxy-to-galaxy variation across most of the mass range. Among the three simulations, SIMBA predicts the lowest X-ray emissions due to a smaller amount of hot gas contained in the CGM than the other two simulations (Truong et al. 2023). Both SIMBA and TNG mean CGM X-ray luminosities are within 1 dex of the observation, whereas for EAGLE only at galaxy stellar masses log(M*) = 10.0 − 11.0. For galaxies with stellar masses above log(M*) = 11.0, EAGLE significantly overpredicts the CGM emissions compared to the observed results. This discrepancy suggests that the AGN feedback model implemented in EAGLE may be less efficient at removing gas from massive haloes (Davies et al. 2019).
The LX, CGM − M500c (Fig. 3) relations predicted by the simulations agree with the observations within 1σ down to log(M500c) = 12.0, with a slight deviation from SIMBA at lower mass. All simulation predictions seem generally steeper than the observation, though within scatter. According to this comparison, and differently from Fig. 2, EAGLE does not overpredict the LX, CGM over 1-dex, but SIMBA appears to underpredict the CGM luminosity at fixed halo mass. It is important to note that the M500c − M* relationships in the simulations are not exactly the same as the one adopted in Tinker (2021) (Mandelbaum et al. 2016; Wright et al. 2024). This complicates the interpretation of the possible discrepancies between simulation predictions and observational data, as differences in the LX − M500c relationship could arise from both the underlying feedback physics and the methodologies used to estimate M500c and stellar mass.
More detailed comparisons are required to draw quantitative and decisive conclusions on the nature of the feedback, the gas enrichment process, and the heating mechanism in current cosmological simulations of galaxies. In this work, we do not create a dedicated mock catalog mimicking possible selection effects, which could improve the accuracy of the comparison. If a hydro-dynamical simulation reproduces both relations between halo mass, stellar mass and the CGM or the total (adding AGN and XRB) luminosity, it would constitute good evidence for the feedback mechanisms to be accurate. This, however, also requires accurate prediction of the X-ray emission from AGN and XRB (e.g., Biffi et al. 2018; Vladutescu-Zopp et al. 2023; Kyritsis et al. 2024.
4.3. The connection between LX, CGM − M* and LX, CGM − M500c relations
The SHMR of the central galaxies selected by Tinker (2021) is well represented by the broken power law
![Mathematical equation: $$ \begin{aligned} M_*= 0.07 M_{\rm 200m} \left[\left( \frac{M_{\rm 200m}}{1.3\times 10^{12}}\right)^{-0.6}+\left(\frac{M_{\rm 200m}}{1.3\times 10^{12}}\right)^{0.7}\right]^{-1}, \end{aligned} $$](/articles/aa/full_html/2024/10/aa49413-24/aa49413-24-eq8.gif) (6)
(6)
with a scatter of about 0.15 dex. We then convolve the SHMR to LX, CGM − M500c to predict the relation between LX, CGM and M*. In Fig. 4, we show both the observed and predicted (from SHMR and LX, CGM − M500c) LX, CGM − M* relations. The agreement of the two indeed demonstrates that the measured hot X-ray (CGM) luminosity is a good tracer of the gravitation potential of the halos. This brings the possibility of a new method to measure the SHMR relation by jointly fitting the relations LX, CGM − M* and LX, CGM − M500c.
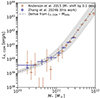 |
Fig. 4. Observed X-ray luminosity of CGM as a function to M* (purple, brown points), compared to the relation derived by convolving the observed LX, CGM − M500c relation with the stellar-to-halo-mass relation (gray band). The LX, CGM − M* measurements from Anderson et al. (2015) is shifted by 0.1 dex to higher mass to account for the difference in M* estimation between Anderson et al. (2015) and this work. |
5. Summary and conclusions
In this work, we provide an updated and extended quantification of the scaling relations between the X-ray emission from the hot circumgalactic medium (CGM) and two main galaxy properties, stellar and halo mass. These scaling relations can be used to constrain galaxy evolution models.
By following up on the analysis presented in Paper I (Zhang et al. 2024), we extracted the integrated total luminosities within a fixed aperture of R500c directly measured by stacking eRASS:4 X-ray photons around galaxies in well-defined, highly complete samples built from the SDSS and LS DR9 galaxy catalogs that contain 85 222 central galaxies split into stellar mass bins, 125 512 central galaxies split in halo mass bins, and 213 514 isolated galaxies. We report the following three findings, which significantly extend our understanding of the hot CGM around galaxies and constitute a new benchmark to constrain galaxy formation and evolution models:
-
The scaling relation between the X-ray luminosity LX, total (total X-ray emission within R500c) and the stellar mass of galaxies (LX, total − M*) is measured for galaxies with log(M*) > 9.5 thanks to the large photometric isolated galaxy sample (Fig. 1).
-
The scaling relation between the X-ray luminosity of the hot CGM and the stellar mass (LX, CGM − M*) is measured for central galaxies with log(M*) > 10.0 (Fig. 2). A single power law with indice of 2.4 ± 0.1 describes the LX, CGM − M* relation (Eq. (3)).
-
The scaling relations between total X-ray luminosity and halo mass of galaxies (LX, total − M500c); X-ray luminosity of hot CGM and halo mass (LX, CGM − M500c) are measured down to M500c = 11.3 (Fig. 3). In this mass range, the LX, CGM − M500c relation can be described by a single power law with index 1.32 ± 0.05 (Eq. (5)).
By comparing the measured LX, CGM − M500c scaling relation to the self-similar model, we demonstrated the necessity of non-gravitational processes at the galaxy group scale, while these processes appear sub-dominant at the galaxy scale. Additionally, comparisons with the IllustrisTNG, EAGLE, and SIMBA simulations reveal that current cosmological galaxy simulations broadly agree with our observational results, although significant deviations are evident in specific mass ranges.
In the future, with deeper spectroscopic galaxy surveys DESI BGS and 4MOST (Zarrouk et al. 2022; Hahn et al. 2023; de Jong et al. 2019; Finoguenov et al. 2019), we will enlarge the spectroscopic galaxy sample to cover wider areas (3–4 times that used here) and extend further in redshift (up to z < 0.4). We expect an apparent increase in signal-to-noise and to obtain a detailed view of the hot CGM and possible relation to intermediate-mass black holes in and around dwarf galaxies (log(M*) < 10) (Arcodia et al. 2024).
R500c is the radius where the density is 500 times the critical density of the local universe. The halo mass within R500c is denoted as M500c.
We verified that using the Lehmer et al. (2019) XRB model (instead of Aird et al. 2017) does not affect the LX, CGM obtained.
The halo mass provided in the catalog Tinker (2021) is M200m, the mass within the radius where the mean interior density is 200 times the background universe matter density. To ease the comparison to literature, we convert the M200m to M500c with the mass-concentration relation model from Ishiyama et al. (2021).
We note that here we use versions of EAGLE and SIMBA that are reprocessed to share the same data format with TNG simulation (Nelson et al. 2019b). The reprocessing ensures that simulated structures, for example, galaxies and their host halos, as well as their properties, are identified in the same manner among the three simulations. This also allows the usage of identical analysis methods.
The E(z) is imported to account for the redshift evolution of quantities related to the overdensity (i.e., R500c).The self-similar redshift evolution of E(z)−2 works for the massive clusters, where the X-ray emission from the bremsstrahlung process dominates. For lower mass structures where the line emission dominates, E(z)−5/3 is usually taken (Lovisari & Maughan 2022). Considering the CENhalo sample is below z = 0.2 (E(z)≈1.0 − 1.1) and to keep consistency with clusters studies, we adopt a E(z)−2 scaling throughout.
Acknowledgments
We thank the anonymous referee for thoughtful comments that improved the manuscript. This project acknowledges financial support from the European Research Council (ERC) under the European Union’s Horizon 2020 research and innovation program HotMilk (grant agreement No. 865637). GP acknowledges support from Bando per il Finanziamento della Ricerca Fondamentale 2022 dell’Istituto Nazionale di Astrofisica (INAF): GO Large program and from the Framework per l’Attrazione e il Rafforzamento delle Eccellenze (FARE) per la ricerca in Italia (R20L5S39T9). NT acknowledges support from NASA under award number 80GSFC21M0002. PP has received funding from the European Research Council (ERC) under the European Union’s Horizon Europe research and innovation program ERC CoG (Grant agreement No. 101045437). This work is based on data from eROSITA, the soft X-ray instrument aboard SRG, a joint Russian-German science mission supported by the Russian Space Agency (Roskosmos), in the interests of the Russian Academy of Sciences represented by its Space Research Institute (IKI), and the Deutsches Zentrum für Luft- und Raumfahrt (DLR). The SRG spacecraft was built by Lavochkin Association (NPOL) and its subcontractors, and is operated by NPOL with support from the Max Planck Institute for Extraterrestrial Physics (MPE). The development and construction of the eROSITA X-ray instrument was led by MPE, with contributions from the Dr. Karl Remeis Observatory Bamberg & ECAP (FAU Erlangen-Nuernberg), the University of Hamburg Observatory, the Leibniz Institute for Astrophysics Potsdam (AIP), and the Institute for Astronomy and Astrophysics of the University of Tübingen, with the support of DLR and the Max Planck Society. The Argelander Institute for Astronomy of the University of Bonn and the Ludwig Maximilians Universität Munich also participated in the science preparation for eROSITA. The eROSITA data shown here were processed using the eSASS/NRTA software system developed by the German eROSITA consortium. Funding for the SDSS and SDSS-II has been provided by the Alfred P. Sloan Foundation, the Participating Institutions, the National Science Foundation, the U.S. Department of Energy, the National Aeronautics and Space Administration, the Japanese Monbukagakusho, the Max Planck Society, and the Higher Education Funding Council for England. The SDSS Web Site is http://www.sdss.org/. The SDSS is managed by the Astrophysical Research Consortium for the Participating Institutions. The Participating Institutions are the American Museum of Natural History, Astrophysical Institute Potsdam, University of Basel, University of Cambridge, Case Western Reserve University, University of Chicago, Drexel University, Fermilab, the Institute for Advanced Study, the Japan Participation Group, Johns Hopkins University, the Joint Institute for Nuclear Astrophysics, the Kavli Institute for Particle Astrophysics and Cosmology, the Korean Scientist Group, the Chinese Academy of Sciences (LAMOST), Los Alamos National Laboratory, the Max-Planck-Institute for Astronomy (MPIA), the Max-Planck-Institute for Astrophysics (MPA), New Mexico State University, Ohio State University, University of Pittsburgh, University of Portsmouth, Princeton University, the United States Naval Observatory, and the University of Washington. The DESI Legacy Imaging Surveys consist of three individual and complementary projects: the Dark Energy Camera Legacy Survey (DECaLS), the Beijing-Arizona Sky Survey (BASS), and the Mayall z-band Legacy Survey (MzLS). DECaLS, BASS and MzLS together include data obtained, respectively, at the Blanco telescope, Cerro Tololo Inter-American Observatory, NSF’s NOIRLab; the Bok telescope, Steward Observatory, University of Arizona; and the Mayall telescope, Kitt Peak National Observatory, NOIRLab. NOIRLab is operated by the Association of Universities for Research in Astronomy (AURA) under a cooperative agreement with the National Science Foundation. Pipeline processing and analyses of the data were supported by NOIRLab and the Lawrence Berkeley National Laboratory (LBNL). Legacy Surveys also uses data products from the Near-Earth Object Wide-field Infrared Survey Explorer (NEOWISE), a project of the Jet Propulsion Laboratory/California Institute of Technology, funded by the National Aeronautics and Space Administration. Legacy Surveys was supported by: the Director, Office of Science, Office of High Energy Physics of the U.S. Department of Energy; the National Energy Research Scientific Computing Center, a DOE Office of Science User Facility; the U.S. National Science Foundation, Division of Astronomical Sciences; the National Astronomical Observatories of China, the Chinese Academy of Sciences and the Chinese National Natural Science Foundation. LBNL is managed by the Regents of the University of California under contract to the U.S. Department of Energy. The complete acknowledgments can be found at https://www.legacysurvey.org/acknowledgment/. The Siena Galaxy Atlas was made possible by funding support from the U.S. Department of Energy, Office of Science, Office of High Energy Physics under Award Number DE-SC0020086 and from the National Science Foundation under grant AST-1616414.
References
- Adami, C., Giles, P., Koulouridis, E., et al. 2018, A&A, 620, A5 [NASA ADS] [CrossRef] [EDP Sciences] [Google Scholar]
- Aird, J., Coil, A. L., & Georgakakis, A. 2017, MNRAS, 465, 3390 [NASA ADS] [CrossRef] [Google Scholar]
- Alpaslan, M., & Tinker, J. L. 2020, MNRAS, 496, 5463 [NASA ADS] [CrossRef] [Google Scholar]
- Anderson, M. E., Gaspari, M., White, S. D. M., Wang, W., & Dai, X. 2015, MNRAS, 449, 3806 [NASA ADS] [CrossRef] [Google Scholar]
- Andrae, R. 2010, ArXiv e-prints [arXiv: 1009.2755] [Google Scholar]
- Andreon, S., Wang, J., Trinchieri, G., Moretti, A., & Serra, A. L. 2017, A&A, 606, A24 [NASA ADS] [CrossRef] [EDP Sciences] [Google Scholar]
- Arcodia, R., Merloni, A., Comparat, J., et al. 2024, A&A, 681, A97 [NASA ADS] [CrossRef] [EDP Sciences] [Google Scholar]
- Bahar, Y. E., Bulbul, E., Ghirardini, V., et al. 2024, A&A, in press, https://doi.org/10.1051/0004-6361/202349399 [Google Scholar]
- Biffi, V., Dolag, K., & Merloni, A. 2018, MNRAS, 481, 2213 [Google Scholar]
- Bilicki, M., Peacock, J. A., Jarrett, T. H., et al. 2016, ApJS, 225, 5 [Google Scholar]
- Blanton, M. R., Schlegel, D. J., Strauss, M. A., et al. 2005, AJ, 129, 2562 [NASA ADS] [CrossRef] [Google Scholar]
- Braspenning, J., Schaye, J., Schaller, M., et al. 2023, MNRAS, accepted [arXiv:2312.08277] [Google Scholar]
- Brinchmann, J., Charlot, S., White, S. D. M., et al. 2004, MNRAS, 351, 1151 [Google Scholar]
- Bulbul, E., Chiu, I. N., Mohr, J. J., et al. 2019, ApJ, 871, 50 [Google Scholar]
- Chadayammuri, U., Bogdán, Á., Oppenheimer, B. D., et al. 2022, ApJ, 936, L15 [NASA ADS] [CrossRef] [Google Scholar]
- Chen, Y.-M., Kauffmann, G., Tremonti, C. A., et al. 2012, MNRAS, 421, 314 [NASA ADS] [Google Scholar]
- Chiu, I. N., Ghirardini, V., Liu, A., et al. 2022, A&A, 661, A11 [NASA ADS] [CrossRef] [EDP Sciences] [Google Scholar]
- Choi, E., Ostriker, J. P., Naab, T., Oser, L., & Moster, B. P. 2015, MNRAS, 449, 4105 [CrossRef] [Google Scholar]
- Comparat, J., Merloni, A., Salvato, M., et al. 2019, MNRAS, 487, 2005 [Google Scholar]
- Comparat, J., Truong, N., Merloni, A., et al. 2022, A&A, 666, A156 [NASA ADS] [CrossRef] [EDP Sciences] [Google Scholar]
- Comparat, J., Luo, W., Merloni, A., et al. 2023, A&A, 673, A122 [NASA ADS] [CrossRef] [EDP Sciences] [Google Scholar]
- Coupon, J., Arnouts, S., van Waerbeke, L., et al. 2015, MNRAS, 449, 1352 [NASA ADS] [CrossRef] [Google Scholar]
- Crain, R. A., Schaye, J., Bower, R. G., et al. 2015, MNRAS, 450, 1937 [NASA ADS] [CrossRef] [Google Scholar]
- Das, S., Chiang, Y.-K., & Mathur, S. 2023, ApJ, 951, 125 [NASA ADS] [CrossRef] [Google Scholar]
- Davé, R., Anglés-Alcázar, D., Narayanan, D., et al. 2019, MNRAS, 486, 2827 [Google Scholar]
- Davies, J. J., Crain, R. A., McCarthy, I. G., et al. 2019, MNRAS, 485, 3783 [NASA ADS] [CrossRef] [Google Scholar]
- de Jong, R. S., Agertz, O., Berbel, A. A., et al. 2019, The Messenger, 175, 3 [NASA ADS] [Google Scholar]
- Dey, A., Schlegel, D. J., Lang, D., et al. 2019, AJ, 157, 168 [Google Scholar]
- Eckert, D., Gaspari, M., Gastaldello, F., Le Brun, A. M. C., & O’Sullivan, E. 2021, Universe, 7, 142 [NASA ADS] [CrossRef] [Google Scholar]
- Eckmiller, H. J., Hudson, D. S., & Reiprich, T. H. 2011, A&A, 535, A105 [NASA ADS] [CrossRef] [EDP Sciences] [Google Scholar]
- Fabian, A. C. 2012, ARA&A, 50, 455 [Google Scholar]
- Faucher-Giguère, C.-A., & Oh, S. P. 2023, ARA&A, 61, 131 [CrossRef] [Google Scholar]
- Finoguenov, A., Merloni, A., Comparat, J., et al. 2019, The Messenger, 175, 39 [NASA ADS] [Google Scholar]
- Forbes, D. A., Alabi, A., Romanowsky, A. J., et al. 2017, MNRAS, 464, L26 [NASA ADS] [CrossRef] [Google Scholar]
- Goulding, A. D., Greene, J. E., Ma, C.-P., et al. 2016, ApJ, 826, 167 [Google Scholar]
- Hahn, C., Wilson, M. J., Ruiz-Macias, O., et al. 2023, AJ, 165, 253 [CrossRef] [Google Scholar]
- Hogg, D. W., Bovy, J., & Lang, D. 2010, ArXiv e-prints [arXiv:1008.4686] [Google Scholar]
- Ishiyama, T., Prada, F., Klypin, A. A., et al. 2021, MNRAS, 506, 4210 [NASA ADS] [CrossRef] [Google Scholar]
- Iyer, K., Gawiser, E., Davé, R., et al. 2018, ApJ, 866, 120 [Google Scholar]
- Kaiser, N. 1986, MNRAS, 222, 323 [Google Scholar]
- Kim, D.-W., & Fabbiano, G. 2013, ApJ, 776, 116 [NASA ADS] [CrossRef] [Google Scholar]
- Kim, D.-W., & Fabbiano, G. 2015, ApJ, 812, 127 [NASA ADS] [CrossRef] [Google Scholar]
- Kravtsov, A. V., & Borgani, S. 2012, ARA&A, 50, 353 [Google Scholar]
- Kyritsis, E., Zezas, A., Haberl, F., et al. 2024, A&A, submitted [arXiv:2402.12367] [Google Scholar]
- Le Brun, A. M. C., McCarthy, I. G., Schaye, J., & Ponman, T. J. 2014, MNRAS, 441, 1270 [NASA ADS] [CrossRef] [Google Scholar]
- Leauthaud, A., George, M. R., Behroozi, P. S., et al. 2012a, ApJ, 746, 95 [Google Scholar]
- Leauthaud, A., Tinker, J., Bundy, K., et al. 2012b, ApJ, 744, 159 [Google Scholar]
- Lehmer, B. D., Eufrasio, R. T., Tzanavaris, P., et al. 2019, ApJS, 243, 3 [NASA ADS] [CrossRef] [Google Scholar]
- Li, J.-T., & Wang, Q. D. 2013, MNRAS, 435, 3071 [NASA ADS] [CrossRef] [Google Scholar]
- Liu, A., Bulbul, E., Ghirardini, V., et al. 2022, A&A, 661, A2 [NASA ADS] [CrossRef] [EDP Sciences] [Google Scholar]
- Lovisari, L., & Maughan, B. J. 2022, Handbook of X-ray and Gamma-ray Astrophysics, 65 [Google Scholar]
- Lovisari, L., Reiprich, T. H., & Schellenberger, G. 2015, A&A, 573, A118 [NASA ADS] [CrossRef] [EDP Sciences] [Google Scholar]
- Lovisari, L., Schellenberger, G., Sereno, M., et al. 2020, ApJ, 892, 102 [Google Scholar]
- Lovisari, L., Ettori, S., Gaspari, M., & Giles, P. A. 2021, Universe, 7, 139 [NASA ADS] [CrossRef] [Google Scholar]
- Mandelbaum, R., Wang, W., Zu, Y., et al. 2016, MNRAS, 457, 3200 [Google Scholar]
- Mantz, A. B., Allen, S. W., Morris, R. G., & Schmidt, R. W. 2016, MNRAS, 456, 4020 [NASA ADS] [CrossRef] [Google Scholar]
- Marinacci, F., Vogelsberger, M., Pakmor, R., et al. 2018, MNRAS, 480, 5113 [NASA ADS] [Google Scholar]
- McAlpine, S., Helly, J. C., Schaller, M., et al. 2016, Astron. Comput., 15, 72 [NASA ADS] [CrossRef] [Google Scholar]
- McIntosh, A. 2016, ArXiv e-prints [arXiv:1606.00497] [Google Scholar]
- Merloni, A., Predehl, P., Becker, W., et al. 2012, ArXiv e-prints [arXiv:1209.3114] [Google Scholar]
- Merloni, A., Lamer, G., Liu, T., et al. 2024, A&A, 682, A78 [NASA ADS] [CrossRef] [EDP Sciences] [Google Scholar]
- Mowla, L., van der Wel, A., van Dokkum, P., & Miller, T. B. 2019a, ApJ, 872, L13 [NASA ADS] [CrossRef] [Google Scholar]
- Mowla, L. A., van Dokkum, P., Brammer, G. B., et al. 2019b, ApJ, 880, 57 [NASA ADS] [CrossRef] [Google Scholar]
- Muldrew, S. I., Croton, D. J., Skibba, R. A., et al. 2012, MNRAS, 419, 2670 [NASA ADS] [CrossRef] [Google Scholar]
- Naiman, J. P., Pillepich, A., Springel, V., et al. 2018, MNRAS, 477, 1206 [Google Scholar]
- Nelson, D., Pillepich, A., Springel, V., et al. 2019a, MNRAS, 490, 3234 [Google Scholar]
- Nelson, D., Springel, V., Pillepich, A., et al. 2019b, Comput. Astrophys. Cosmol., 6, 2 [Google Scholar]
- Oppenheimer, B. D., Babul, A., Bahé, Y., Butsky, I. S., & McCarthy, I. G. 2021, Universe, 7, 209 [NASA ADS] [CrossRef] [Google Scholar]
- Pandey, S., Gatti, M., Baxter, E., et al. 2022, Phys. Rev. D, 105, 123526 [NASA ADS] [CrossRef] [Google Scholar]
- Pillepich, A., Nelson, D., Hernquist, L., et al. 2018, MNRAS, 475, 648 [Google Scholar]
- Planck Collaboration XI. 2013, A&A, 557, A52 [NASA ADS] [CrossRef] [EDP Sciences] [Google Scholar]
- Planck Collaboration VI. 2020, A&A, 641, A6 [NASA ADS] [CrossRef] [EDP Sciences] [Google Scholar]
- Pop, A.-R., Hernquist, L., Nagai, D., et al. 2022, MNRAS, submitted [arXiv:2205.11528] [Google Scholar]
- Popesso, P., Biviano, A., Bulbul, E., et al. 2024, MNRAS, 527, 895 [Google Scholar]
- Predehl, P., Andritschke, R., Arefiev, V., et al. 2021, A&A, 647, A1 [EDP Sciences] [Google Scholar]
- Schaan, E., Ferraro, S., Amodeo, S., et al. 2021, Phys. Rev. D, 103, 063513D [NASA ADS] [CrossRef] [Google Scholar]
- Schaller, M., Dalla Vecchia, C., Schaye, J., et al. 2015, MNRAS, 454, 2277 [NASA ADS] [CrossRef] [Google Scholar]
- Schaye, J., Crain, R. A., Bower, R. G., et al. 2015, MNRAS, 446, 521 [Google Scholar]
- Schaye, J., Kugel, R., Schaller, M., et al. 2023, MNRAS, 526, 4978 [NASA ADS] [CrossRef] [Google Scholar]
- Schellenberger, G., & Reiprich, T. H. 2017, MNRAS, 469, 3738 [CrossRef] [Google Scholar]
- Smith, R. K., Brickhouse, N. S., Liedahl, D. A., & Raymond, J. C. 2001, ApJ, 556, L91 [Google Scholar]
- Springel, V., Pakmor, R., Pillepich, A., et al. 2018, MNRAS, 475, 676 [Google Scholar]
- Stern, J., Faucher-Giguère, C.-A., Fielding, D., et al. 2021, ApJ, 911, 88 [NASA ADS] [CrossRef] [Google Scholar]
- Strauss, M. A., Weinberg, D. H., Lupton, R. H., et al. 2002, AJ, 124, 1810 [Google Scholar]
- Sunyaev, R., Arefiev, V., Babyshkin, V., et al. 2021, A&A, 656, A132 [NASA ADS] [CrossRef] [EDP Sciences] [Google Scholar]
- Taylor, E. N., Hopkins, A. M., Baldry, I. K., et al. 2011, MNRAS, 418, 1587 [Google Scholar]
- Tinker, J. L. 2021, ApJ, 923, 154 [NASA ADS] [CrossRef] [Google Scholar]
- Tinker, J. L. 2022, AJ, 163, 126 [NASA ADS] [CrossRef] [Google Scholar]
- Truong, N., Pillepich, A., Nelson, D., Werner, N., & Hernquist, L. 2021, MNRAS, 508, 1563 [NASA ADS] [CrossRef] [Google Scholar]
- Truong, N., Pillepich, A., Nelson, D., et al. 2023, MNRAS, 525, 1976 [NASA ADS] [CrossRef] [Google Scholar]
- Tumlinson, J., Thom, C., Werk, J. K., et al. 2011, Science, 334, 948 [CrossRef] [Google Scholar]
- Velander, M., van Uitert, E., Hoekstra, H., et al. 2014, MNRAS, 437, 2111 [Google Scholar]
- Vladutescu-Zopp, S., Biffi, V., & Dolag, K. 2023, A&A, 669, A34 [NASA ADS] [CrossRef] [EDP Sciences] [Google Scholar]
- Wang, Q. D., Li, J., Jiang, X., & Fang, T. 2016, MNRAS, 457, 1385 [CrossRef] [Google Scholar]
- Whitaker, K. E., van Dokkum, P. G., Brammer, G., & Franx, M. 2012, ApJ, 754, L29 [Google Scholar]
- White, S. D. M., & Rees, M. J. 1978, MNRAS, 183, 341 [Google Scholar]
- Wright, R. J., Somerville, R. S., Lagos, C. d. P., et al. 2024, MNRAS, 532, 3417 [NASA ADS] [CrossRef] [Google Scholar]
- Zarrouk, P., Ruiz-Macias, O., Cole, S., et al. 2022, MNRAS, 509, 1478 [Google Scholar]
- Zehavi, I., Zheng, Z., Weinberg, D. H., et al. 2011, ApJ, 736, 59 [NASA ADS] [CrossRef] [Google Scholar]
- Zhang, Y., Comparat, J., Ponti, G., et al. 2024, A&A, accepted [arXiv:2401.17308] [Google Scholar]
- Zou, H., Gao, J., Zhou, X., & Kong, X. 2019, ApJS, 242, 8 [Google Scholar]
All Tables
Observed rest-frame X-ray luminosity in the 0.5–2 keV band within R500c in erg s−1 of different components for CEN and isolated samples.
Observed rest-frame X-ray luminosity in the 0.5–2 keV band within R500c in erg s−1 of different components for CENhalo sample.
All Figures
|
Fig. 1. 0.5 − 2 keV X-ray luminosity (LX, total) within R500c of galaxies without masking detected X-ray sources, as a function of stellar mass M*, for central galaxies (green) within zspec = 0.2 and isolated galaxies (pink) within zphot = 0.4. The measurement from Anderson et al. (2015) is plotted in brown. |
| In the text | |
|
Fig. 2. X-ray luminosity vs. stellar mass. The hot CGM X-ray luminosity (LX, CGM) measured around the central galaxies (CEN sample) within R500c in 0.5 − 2 keV as a function of the M* is shown in purple. The purple band displays the best-fit single power law model and its 1σ uncertainty. The modeled X-ray luminosity from unresolved AGN, XRB (LX, AGN + XRB + SAT) is depicted in tan. The LX, CGM − M* measurements from Anderson et al. (2015) are plotted with thin brown crosses, notice the M* is shifted by 0.1 dex to higher mass to account for the difference in M* estimation between Anderson et al. (2015) and this work. The prediction from the EAGLE, TNG100 and SIMBA simulations compiled following the methodology of Truong et al. (2023) are overplotted with 1σ uncertainties. |
| In the text | |
|
Fig. 3. Total X-ray luminosity (LX, total, green) and X-ray luminosity of hot gas (LX, CGM, purple) within R500c in 0.5 − 2 keV as a function of the M500c. The red dashed line is the best-fit single power law to our measurements of the LX, CGM − M500c relation. The brown data points are taken from Eckmiller et al. (2011), Lovisari et al. (2015), Mantz et al. (2016), Schellenberger & Reiprich (2017), Andreon et al. (2017), Adami et al. (2018), Bulbul et al. (2019), Lovisari et al. (2020), Liu et al. (2022), Popesso et al. (2024) (Notice the presence of selection effects and Malmquist bias in these observations). The LX, CGM − M500c relations predicted by simulations EAGLE, TNG100, SIMBA and FLAMINGO with 1σ uncertainties are overplotted (Braspenning et al. 2023). |
| In the text | |
|
Fig. 4. Observed X-ray luminosity of CGM as a function to M* (purple, brown points), compared to the relation derived by convolving the observed LX, CGM − M500c relation with the stellar-to-halo-mass relation (gray band). The LX, CGM − M* measurements from Anderson et al. (2015) is shifted by 0.1 dex to higher mass to account for the difference in M* estimation between Anderson et al. (2015) and this work. |
| In the text | |
Current usage metrics show cumulative count of Article Views (full-text article views including HTML views, PDF and ePub downloads, according to the available data) and Abstracts Views on Vision4Press platform.
Data correspond to usage on the plateform after 2015. The current usage metrics is available 48-96 hours after online publication and is updated daily on week days.
Initial download of the metrics may take a while.