| Issue |
A&A
Volume 693, January 2025
|
|
|---|---|---|
| Article Number | A197 | |
| Number of page(s) | 15 | |
| Section | Extragalactic astronomy | |
| DOI | https://doi.org/10.1051/0004-6361/202452273 | |
| Published online | 17 January 2025 | |
The hot circumgalactic medium in the eROSITA All-Sky Survey
III. Star-forming and quiescent galaxies
1
Max-Planck-Institut für extraterrestrische Physik (MPE), Gießenbachstraße 1, D-85748 Garching bei München, Germany
2
INAF-Osservatorio Astronomico di Brera, Via E. Bianchi 46, I-23807 Merate (LC), Italy
3
NASA Goddard Space Flight Center, Greenbelt, MD 20771, USA
4
Center for Space Sciences and Technology, University of Maryland, 1000 Hilltop Circle, Baltimore, MD 21250, USA
5
Max-Planck-Institut für Astronomie, Königstuhl 17, 69117 Heidelberg, Germany
6
European Southern Observatory, Karl Schwarzschildstrasse 2, D-85748 Garching bei München, Germany
7
Department of Astronomy, University of Science and Technology of China, Hefei 230026, China
8
School of Astronomy and Space Science, University of Science and Technology of China, Hefei 230026, China
9
Universität Hamburg, Hamburger Sternwarte, Gojenbergsweg 112, D-21029 Hamburg, Germany
⋆ Corresponding author; This email address is being protected from spambots. You need JavaScript enabled to view it.
Received:
17
September
2024
Accepted:
27
November
2024
Abstract
Aims The galaxy population shows a characteristic bimodal distribution based on the star formation activity and is sorted into star-forming or quiescent. These two subpopulations have a tendency to be located in different mass halos. The circumgalactic medium (CGM), as the gas repository for star formation, might contain the answer to the mystery of the formation of such bimodality. Here we consider the bimodality of the galaxy population and study the difference between the properties of the hot CGM around star-forming and quiescent galaxies.
Methods. We used the X-ray data from the first four SRG/eROSITA all-sky surveys (eRASS:4). We selected central star-forming and quiescent galaxies from the Sloan Digital Sky Survey DR7 with stellar mass 10.0 < log(M*/M⊙) < 11.5 or halo mass 11.5 < log(M200 m/M⊙) < 14.0 within spectroscopic redshift zspec < 0.2, and we built approximately volume-limited galaxy samples. We stacked the X-ray emission around star-forming and quiescent galaxies, respectively. We masked detected point sources and carefully modeled the X-ray emission from unresolved active galaxy nuclei (AGN) and X-ray binaries (XRB) to detect the X-ray emission from the hot CGM. We measured the X-ray surface brightness (SX, CGM) profiles and integrated the X-ray emission from hot CGM within R500c (LX, CGM) to provide the scaling relations between LX, CGM and galaxies’ stellar or halo mass.
Results. We detect extended X-ray emission from the hot CGM around star-forming galaxies with log(M*/M⊙) > 11.0 and quiescent galaxies with log(M*/M⊙) > 10.5, extending out to R500c. The SX, CGM profile of quiescent galaxies follows a β model with β ≈ 0.4, where β quantifies the slope of the profile. Star-forming galaxies with median stellar masses log(M*, med/M⊙) = 10.7, 11.1, 11.3 have LX, CGM ≈ 0.8, 2.3, 4.0 × 1040 erg/s, while for quiescent galaxies with log(M*, med/M⊙) = 10.8, 11.1, 11.4, LX, CGM ≈ 1.1, 6.2, 30 × 1040 erg/s. Notably, quiescent galaxies with log(M*, med/M⊙) > 11.0 exhibit brighter hot CGM than their star-forming counterparts. In halo mass bins, we detect similar X-ray emission around star-forming and quiescent galaxies with log(M200 m/M⊙) > 12.5, suggesting that galaxies in the same mass dark matter halos host equally bright hot CGM. We emphasize that the observed LX, CGM − M500c relations of star-forming and quiescent galaxies are sensitive to the stellar-to-halo mass relation (SHMR). A comparison with cosmological hydrodynamical simulations (EAGLE, TNG100, and SIMBA) reveals varying degrees of agreement, contingent on the simulation and the specific stellar or halo mass ranges considered.
Conclusions. Either selected in stellar mass or halo mass, the star-forming galaxies do not host brighter stacked X-ray emission from the hot CGM than their quiescent counterparts at the same mass range. The result provides useful constraints on the extent of feedback’s impacts as a mechanism for quenching star formation as implemented in current cosmological simulations.
Key words: Galaxy: halo / galaxies: general
© The Authors 2025
 Open Access article, published by EDP Sciences, under the terms of the Creative Commons Attribution License (https://creativecommons.org/licenses/by/4.0), which permits unrestricted use, distribution, and reproduction in any medium, provided the original work is properly cited.
This article is published in open access under the Subscribe to Open model.
Open Access funding provided by Max Planck Society.
1. Introduction
A puzzling observation that remains unexplained is the bimodality of the galaxy population. In the color-magnitude diagram, early-type galaxies populate a narrow “red sequence” that is separated by a shallow valley from a “blue cloud” populated by late-type galaxies (e.g., Strateva et al. 2001; Hogg et al. 2003; Baldry et al. 2004, 2006). The red sequence galaxies are mostly elliptical (lenticular) and quiescent, while blue cloud galaxies actively form stars and appear predominantly disk-like. The emergence of quiescent galaxies within the framework of hierarchical galaxy formation has been a subject of interest (e.g., Faber et al. 2007; Lacey et al. 2016). Semi-analytic and hydrodynamic simulations have provided insights into the feedback processes that can lead to galaxy quenching (Croton et al. 2006; Somerville et al. 2008; Guo et al. 2011; Vogelsberger et al. 2014; Henriques et al. 2015; Schaye et al. 2015; Pillepich et al. 2018; Ma et al. 2022). These simulations suggest that feedback from active galaxy nuclei (AGN) can play a dominant role in massive galaxies, where the energy released by the central black hole heats or expels the surrounding gas, effectively shutting down star formation. In lower-mass galaxies, stellar feedback from supernovae and stellar winds might be more significant. However, accurately modeling these feedback processes and their interplay remains challenging, necessitating new observational data to refine and constrain the models (Wechsler & Tinker 2018; Primack 2024).
The bimodality is also evident in the stellar-to-halo-mass relation (SHMR), where quiescent galaxies at a given stellar mass reside in higher-mass dark matter halos than their star-forming counterparts (Mandelbaum et al. 2006, 2016; More et al. 2011; Tinker et al. 2013; Velander et al. 2014; Taylor et al. 2020; Bilicki et al. 2021). This bimodal SHMR suggests a strong connection between halo mass and the quenching of galaxies, highlighting how the environment and halo properties influence galaxy evolution. The higher halo masses associated with quiescent galaxies suggest that denser environments and deeper gravitational potentials might facilitate more efficient quenching mechanisms, such as stronger AGN feedback or more effective shock heating of the halo gas (Zu & Mandelbaum 2016; Behroozi et al. 2019; Moster et al. 2020; Cui et al. 2021; Shi et al. 2024).
Despite the various observations and proposed quenching recipes (Puchwein & Springel 2013; Dubois et al. 2014; Hirschmann et al. 2014; Schaye et al. 2015; Khandai et al. 2015; Davé et al. 2016; Naab & Ostriker 2017; Tumlinson et al. 2017; Trussler et al. 2020; Chen et al. 2020; Guo et al. 2021; Zhang et al. 2021; Hasan et al. 2023; Tchernyshyov et al. 2023), the role and significance of each quenching mechanism remains elusive. The hot circumgalactic medium (CGM), closely associated with both feedback processes and halo mass, is a critical indicator for studying galaxy quenching (i.e., as learned from the intragroup and intracluster medium, Lovisari et al. 2021; Eckert et al. 2021). The CGM consists of the hot, diffuse gas that surrounds galaxies and extends out to the virial radius (or beyond). The CGM is crucial in exchanging material between galaxies and their environments, influencing accretion and feedback processes. The properties of the hot CGM provide vital clues about the history of gas inflows and outflows and the effectiveness of various feedback mechanisms. A comprehensive understanding of the CGM’s properties (X-ray luminosity, temperature, and metallicity) and their relation to galaxy characteristics (specific star formation rate and stellar mass) provides essential constraints on quenching models (see reviews by Naab & Ostriker 2017; Tumlinson et al. 2017; Eckert et al. 2021). Specifically, the scaling relation between stellar mass (or halo mass) and X-ray luminosity for star-forming and quiescent galaxies can provide significant insights into quenching mechanisms (Oppenheimer et al. 2020; Truong et al. 2020, 2021a,b). Understanding where the SHMR bimodality occurs, particularly in galaxies with stellar masses around ∼1010 − 11 M⊙, hosted by Mvir ∼ 1011.5 − 13 M⊙ halos is of great interest (Moster et al. 2010, 2013, 2018; Behroozi et al. 2010, 2013, 2019).
However, studying the hot CGM around ∼1010 − 11 M⊙ galaxies is challenging due to its diffuse and faint nature. Pointed observations using Chandra and XMM-Newton have measured the hot gas properties of nearby (< 50 Mpc) early-type and late-type galaxies, providing constraints on AGN and stellar feedback processes (O’Sullivan et al. 2001; O’Sullivan et al. 2003; Strickland et al. 2004; Tüllmann et al. 2006; David et al. 2006; Wang 2010; Li & Wang 2013a,b; Sarzi et al. 2013; Kim & Fabbiano 2013, 2015; Choi et al. 2015; Wang et al. 2016; Goulding et al. 2016; Forbes et al. 2017; Babyk et al. 2018; Kim et al. 2019; Hou et al. 2024). With the PV/eFEDS observations of the extended ROentgen Survey with an Imaging Telescope Array (eROSITA) on board the Spektrum Roentgen Gamma (SRG) orbital observatory, Comparat et al. (2022) stacked ∼16 000, and Chadayammuri et al. (2022) stacked ∼1600 star-forming and quiescent galaxies, respectively, to study the X-ray emission around galaxies. Both works detect extended X-ray emission around quiescent and star-forming galaxies but suffer from satellite galaxy contamination and bias from the small sky area. This impeded drawing a clear conclusion on the implications of their measurements.
This analysis is based on the state-of-the-art stacking results obtained in Zhang et al. (2024a, hereafter Paper I). Paper I applied the stacking method to the X-ray data on four eROSITA all-sky surveys (eRASS:4) (Merloni et al. 2012, 2024; Predehl et al. 2021; Sunyaev et al. 2021) around the approximately volume-limited central galaxy samples to measure their X-ray surface brightness profiles. Here, we split the central galaxy samples into star-forming and quiescent galaxy samples to investigate the differences in their X-ray profile and total X-ray luminosity.
The eROSITA X-ray data reduction and stacking method are detailed in Paper I and Zhang et al. (2024b). This paper is organized as follows. The description of the sample compilation and a brief summary of the methods are given in Sect. 2. The mean X-ray surface brightness profiles of the hot CGM and the scaling relations between the integrated X-ray luminosity and stellar mass or halo mass for star-forming and quiescent galaxies are presented in Sect. 3. We discuss the results in Sect. 4. The conclusion is summarized in Sect. 5. Throughout, we use Planck Collaboration VI (2020) cosmological parameters: H0 = 67.74 km/s/Mpc and Ωm = 0.3089. The log in this work designates log10. The stellar mass and halo mass in this work are in units of solar mass (M⊙).
2. Samples and stacking methods
2.1. Galaxy samples
We build the galaxy samples based on the SDSS DR7 spectroscopic galaxy catalog (rAB < 17.77) (Strauss et al. 2002). We take the spectroscopic redshift (zspec) estimated by Blanton et al. (2005), stellar mass estimated by Chen et al. (2012), and star-formation rate (SFR) estimated by Brinchmann et al. (2004). The star-forming or quiescent classification is defined based on the measurements of the 4000 Å break from Brinchmann et al. (2004). We study the hot CGM around the central galaxies only. The central galaxies are identified by the halo-based group finder of Tinker (2021), with a misclassification probability of about 2% (1%) for the central star-forming (quiescent) galaxies. The group finder also assigns the halo mass (M200 m) to the central galaxies1 (Alpaslan & Tinker 2020; Tinker 2021, 2022). The group finder reproduces very closely summary statistics of galaxy clustering and galaxy-galaxy lensing, especially the bimodal SHMR of star-forming and quiescent galaxies (Zehavi et al. 2011; Mandelbaum et al. 2016).
We limit the maximum redshift of the galaxies, so the sample is approximately volume-limited and complete. We build four samples from SDSS DR7:
-
CENSF sample. This sample includes 32 190 star-forming galaxies in the stellar mass range 10.0 < log(M*) < 11.5 and redshift 0.01 < zspec < 0.19, binned as listed in Table 1.
-
CENQU sample. This sample includes 53 032 quiescent galaxies in the stellar mass range 10.0 < log(M*) < 11.5 and redshift 0.01 < zspec < 0.19.
-
CENhalo, SF sample. This sample includes 63 893 star-forming galaxies with 11.5 < log(M200 m) < 13.5 and redshift 0.01 < zspec < 0.2, binned as listed in Table 1.
-
CENhalo, QU sample. This sample includes 61 619 quiescent galaxies with 11.5 < log(M200 m) < 14.0 and redshift 0.01 < zspec < 0.2.
The number of galaxies of each bin in the four samples is detailed in Table 1.
Galaxy samples used in this work.
We present the median stellar mass (M*, med) and median halo mass (M200 m, med) with the 16 − 84% scatter for each mass bin in the samples in Fig. 1. Due to the bimodal SHMR and its steep slope (M200 m ∼ M*1.6 for galaxies with log(M*)⪆10.7, Mandelbaum et al. 2016), the star-forming and quiescent galaxies within the same M* bin are hosted by halos with very different M200 m, as shown in Fig. 1. The bimodal feature is weaker at the low-mass end of SHMR (Mandelbaum et al. 2016), together with the stronger upper-scattering from low-mass star-forming galaxies than low-mass quiescent galaxies, the quiescent galaxies have higher M* than their star-forming counterparts within the same halo mass bins, as shown in Fig. 1 (also see discussion in Moster et al. 2020). By having the samples selected in both M* and M200 m bins, we can study if the different environment of star-forming and quiescent galaxies located would affect their hot CGM.
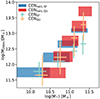 |
Fig. 1. Median M200 m and median M* of galaxies with the 16 − 84% scatter for each mass bin in the CENhalo, SF (blue band), CENhalo, QU (red band), CENSF (green crosses), and CENQU (orange cross) samples. |
2.2. X-ray data reduction and stacking method
We used the eRASS:4 data (energy-calibrated event files, vignetting-corrected mean exposure map, source catalog) processed by the eROSITA Science Analysis Software System (eSASS, version 020; Brunner et al. 2022; Merloni et al. 2024). We masked the sky area where NH > 1021 cm−2, E(B − V) < 0.1, or have overdense sources detected by eSASS (detail in Paper I).
We calculated the physical distance (Rkpc) between events and galaxies according to the redshifts of the galaxies and the angular separations. For all galaxies in the sample, we binned the events into histograms around the galaxies by Rkpc, with a weight of
![Mathematical equation: $$ \begin{aligned} W_{\rm e}=E_{\rm obs} \frac{1}{t_{\rm exp}}\frac{f_{\rm nh} A_{\rm corr}\,4\pi D_L^2 }{ A_{\rm eff}}\ [\mathrm{erg\,s}^{-1}\,\mathrm{Mpc}^2\,\mathrm{cm}^{-2}], \end{aligned} $$](/articles/aa/full_html/2025/01/aa52273-24/aa52273-24-eq1.gif) (1)
(1)
where Eobs is the observed energy of the event, texp is the exposure time of the event, fnh is the absorption correction, Acorr is the masking area correction, DL is the luminosity distance to the galaxy, Aeff is the effective area of eROSITA. We calculated the mean X-ray surface brightness (SX) as
![Mathematical equation: $$ \begin{aligned} S_{\rm X}= \sum _{r_0}^{r_1} \frac{ W_{\rm e} }{A_{\rm shell} N_{\rm g}}\ [\mathrm{erg\,s}^{-1}\,\mathrm{kpc}^{-2}], \end{aligned} $$](/articles/aa/full_html/2025/01/aa52273-24/aa52273-24-eq2.gif) (2)
(2)
where r0 and r1 are the radial bins2, Ashell is the area of each radial bin and Ng is the number of galaxies stacked. We took the background (SX, bg) as the minimum value of SX (calculated in each 100 kpc radial bin) beyond R500c. The justification of the background estimation is in the Appendix A of Paper I. The mean clean X-ray surface brightness profile of the galaxy sample is calculated by SX, gal = SX − SX, bg.
The mean X-ray luminosity (LX) of the galaxy sample is calculated by integrating the X-ray emission within R500c:
![Mathematical equation: $$ \begin{aligned} L_{\rm X}= \Sigma _{0}^{R_{\rm 500c}} S_{\rm X, gal} \times A_{\rm shell}\ [\mathrm{erg\,s}^{-1}]. \end{aligned} $$](/articles/aa/full_html/2025/01/aa52273-24/aa52273-24-eq3.gif) (3)
(3)
Both SX, gal and LX are calculated in the 0.5 − 2 keV energy bin (rest frame, soft X-ray). The uncertainties of SX, gal and LX are estimated by summing the squares of the Poisson error and the uncertainty estimated with Jackknife re-sampling (Paper I).
We correct the X-ray contamination from the 2% (1%) misclassified centrals in the CEN and CENhalo samples (paper I). To detect the diffuse X-ray emission from the hot CGM, we masked detected X-ray point sources and subtracted the XRB and unresolved AGN contribution. We adopt the XRB model from Aird et al. (2017), which relates the SFR and M* of the galaxy to its XRB luminosity (LXRB). To estimate the X-ray emission from unresolved AGN, we stacked the galaxies hosting optical AGN, identified by the BPT diagram, and calculated its maximal luminosity (LAGN; Paper I, Baldwin et al. 1981; Brinchmann et al. 2004). As discussed in Appendix A, the XRB and unresolved AGN in star-forming and quiescent galaxies are about 1039 − 1040 erg/s, and star-forming galaxies host brighter XRB and AGN than quiescent galaxies. We took the X-ray surface brightness profiles for the XRB and unresolved AGN in the stacked central galaxies in the shape of the point spread function (PSF) of eROSITA (Merloni et al. 2024, Paper I). We used the mock catalog in Paper I to evaluate the satellite populations around the stacked central galaxies, with which we model the X-ray emission from XRB in the satellites. We neglected the contribution from X-ray AGN in satellite galaxies since they have a small occurrence (< 10%, see Comparat et al. 2023). We sum the models above and obtain the total X-ray luminosity from XRB and unresolved AGN (LX, AGN + XRB + SAT) and X-ray surface brightness profile (SX, AGN + XRB + SAT). The X-ray luminosity (surface brightness) of the hot CGM is therefore LX, CGM = LX − LX, AGN + XRB + SAT (SX, CGM = SX, gal − SX, AGN + XRB + SAT). The uncertainty of the LX, CGM is propagated from the uncertainties of LX and LX, AGN + XRB + SAT, similar for SX, CGM.
3. Results
3.1. X-ray surface brightness profiles in M* bins and LX, CGM–M* relation
The SX, CGM profiles for the central star-forming and quiescent galaxies with log(M*) = 10.5 − 11.5 are plotted in Fig. 2. The X-ray emission from the hot CGM increases with the stellar mass of the galaxy. The extended X-ray emission from the hot CGM is detected out to ≈R500c around quiescent galaxies with log(M*) > 10.5 and star-forming galaxies with log(M*) > 11.0. For star-forming and quiescent galaxies with log(M*) = 10.5 − 11.0, we do not detect significant differences in their hot CGM X-ray emission. For galaxies with log(M*) > 11.0, the quiescent galaxies have brighter and more extended hot CGM X-ray emission.
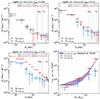 |
Fig. 2. X-ray surface brightness profiles of the hot CGM of the central star-forming (SX, CGM, SF, blue) and quiescent (SX, CGM, QU, red) galaxies with M* ∈ 10.5 − 11.0, 11.0 − 11.25 and 11.25 − 11.5 (top left, top right, and bottom left). The vertical dash-dotted (dotted) lines denote the average R500c (Rvir) of stacked central galaxies. The median redshift ( |

We use a β model (Cavaliere & Fusco-Femiano 1976) to describe the observed X-ray profiles of the hot CGM:
![Mathematical equation: $$ \begin{aligned} S_{\rm X,\,\beta }=S_{\rm X,\,0}\left[1+\left(\frac{r}{r_{\rm c}}\right)^2\right]^{-3\beta +\frac{1}{2}}\ [\mathrm {erg\,s}^{-1}\,kpc^{-2}], \end{aligned} $$](/articles/aa/full_html/2025/01/aa52273-24/aa52273-24-eq5.gif) (4)
(4)
where SX, 0 is the X-ray surface brightness at the galaxy center, r is the distance from the center, and rc is the core radius. We fit the PSF-convolved β model to the observation using the Markov chain Monte Carlo (MCMC) method.
The best-fit values and 1σ uncertainties of β, SX, 0, and rc are listed in Table 2. For the quiescent galaxies, we obtain β ≈ 0.35 − 0.45, log(SX, 0)≈36.8 − 37.6, poorly constrained rc ≈ 5. Point sources dominate the X-ray emission detected in star-forming galaxies; namely, the XRB and unresolved AGN contributes about 100% X-ray emission in the lowest star-forming log(M*) = 10.0 − 10.5 bin and about 50% in log(M*) = 10.5 − 11.5 bins, while XRB and AGN account for < 50% for quiescent galaxies (see Table 3). Limited by the uncertainty of AGN and XRB models, we can not apply proper fits for the star-forming galaxies.
Best-fit parameters in the β model for the CGM X-ray surface brightness profiles for the central star-forming and quiescent galaxies.
Rest-frame X-ray luminosity in the 0.5–2 keV band within R500c in erg s−1 of different components for CEN and CENhalo samples.
The LX, CGM − M* scaling relation is plotted in the bottom right plot of Fig. 2. Above log(M*) = 11.0, the quiescent galaxies host brighter hot CGM emission than star-forming galaxies, while no significant difference shown below log(M*) = 11.0. We compare to the LX, CGM, SF + QU obtained in Zhang et al. (2024b), where star-forming and quiescent galaxies are averaged together. LX, CGM, SF + QU approaches to the LX, CGM of quiescent galaxies at higher M*, this agrees with the observational fact that quiescent fraction increases with M* (e.g., Driver et al. 2022).
3.2. X-ray surface brightness profiles in halo mass bins and the LX, CGM–M500c scaling relation
We present in the top panel and bottom left of Fig. 3 the SX, CGM profiles of star-forming and quiescent galaxies with halo mass ranges in log(M200 m) = 12.0 − 13.5. We detect extended X-ray emission from the hot CGM out to R500c around star-forming and quiescent galaxies with log(M200 m) > 12.5. The SX, CGM of star-forming and quiescent are consistent within the uncertainties. This finding suggests that quiescent and star-forming central galaxies residing in similar-mass dark matter halos exhibit comparably bright hot CGM emission. We fit the β model to the SX, CGM and the parameters are listed in Table 2. In general, we find β ≈ 0.4 − 0.5.
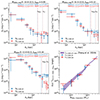 |
Fig. 3. X-ray surface brightness profiles of the hot CGM of the central star-forming (SX, CGM, SF, blue) and quiescent (SX, CGM, QU, red) galaxies with M200 m ∈ 12.0 − 12.5, 12.5 − 13.0 and 13.0 − 13.5 (top left, top right, and bottom left). The vertical dash-dotted lines denote the average R500c and Rvir of stacked galaxies. The median redshift ( |

In the bottom right of Fig. 3, we present the LX, CGM − M500c scaling relations of central star-forming and quiescent galaxies. The similar LX, CGM − M500c scaling relations of central star-forming and quiescent galaxies follow approximately the log(LX, CGM, SF + QU) = (1.32 ± 0.05)log(M500c)+(24.1 ± 0.7) obtained in Zhang et al. (2024b), where there is no split of star-forming and quiescent galaxies.
4. Discussion
In Sect. 4.1, we discuss how the uncertainty of halo mass assigned to galaxies affects the LX, CGM − M500c relation. In Sect. 4.2, we compare the observed LX, CGM − M500c and LX, CGM − M* scaling relations to the hydrodynamical simulations. In Sect. 4.3, we split star-forming and quiescent by the specific SFR and find it does not change the conclusion. In Sect. 4.4, we compare our results to Comparat et al. (2022) and Chadayammuri et al. (2022) and explain why different conclusions were drawn in the two works.
4.1. Effect of SHMR on LX, CGM–M500c
In Sect. 3.2, we find consistent LX, CGM–M500c scaling relations for star-forming and quiescent galaxies, which implies that, to the first order, halo mass is the determining factor for the CGM heating. The different feedback processes in star-forming and quiescent galaxies do not cause an observable difference in the hot CGM X-ray emission, which suggests that the regulation of feedback activity on CGM is tightly correlated with halo mass.
However, the halo masses of the galaxies in the SDSS catalog is not directly observable but is assigned by different group finder models (Yang et al. 2007; Robotham et al. 2011; Tinker 2022; Zhao et al. 2024). The halo mass (M500c or M200 m) used in this work is provided by Tinker (2021), where the halo mass is assigned according to two parameters: total luminosity of the galaxy group and its concentration. The halo mass is calibrated to obtain consistent bimodal SHMR found in Mandelbaum et al. (2016).
To figure out if different group finders affect the LX, CGM–M500c scaling relation, we build another CENhalo galaxy sample (we call it CENhalo, Yang) using the halo mass provided by Yang et al. (2007). Yang et al. (2007) assigns halo mass to galaxies using the characteristic luminosity (similar to the total luminosity of the galaxy group), differently, the resulting SHMR is approximately unimodal, that SHMR of star-forming is slightly higher than quiescent galaxies. In Fig. 4, we compare the SHMR of star-forming and quiescent galaxies in Tinker (2021) and Yang et al. (2007). The SHMR of quiescent galaxies is consistent in the two works, while Yang et al. (2007) assigns higher halo mass than Tinker (2021) to star-forming galaxies with log(M*) > 10.7.
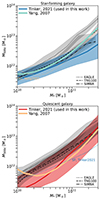 |
Fig. 4. Comparison of M500c − M* relations of central star-forming (top) and quiescent (bottom) galaxies in the catalogs of Tinker (2021) and Yang et al. (2007), and EAGLE, TNG100, and SIMBA simulations. The shadow area denotes the 16–84% scatter of the relation. Yang et al. (2007) only includes galaxy groups with log(M500c) > 11.5 and causes the turnover of the quiescent SHMR at low mass end. |
We follow the procedures in Sect. 2 to calculate the LX, CGM of galaxies in the CENhalo, Yang samples. The LX, CGM–M500c, Yang2007 scaling relation is plotted in Fig. 5. The star-forming galaxies host fainter X-ray emission than quiescent galaxies, different from the conclusion we drew in Sect. 3.2 and Fig. 3. The reason is the SHMR used to calibrate the halo mass in Yang et al. (2007). By convolving the observed LX, CGM–M* scaling relation with the SHMR used in Yang et al. (2007), we obtain the derived LX, CGM–M500c, Yang2007 (green and orange dashed lines), that is consistent with the observation, as plotted in Fig. 5. Therefore, the LX, CGM–M* and LX, CGM–M500c, Yang2007 are related by the SHMR, and the approximately unimodal SHMR in Yang et al. (2007) causes the preservation of the similar bifurcation feature in LX, CGM–M* and LX, CGM–M500c, Yang2007 relations. Differently, the bimodal SHMR in Tinker (2021) positions quiescent galaxies in higher-mass dark matter halos, especially for galaxies above log(M*) = 10.8 (see the bottom panel in Fig. 4), that compensates the brighter LX, CGM for quiescent galaxies in the high-stellar-mass end, and caused the observed consistent LX, CGM–M500c, Tinker2021 scaling relations for star-forming and quiescent galaxies. Indeed, we convolved the observed LX, CGM–M500c, Tinker2021 scaling relation with the bimodal SHMR used in Tinker (2021) and obtain consistent LX, CGM–M* relations with observation, see Fig. 6.
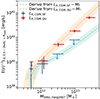 |
Fig. 5. Observed hot CGM X-ray luminosity of central star-forming galaxies (LX, CGM, SF, blue) and quiescent galaxies (LX, CGM, QU, red) selected from Yang et al. (2007), compared to the derived LX, CGM, SF or LX, CGM, QU by convolving the observed LX, CGM − M* with SHMR in Yang et al. (2007). The shadow area is the uncertainty from SHMR. |
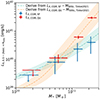 |
Fig. 6. Observed LX, CGM, SF − M* (blue) and LX, CGM, QU − M* (red) scaling relations, compared to the derived ones by convolving LX, CGM − M500c with the SHMR in Tinker (2021). |
We conclude that the consistent LX, CGM–M500c scaling relations for star-forming and quiescent galaxies (Fig. 3) are conditional upon the bimodal SHMR observed by lensing (Mandelbaum et al. 2016; Bilicki et al. 2021). Unimodal SHMR relations (such as the one in Yang et al. 2007) would give rise to different scaling relations for star-forming and quiescent galaxies. The upcoming galaxy surveys and weak lensing studies would measure more accurate bimodal SHMR, which would help to consolidate our conclusion (DESI Collaboration 2016; de Jong et al. 2019; Laureijs et al. 2011; Ivezić et al. 2019).
Nevertheless, the dominant importance of halo mass in determining hot CGM X-ray luminosity rhymes with the halo quenching model and the empirical galaxy-halo connection models such as EMERGE and UniverseMachine, where halo mass (or together with the halo assembly history) can solely determine the central galaxy quenching, without introducing the dependence on stellar mass and environment (Zu & Mandelbaum 2016; Behroozi et al. 2019; Moster et al. 2020). Interestingly, the LX, CGM–M* relations for star-forming and quiescent galaxies, which are independent of SHMR, bifurcate at about log(M*) = 11.0 (log(M200 m)≈12.5). The bifurcation mass is close to the mass scale of the peak stellar-to-halo-mass ratio and the critical mass above which the virial shocks are stable or the CGM is entirely virialized, log(M*) = 10.5 (log(M200 m)≈12.0) (Dekel & Birnboim 2006; Faucher-Giguère & Oh 2023). The similar mass scales suggest a shared underlying physical mechanism, such as the suppression of star formation due to hot accretion. We leave the further modeling and interpretation to future works.
4.2. Comparison to hydrodynamic simulations
We compare the observed LX, CGM − M* and LX, CGM − M500c scaling relations to the hydrodynamical simulations. We use three cosmological hydrodynamical simulations: EAGLE (Crain et al. 2015; Schaller et al. 2015; Schaye et al. 2015; McAlpine et al. 2016), TNG100 from IllustrisTNG (Marinacci et al. 2018; Naiman et al. 2018; Springel et al. 2018; Pillepich et al. 2018; Nelson et al. 2019a,b), and SIMBA (Davé et al. 2019). For each simulated galaxy, the X-ray luminosity of the CGM is measured in the 0.5–2 keV range and within a radial range of (0.15 − 1) R500c (Truong et al. 2021a; Comparat et al. 2022), the stellar mass is calculated within twice the half-stellar mass radius, and M500c is the total mass within R500c. The 4000 Å break definition of star-forming and quiescent galaxies is hard to reproduce in the simulations. However, as shown in Sect. 4.3, the 4000 Å break definition gives consistent results with the specific SFR (sSFR) = 10−11 yr−1 separation. We take the instantaneous SFR within twice the stellar half-mass radius of simulated galaxies to calculate sSFR and separate star-forming and quiescent galaxies.
We select and bin simulated star-forming and quiescent galaxies in the same M* bins of the CENSF and CENQU samples, and the same M200 m bins of the CENhalo, SF and CENhalo, QU samples. We calculate the mean LX, CGM and take its uncertainty as the 16 − 84% scatter of the luminosity of the galaxies. The uncertainty reflects the approximately 1-dex galaxy-to-galaxy variation across most of the mass range of simulated galaxies; notice it is different from the uncertainty defined in the observation that only reflects the variation of the mean X-ray luminosity of certain galaxy populations. We emphasize that the comparisons between observations and simulations in this work are made at face value, as we do not create a dedicated mock catalog to reproduce the stellar mass function, halo mass function and SHMR of CENSF, CENQU, CENhalo, SF and CENhalo, QU samples.
We compare the simulation predicted LX, CGM − M* to observation in the top row of Fig. 7. The different feedback models in the three simulations result in different predictions on the hot CGM properties (Truong et al. 2023; Wright et al. 2024). EAGLE predicts consistent X-ray emission at the low-mass end but overpredicts the CGM emissions for star-forming and quiescent galaxies with log(M*) > 11.0 by about 1-dex. This discrepancy suggests that the feedback model in EAGLE may be less efficient at removing gas around massive galaxies (Davies et al. 2019). TNG100 predicts brighter X-ray emission around star-forming galaxies with log(M*) > 10.5 and consistent X-ray emission around quiescent galaxies, which might suggest the feedback induced gas depletion for star-forming galaxies is less efficient in TNG100 (Truong et al. 2020). SIMBA predicts consistent X-ray emission around star-forming and quiescent galaxies at the high-mass end but underestimates X-ray emission at the low-mass end. More dedicated comparisons with simulations are essential to interpret the underlying physics, such as the interplay between stellar and AGN feedback (Medlock et al. 2024).
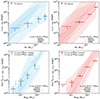 |
Fig. 7. Comparison of the observed LX, CGM − M* relation to the predictions from the EAGLE, TNG100, and SIMBA simulations with 1σ uncertainties, for star-forming (top left) and quiescent (top right) galaxies. Comparison of the observed LX, CGM − M500c relation to the predictions from the EAGLE, TNG100, and SIMBA simulations with 1σ uncertainties, for star-forming (bottom left) and quiescent (bottom right) galaxies. |
We compare the LX, CGM − M500c relations predicted by the simulations to the observation based on halo mass provided by Tinker (2021) and Yang et al. (2007) in the bottom row of Fig. 7. Differently from the LX, CGM − M* case, we notice EAGLE predicts consistent X-ray emission around star-forming galaxies with M500c, Tinker2021, but still overpredicts LX, CGM with M500c, Yang2007. The reason is the same as discussed in Sect. 4.1, the different SHMR realized in EAGLE, as compared in Fig. 4. The EAGLE simulation results in almost 1-dex higher halo mass for star-forming galaxies than Tinker (2021), which compensates for the overpredicted LX, CGM − M* relation. The difference between the star-forming SHMR of EAGLE and Yang et al. (2007) is smaller but still exists, therefore the overprediction is maintained. Star-forming SHMR of TNG100 agrees with Yang et al. (2007) but is steeper than Tinker (2021), as a result, TNG100 prediction is higher than LX, CGM − M500c, Yang2007 but consistent with LX, CGM − M500c, Tinker2021. SIMBA predicts consistent star-forming SHMR with Yang et al. (2007) and slightly steeper SHMR than Tinker (2021), and correspondingly consistent LX, CGM − M500c, Yang2007 and lower LX, CGM than the one measured in Tinker (2021)’s halo mass. Regarding quiescent galaxies, the three simulations predict consistent SHMR above log(M*) = 11.0 and higher halo mass for low-mass quiescent galaxies. Correspondingly, EAGLE and TNG100 predict consistent X-ray emission, and SIMBA significantly underestimates the X-ray emission around quiescent galaxies.
We notice that though SIMBA predicts that quiescent galaxies host brighter hot CGM, TNG100 and EAGLE do not show a significant difference between star-forming and quiescent; it is important to emphasize that this result applies only when considering the sample mean average. When considering the sample median average, all three simulations predict that star-forming galaxies are comparable or more X-ray luminous than their quiescent counterparts, as shown in previous studies (Truong et al. 2020, 2023; Oppenheimer et al. 2020). This discrepancy can be explained by the fact that the mean X-ray emission is likely biased by a small number of highly luminous galaxies in the simulation. Indeed, it is intrinsically difficult to reproduce the observed scatter of SHMR or LX, CGM − M* relation in simulations, limited by the simulation volumes and number of galaxies. In summary, the different SHMR used in group finders and simulations complicates the interpretation of our comparison. The discrepancies in the LX, CGM − M500c or LX, CGM − M* relationships could arise from both the underlying feedback physics, the methodologies used to estimate M500c and the intrinsic scatter of galaxy population. A joint and model-forward analysis of SHMR, LX, CGM − M* and LX, CGM − M500c for star-forming and quiescent galaxies in the three simulations is necessary, which we leave for future work.
We emphasize that the SHMR in the simulation is usually calibrated to agree with observation. Indeed at lower (higher) mass, the star-forming (quiescent) SHMR of the three simulations agrees within dispersion with Yang et al. (2007) and Tinker (2021) (see Fig. 4). Considering star-forming (quiescent) galaxies are dominant at low-mass (high-mass), the average SHMR of the simulations before splitting star-forming and quiescent agrees with observation (Wright et al. 2024).
4.3. Definition of star-forming and quiescent galaxies
We used the 4000 Å break to separate star-forming and quiescent galaxies and measured the SX, CGM and LX, CGM in Sect. 3. The 4000 Å break is hard to reproduce in simulations. Besides, we want to verify our results are not sensitive to the specific selection of star-forming and quiescent galaxies.
As a test, we define the star-forming and quiescent galaxies by the broadly used sSFR: galaxies with sSFR < 10−11 yr−1 are quiescent, and galaxies with sSFR > 10−11 yr−1 are star-forming. We follow the procedure in Sect. 2 to calculate the LX, CGM, sSFR for the new star-forming and quiescent samples, the resulted LX, CGM, sSFR − M* scaling relation is compared to the one of Sect. 3.1 in Fig. 8. We find consistent results and verify the definition of star-forming and quiescent galaxies does not change our results.
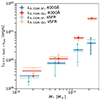 |
Fig. 8. Comparison of the LX, CGM − M* relations of star-forming and quiescent galaxies selected by the 4000 Å break or sSFR. |
4.4. Comparison with previous studies
Using the PV/eFEDS data covering a sky area of 140 deg2, two papers studied the hot CGM around star-forming and quiescent galaxies by stacking eROSITA X-ray data (Comparat et al. 2022; Chadayammuri et al. 2022). In this section, we compare our results to them and explain the factors that caused the difference.
4.4.1. Comparison to Comparat et al. (2022)
Comparat et al. (2022) stack 16142 “central” galaxies at 0.05 ≤ zspec ≤ 0.3 taken from the GAMA spectroscopic survey. They define the central galaxies as the most massive galaxy within 2Rvir and found about 90% galaxies in GAMA are central. During stacking, the X-ray-detected galaxy clusters associated with the stacked galaxies are not masked. They find that quiescent galaxies’ X-ray surface brightness profiles are brighter and more extended than star-forming galaxies. They provide the scaling relation between X-ray luminosity within 300 kpc (LX, < 300 kpc and the stellar mass of galaxies (Fig. 7 in Comparat et al. 2022).
We compare our stacking based on our CENSF and CENQU samples to Comparat et al. (2022) in the left column of Fig. 9. To keep consistency, we do not mask extended X-ray sources and integrate the X-ray emission within 300 kpc around galaxies. We obtain much lower LX, < 300 kpc of quiescent galaxies than Comparat et al. (2022). Except for the reasons of different source masking and galaxy samples, the most plausible reason for the discrepancy is the satellite boost bias in Comparat et al. (2022). In Paper I and also in Appendix B, we stack central and satellite galaxies respectively and find more extended and brighter X-ray emission around satellite galaxies, which is due to the contamination from the nearby massive galaxies around stacked satellites. Consequently, including the satellite galaxies (misclassified as central) in the galaxy sample would boost the X-ray emission (See also Shreeram et al. (2024), where they quantify this effect and conclude that for log(M*)≈11.0 galaxies, the satellite boost effect cannot be ignored). To remove this kind of satellite boost bias, we stack only central galaxies in our study, where the central galaxies are identified by the group finder with high accuracy. The central galaxy fraction of CENQU is about 70%. If we include also satellite galaxies in the stacking, the LX, < 300 kpc would increase by about 2–3 times, as shown in the upper left panel of Fig. 9, which is, however, still lower LX, < 300 kpc than Comparat et al. (2022). Considering the GAMA survey (rAB = 19.8) is deeper than SDSS (rAB = 17.8), the central galaxy fraction of GAMA is expected to be lower, as more fainter galaxies, namely potential satellite galaxies, are included in the sample. We assume the mean X-ray luminosity of satellite (and central) galaxies in the GAMA catalog has the same bright X-ray emission as SDSS, and the bright LX, < 300 kpc of Comparat et al. (2022) is solely due to the satellite boost bias. We scale the satellite fraction (fsat) and the corresponding LX, < 300 kpc to the LX, < 300 kpc values from Comparat et al. (2022). We obtain the satellite fraction lower-limit of the GAMA galaxy sample used in Comparat et al. (2022). We find a satellite fraction of about 40–50% can explain the bright LX, < 300 kpc in Comparat et al. (2022).
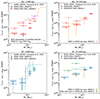 |
Fig. 9. X-ray luminosity within 300 kpc, without masking extended X-ray sources, for quiescent (top left) and star-forming (bottom left) central galaxies, and central and satellite galaxies together, compared to Comparat et al. (2022). Also shown are the satellite fractions to explain the bright LX of quiescent galaxies Comparat et al. (2022). X-ray luminosity within 10–100 kpc, after masking all X-ray sources and subtracting XRB emission, for quiescent (top right) and star-forming (bottom right) central galaxies, central and satellite galaxies together, compared to Chadayammuri et al. (2022). Also shown is the LX, CGM of central star-forming galaxies selected in eFEDS sky area and galaxies with star companion. |
We find consistent LX, < 300 kpc of star-forming galaxies with Comparat et al. (2022). This is because, first, the X-ray emission around star-forming galaxies is less extended and bright, therefore less contaminating nearby galaxies. Second, the central fraction of star-forming galaxies is high (about 80%). As a result, star-forming galaxies are less affected by the satellite boost bias.
4.4.2. Comparison to Chadayammuri et al. (2022)
Chadayammuri et al. (2022) stacked about 1600 galaxies at 0.01 < zspec < 0.1 selected from 2643 galaxies located in the overlap sky area of SDSS and eFEDs (Ahn et al. 2014; Montero-Dorta et al. 2016). They do not select central galaxies but mask all known X-ray-detected galaxy clusters, in this way, most satellite galaxies (and part of central galaxies) are excluded. They obtain slightly brighter or comparable X-ray emission around star-forming galaxies than quiescent galaxies. They provide the scaling relation between X-ray luminosity within 10–100 kpc (LX, 10 − 100 kpc) and the stellar mass of galaxies (Fig. 4 in Chadayammuri et al. 2022).
We calculate the X-ray luminosity within 10–100 kpc of CENSF and CENQU samples and compare them to Chadayammuri et al. (2022) in the right column of Fig. 9. We find consistent LX, 10 − 100 kpc of quiescent galaxies with Chadayammuri et al. (2022), and lower LX, 10 − 100 kpc in the star-forming galaxies than Chadayammuri et al. (2022). To figure out the reasons for the difference in the star-forming galaxies, we stack the galaxies in CENSF sample located in the eFEDS region. We find consistent LX, 10 − 100 kpc with Chadayammuri et al. (2022) for the lowest stellar mass bin. This suggests that a limited number of galaxies (about 400) located in the small volume may not be representative of the average properties of the galaxy population. Indeed, an overabundance of dwarf star-forming galaxies is found in the eFEDS area (Vulic et al. 2022). The bright LX, 10 − 100 kpc of the middle stellar mass bin in Chadayammuri et al. (2022) is also inconsistent with our results. We observe this might be due to the star contamination in the SDSS galaxy sample in Chadayammuri et al. (2022). Indeed, we find about 175 galaxies in Chadayammuri et al. (2022) are not included in Tinker (2021), within which about 26 (19) star-forming (quiescent) galaxies near bright stars (ILSS = − 1, Blanton et al. 2005). We stack the galaxies not included in Tinker (2021) at the middle star-forming stellar mass bin (29 galaxies) and find LX, 10 − 100 kpc ≈ 1041 erg/s, which can explain the higher LX, 10 − 100 kpc. For the other star-forming and quiescent stellar mass bins, the star contamination is not prominent after averaging.
We conclude that the accuracy of the stacking result relies on the cleanness and completeness of the central galaxy sample. By minimizing the satellite boost bias, defining a large enough approximately volume-limited galaxy sample, and carefully masking and modeling point sources, our work provides a more accurate view of the LX − M* scaling relations for star-forming and quiescent central galaxies at low redshift.
5. Conclusions
For this work, we used the X-ray data from the eROSITA all-sky survey to detect the difference in the hot circumgalactic medium around star-forming and quiescent galaxies. We built approximately volume-limited central star-forming and quiescent galaxy samples with stellar mass log(M*) = 10.0 − 11.5 or halo mass log(M200 m) = 11.5 − 14.0 from the SDSS DR7 catalog (Table 1 and Fig. 1). We stacked the X-ray emission around galaxies and we report the following findings:
-
We detect extended X-ray emission from the hot CGM out to R500c around star-forming galaxies with log(M*) > 11.0 and quiescent galaxies with log(M*) > 10.5. The hot CGM X-ray surface brightness (SX, CGM) profile of quiescent galaxies can be described by a β model with β ≈ 0.4 (Fig. 2 and Table 2).
-
We measured the scaling relation of the integrated hot CGM luminosity (LX, CGM) within R500c with M*. Above log(M*) = 11.0, LX, CGM of quiescent galaxies is brighter than star-forming galaxies; comparable LX, CGM is found below log(M*) = 11.0 (Fig. 2 and Table 3).
-
We detect extended X-ray emission in haloes with log(M200 m) > 12.5 around star-forming and quiescent galaxies out to R500c. The SX, CGM profile can be described by a β model with β ≈ 0.4 − 0.5 (Fig. 3 and Table 2).
-
Based on the bimodal SHMR (Tinker 2021), we find consistent LX, CGM − M500c scaling relations for star-forming and quiescent galaxies, which suggests halo mass is the determining factor for the CGM heating (Fig. 3 and Table 3).
-
The observed LX, CGM − M500c relation depends on the SHMR used to estimate the halo mass of galaxies, namely, star-forming galaxies may host less bright CGM than quiescent galaxies if a unimodal SHMR (Yang et al. 2007) is adopted (Figs. 4 and 5). However, either selected in stellar mass or halo mass and independent of the SHMR, the star-forming galaxies do not host brighter X-ray emission from the hot CGM than their quiescent counterparts.
-
We compare our results to the cosmological hydrodynamical simulations EAGLE, TNG100, and SIMBA (Fig. 7). We find discrepancies in some stellar or halo mass bins, which might arise from the methodologies used to estimate halo mass, intrinsic scatter of the galaxy population, and the underlying feedback physics.
-
We discuss the results of Comparat et al. (2022) and Chadayammuri et al. (2022) (Fig. 9). We find satellite boost bias, a limited number of galaxies, and star contamination contribute to the difference between Comparat et al. (2022) and Chadayammuri et al. (2022). By building large and well-defined central galaxy samples, we minimized all the biases and provide more accurate measurements of the CGM around star-forming and quiescent galaxies.
We discuss how the LX, CGM − M500c scaling relations rely on the SHMR used to calibrate the halo mass in group finders and cosmological simulations. The upcoming galaxy surveys and weak lensing studies will provide more accurate SHMR measurements, for example, DESI (DESI Collaboration 2016), 4MOST (de Jong et al. 2019), Euclid (Laureijs et al. 2011), and LSST (Ivezić et al. 2019). Examining whether the hot CGM temperature (or even metallicity) differs or aligns between star-forming and quiescent galaxies will constrain the heating-cooling processes and baryon budget, which provide additional constraints on the feedback and quenching mechanism. We will investigate this through eROSITA X-ray spectra analysis, and future X-ray microcalorimeters (XRISM Science Team 2020; Zhang et al. 2022; Barret et al. 2023; Schellenberger et al. 2024). Our measurements provide new constraints on the quenching mechanism and the role of different feedback processes, to be further investigated either through the semi-analytic models (Singh et al. 2024; Voit et al. 2024) or cosmological simulations (Braspenning et al. 2024; Vladutescu-Zopp et al. 2024; Sultan et al. 2024).
The halo mass provided in the catalog Tinker (2021) is M200 m, the mass within the radius where the mean interior density is 200 times the background universe density. To ease the comparison to literature, we convert the M200 m to M500c with the mass-concentration relation model from Ishiyama et al. (2021). M500c is the mass within R500c, the radius where the density is 500 times the background universe critical density.
The radial bin boundaries used are (0, 10, 30, 50, 75, 100, 200, 300, 400, 500, 600, 700, 800, 900, 1000, 1100, 1200, 1300, 1400, 1600, 1800, 2000, 2200, 2400, 2600, 2800, 3000) kpc.
Acknowledgments
We thank the anonymous referee for thoughtful comments that improved the manuscript. We thank Dominique Eckert for the meaningful discussion. This project acknowledges financial support from the European Research Council (ERC) under the European Union’s Horizon 2020 research and innovation program HotMilk (grant agreement No. 865637). GP acknowledges support from Bando per il Finanziamento della Ricerca Fondamentale 2022 dell’Istituto Nazionale di Astrofisica (INAF): GO Large program and from the Framework per l’Attrazione e il Rafforzamento delle Eccellenze (FARE) per la ricerca in Italia (R20L5S39T9). NT acknowledges support from NASA under award number 80GSFC21M0002. PP has received funding from the European Research Council (ERC) under the European Union’s Horizon Europe research and innovation program ERC CoG (Grant agreement No. 101045437). This work is based on data from eROSITA, the soft X-ray instrument aboard SRG, a joint Russian-German science mission supported by the Russian Space Agency (Roskosmos), in the interests of the Russian Academy of Sciences represented by its Space Research Institute (IKI), and the Deutsches Zentrum für Luft- und Raumfahrt (DLR). The SRG spacecraft was built by Lavochkin Association (NPOL) and its subcontractors, and is operated by NPOL with support from the Max Planck Institute for Extraterrestrial Physics (MPE). The development and construction of the eROSITA X-ray instrument was led by MPE, with contributions from the Dr. Karl Remeis Observatory Bamberg & ECAP (FAU Erlangen-Nuernberg), the University of Hamburg Observatory, the Leibniz Institute for Astrophysics Potsdam (AIP), and the Institute for Astronomy and Astrophysics of the University of Tübingen, with the support of DLR and the Max Planck Society. The Argelander Institute for Astronomy of the University of Bonn and the Ludwig Maximilians Universität Munich also participated in the science preparation for eROSITA. The eROSITA data shown here were processed using the eSASS/NRTA software system developed by the German eROSITA consortium. Funding for the SDSS and SDSS-II has been provided by the Alfred P. Sloan Foundation, the Participating Institutions, the National Science Foundation, the U.S. Department of Energy, the National Aeronautics and Space Administration, the Japanese Monbukagakusho, the Max Planck Society, and the Higher Education Funding Council for England. The SDSS Web Site is http://www.sdss.org/. The SDSS is managed by the Astrophysical Research Consortium for the Participating Institutions. The Participating Institutions are the American Museum of Natural History, Astrophysical Institute Potsdam, University of Basel, University of Cambridge, Case Western Reserve University, University of Chicago, Drexel University, Fermilab, the Institute for Advanced Study, the Japan Participation Group, Johns Hopkins University, the Joint Institute for Nuclear Astrophysics, the Kavli Institute for Particle Astrophysics and Cosmology, the Korean Scientist Group, the Chinese Academy of Sciences (LAMOST), Los Alamos National Laboratory, the Max-Planck-Institute for Astronomy (MPIA), the Max-Planck-Institute for Astrophysics (MPA), New Mexico State University, Ohio State University, University of Pittsburgh, University of Portsmouth, Princeton University, the United States Naval Observatory, and the University of Washington.
References
- Ahn, C. P., Alexandroff, R., Allende Prieto, C., et al. 2014, ApJS, 211, 17 [NASA ADS] [CrossRef] [Google Scholar]
- Aird, J., Coil, A. L., & Georgakakis, A. 2017, MNRAS, 465, 3390 [NASA ADS] [CrossRef] [Google Scholar]
- Alpaslan, M., & Tinker, J. L. 2020, MNRAS, 496, 5463 [NASA ADS] [CrossRef] [Google Scholar]
- Babyk, I. V., McNamara, B. R., Nulsen, P. E. J., et al. 2018, ApJ, 857, 32 [Google Scholar]
- Baldry, I. K., Glazebrook, K., Brinkmann, J., et al. 2004, ApJ, 600, 681 [Google Scholar]
- Baldry, I. K., Balogh, M. L., Bower, R. G., et al. 2006, MNRAS, 373, 469 [Google Scholar]
- Baldwin, J. A., Phillips, M. M., & Terlevich, R. 1981, PASP, 93, 5 [Google Scholar]
- Barret, D., Albouys, V., Herder, J.-W. D., et al. 2023, Exp. Astron., 55, 373 [NASA ADS] [CrossRef] [Google Scholar]
- Behroozi, P. S., Conroy, C., & Wechsler, R. H. 2010, ApJ, 717, 379 [Google Scholar]
- Behroozi, P. S., Wechsler, R. H., & Conroy, C. 2013, ApJ, 770, 57 [NASA ADS] [CrossRef] [Google Scholar]
- Behroozi, P., Wechsler, R. H., Hearin, A. P., & Conroy, C. 2019, MNRAS, 488, 3143 [NASA ADS] [CrossRef] [Google Scholar]
- Bilicki, M., Dvornik, A., Hoekstra, H., et al. 2021, A&A, 653, A82 [NASA ADS] [CrossRef] [EDP Sciences] [Google Scholar]
- Blanton, M. R., Schlegel, D. J., Strauss, M. A., et al. 2005, AJ, 129, 2562 [NASA ADS] [CrossRef] [Google Scholar]
- Braspenning, J., Schaye, J., Schaller, M., et al. 2024, MNRAS, 533, 2656 [NASA ADS] [CrossRef] [Google Scholar]
- Brinchmann, J., Charlot, S., White, S. D. M., et al. 2004, MNRAS, 351, 1151 [Google Scholar]
- Brunner, H., Liu, T., Lamer, G., et al. 2022, A&A, 661, A1 [NASA ADS] [CrossRef] [EDP Sciences] [Google Scholar]
- Cavaliere, A., & Fusco-Femiano, R. 1976, A&A, 49, 137 [NASA ADS] [Google Scholar]
- Chadayammuri, U., Bogdán, Á., Oppenheimer, B. D., et al. 2022, ApJ, 936, L15 [NASA ADS] [CrossRef] [Google Scholar]
- Chen, Y.-M., Kauffmann, G., Tremonti, C. A., et al. 2012, MNRAS, 421, 314 [NASA ADS] [Google Scholar]
- Chen, Z., Faber, S. M., Koo, D. C., et al. 2020, ApJ, 897, 102 [NASA ADS] [CrossRef] [Google Scholar]
- Choi, E., Ostriker, J. P., Naab, T., Oser, L., & Moster, B. P. 2015, MNRAS, 449, 4105 [CrossRef] [Google Scholar]
- Comparat, J., Truong, N., Merloni, A., et al. 2022, A&A, 666, A156 [NASA ADS] [CrossRef] [EDP Sciences] [Google Scholar]
- Comparat, J., Luo, W., Merloni, A., et al. 2023, A&A, 673, A122 [NASA ADS] [CrossRef] [EDP Sciences] [Google Scholar]
- Crain, R. A., Schaye, J., Bower, R. G., et al. 2015, MNRAS, 450, 1937 [NASA ADS] [CrossRef] [Google Scholar]
- Croton, D. J., Springel, V., White, S. D. M., et al. 2006, MNRAS, 365, 11 [Google Scholar]
- Cui, W., Davé, R., Peacock, J. A., Anglés-Alcázar, D., & Yang, X. 2021, Nat. Astron., 5, 1069 [NASA ADS] [CrossRef] [Google Scholar]
- Davé, R., Thompson, R., & Hopkins, P. F. 2016, MNRAS, 462, 3265 [Google Scholar]
- Davé, R., Anglés-Alcázar, D., Narayanan, D., et al. 2019, MNRAS, 486, 2827 [Google Scholar]
- David, L. P., Jones, C., Forman, W., Vargas, I. M., & Nulsen, P. 2006, ApJ, 653, 207 [NASA ADS] [CrossRef] [Google Scholar]
- Davies, J. J., Crain, R. A., McCarthy, I. G., et al. 2019, MNRAS, 485, 3783 [NASA ADS] [CrossRef] [Google Scholar]
- de Jong, R. S., Agertz, O., Berbel, A. A., et al. 2019, Messenger, 175, 3 [Google Scholar]
- Dekel, A., & Birnboim, Y. 2006, MNRAS, 368, 2 [NASA ADS] [CrossRef] [Google Scholar]
- DESI Collaboration (Aghamousa, A., et al.) 2016, arXiv e-prints [arXiv:1611.00036] [Google Scholar]
- Driver, S. P., Bellstedt, S., Robotham, A. S. G., et al. 2022, MNRAS, 513, 439 [NASA ADS] [CrossRef] [Google Scholar]
- Dubois, Y., Pichon, C., Welker, C., et al. 2014, MNRAS, 444, 1453 [Google Scholar]
- Eckert, D., Gaspari, M., Gastaldello, F., Le Brun, A. M. C., & O’Sullivan, E. 2021, Universe, 7, 142 [NASA ADS] [CrossRef] [Google Scholar]
- Faber, S. M., Willmer, C. N. A., Wolf, C., et al. 2007, ApJ, 665, 265 [Google Scholar]
- Faucher-Giguère, C.-A., & Oh, S. P. 2023, ARA&A, 61, 131 [CrossRef] [Google Scholar]
- Forbes, D. A., Alabi, A., Romanowsky, A. J., et al. 2017, MNRAS, 464, L26 [NASA ADS] [CrossRef] [Google Scholar]
- Goulding, A. D., Greene, J. E., Ma, C.-P., et al. 2016, ApJ, 826, 167 [Google Scholar]
- Guo, Q., White, S., Boylan-Kolchin, M., et al. 2011, MNRAS, 413, 101 [Google Scholar]
- Guo, H., Jones, M. G., Wang, J., & Lin, L. 2021, ApJ, 918, 53 [NASA ADS] [CrossRef] [Google Scholar]
- Hasan, F., Burchett, J. N., Abeyta, A., et al. 2023, ApJ, 950, 114 [NASA ADS] [CrossRef] [Google Scholar]
- Henriques, B. M. B., White, S. D. M., Thomas, P. A., et al. 2015, MNRAS, 451, 2663 [Google Scholar]
- Hirschmann, M., Dolag, K., Saro, A., et al. 2014, MNRAS, 442, 2304 [Google Scholar]
- Hogg, D. W., Blanton, M. R., Eisenstein, D. J., et al. 2003, ApJ, 585, L5 [NASA ADS] [CrossRef] [Google Scholar]
- Hou, M., He, L., Hu, Z., et al. 2024, ApJ, 961, 249 [NASA ADS] [CrossRef] [Google Scholar]
- Ishiyama, T., Prada, F., Klypin, A. A., et al. 2021, MNRAS, 506, 4210 [NASA ADS] [CrossRef] [Google Scholar]
- Ivezić, Ž., Kahn, S. M., Tyson, J. A., et al. 2019, ApJ, 873, 111 [Google Scholar]
- Khandai, N., Di Matteo, T., Croft, R., et al. 2015, MNRAS, 450, 1349 [NASA ADS] [CrossRef] [Google Scholar]
- Kim, D.-W., & Fabbiano, G. 2013, ApJ, 776, 116 [NASA ADS] [CrossRef] [Google Scholar]
- Kim, D.-W., & Fabbiano, G. 2015, ApJ, 812, 127 [NASA ADS] [CrossRef] [Google Scholar]
- Kim, D.-W., James, N., Fabbiano, G., Forbes, D., & Alabi, A. 2019, MNRAS, 488, 1072 [Google Scholar]
- Lacey, C. G., Baugh, C. M., Frenk, C. S., et al. 2016, MNRAS, 462, 3854 [Google Scholar]
- Laureijs, R., Amiaux, J., Arduini, S., et al. 2011, arXiv e-prints [arXiv:1110.3193] [Google Scholar]
- Li, J.-T., & Wang, Q. D. 2013a, MNRAS, 435, 3071 [NASA ADS] [CrossRef] [Google Scholar]
- Li, J.-T., & Wang, Q. D. 2013b, MNRAS, 428, 2085 [NASA ADS] [CrossRef] [Google Scholar]
- Lovisari, L., Ettori, S., Gaspari, M., & Giles, P. A. 2021, Universe, 7, 139 [NASA ADS] [CrossRef] [Google Scholar]
- Ma, W., Liu, K., Guo, H., et al. 2022, ApJ, 941, 205 [NASA ADS] [CrossRef] [Google Scholar]
- Mandelbaum, R., Seljak, U., Kauffmann, G., Hirata, C. M., & Brinkmann, J. 2006, MNRAS, 368, 715 [NASA ADS] [CrossRef] [Google Scholar]
- Mandelbaum, R., Wang, W., Zu, Y., et al. 2016, MNRAS, 457, 3200 [Google Scholar]
- Marinacci, F., Vogelsberger, M., Pakmor, R., et al. 2018, MNRAS, 480, 5113 [NASA ADS] [Google Scholar]
- McAlpine, S., Helly, J. C., Schaller, M., et al. 2016, Astron. Comput., 15, 72 [NASA ADS] [CrossRef] [Google Scholar]
- Medlock, I., Neufeld, C., Nagai, D., et al. 2024, ApJ, submitted [arXiv:2410.16361] [Google Scholar]
- Merloni, A., Predehl, P., Becker, W., et al. 2012, arXiv e-prints [arXiv:1209.3114] [Google Scholar]
- Merloni, A., Lamer, G., Liu, T., et al. 2024, A&A, 682, A78 [NASA ADS] [CrossRef] [EDP Sciences] [Google Scholar]
- Montero-Dorta, A. D., Bolton, A. S., Brownstein, J. R., et al. 2016, MNRAS, 461, 1131 [CrossRef] [Google Scholar]
- More, S., van den Bosch, F. C., Cacciato, M., et al. 2011, MNRAS, 410, 210 [Google Scholar]
- Moster, B. P., Somerville, R. S., Maulbetsch, C., et al. 2010, ApJ, 710, 903 [Google Scholar]
- Moster, B. P., Naab, T., & White, S. D. M. 2013, MNRAS, 428, 3121 [Google Scholar]
- Moster, B. P., Naab, T., & White, S. D. M. 2018, MNRAS, 477, 1822 [Google Scholar]
- Moster, B. P., Naab, T., & White, S. D. M. 2020, MNRAS, 499, 4748 [Google Scholar]
- Naab, T., & Ostriker, J. P. 2017, ARA&A, 55, 59 [Google Scholar]
- Naiman, J. P., Pillepich, A., Springel, V., et al. 2018, MNRAS, 477, 1206 [Google Scholar]
- Nelson, D., Springel, V., Pillepich, A., et al. 2019a, Comput. Astrophys. Cosmol., 6, 2 [Google Scholar]
- Nelson, D., Pillepich, A., Springel, V., et al. 2019b, MNRAS, 490, 3234 [Google Scholar]
- Oppenheimer, B. D., Bogdán, Á., Crain, R. A., et al. 2020, ApJ, 893, L24 [NASA ADS] [CrossRef] [Google Scholar]
- O’Sullivan, E., Forbes, D. A., & Ponman, T. J. 2001, MNRAS, 328, 461 [NASA ADS] [CrossRef] [Google Scholar]
- O’Sullivan, E., Ponman, T. J., & Collins, R. S. 2003, MNRAS, 340, 1375 [CrossRef] [Google Scholar]
- Pillepich, A., Nelson, D., Hernquist, L., et al. 2018, MNRAS, 475, 648 [Google Scholar]
- Planck Collaboration VI. 2020, A&A, 641, A6 [NASA ADS] [CrossRef] [EDP Sciences] [Google Scholar]
- Predehl, P., Andritschke, R., Arefiev, V., et al. 2021, A&A, 647, A1 [EDP Sciences] [Google Scholar]
- Primack, J. R. 2024, Annu. Rev. Nucl. Part. Sci., 74, 173 [Google Scholar]
- Puchwein, E., & Springel, V. 2013, MNRAS, 428, 2966 [NASA ADS] [CrossRef] [Google Scholar]
- Robotham, A. S. G., Norberg, P., Driver, S. P., et al. 2011, MNRAS, 416, 2640 [NASA ADS] [CrossRef] [Google Scholar]
- Sarzi, M., Alatalo, K., Blitz, L., et al. 2013, MNRAS, 432, 1845 [NASA ADS] [CrossRef] [Google Scholar]
- Schaller, M., Dalla Vecchia, C., Schaye, J., et al. 2015, MNRAS, 454, 2277 [NASA ADS] [CrossRef] [Google Scholar]
- Schaye, J., Crain, R. A., Bower, R. G., et al. 2015, MNRAS, 446, 521 [Google Scholar]
- Schellenberger, G., Bogdán, Á., ZuHone, J. A., et al. 2024, ApJ, 969, 85 [Google Scholar]
- Shi, K., Malavasi, N., Toshikawa, J., & Zheng, X. 2024, ApJ, 961, 39 [NASA ADS] [CrossRef] [Google Scholar]
- Shreeram, S., Merloni, A., Zhang, Y., et al. 2024, A&A, submitted [arXiv:2409.10397] [Google Scholar]
- Singh, P., Lau, E. T., Faerman, Y., Stern, J., & Nagai, D. 2024, MNRAS, 532, 3222 [NASA ADS] [CrossRef] [Google Scholar]
- Somerville, R. S., Hopkins, P. F., Cox, T. J., Robertson, B. E., & Hernquist, L. 2008, MNRAS, 391, 481 [NASA ADS] [CrossRef] [Google Scholar]
- Springel, V., Pakmor, R., Pillepich, A., et al. 2018, MNRAS, 475, 676 [Google Scholar]
- Strateva, I., Ivezić, Ž., Knapp, G. R., et al. 2001, AJ, 122, 1861 [CrossRef] [Google Scholar]
- Strauss, M. A., Weinberg, D. H., Lupton, R. H., et al. 2002, AJ, 124, 1810 [Google Scholar]
- Strickland, D. K., Heckman, T. M., Colbert, E. J. M., Hoopes, C. G., & Weaver, K. A. 2004, ApJS, 151, 193 [Google Scholar]
- Sultan, I., Faucher-Giguère, C. A., Stern, J., et al. 2024, MNRAS, submitted [arXiv:2410.16359] [Google Scholar]
- Sunyaev, R., Arefiev, V., Babyshkin, V., et al. 2021, A&A, 656, A132 [NASA ADS] [CrossRef] [EDP Sciences] [Google Scholar]
- Taylor, E. N., Cluver, M. E., Duffy, A., et al. 2020, MNRAS, 499, 2896 [Google Scholar]
- Tchernyshyov, K., Werk, J. K., Wilde, M. C., et al. 2023, ApJ, 949, 41 [NASA ADS] [CrossRef] [Google Scholar]
- Tinker, J. L. 2021, ApJ, 923, 154 [NASA ADS] [CrossRef] [Google Scholar]
- Tinker, J. L. 2022, AJ, 163, 126 [NASA ADS] [CrossRef] [Google Scholar]
- Tinker, J. L., Leauthaud, A., Bundy, K., et al. 2013, ApJ, 778, 93 [Google Scholar]
- Truong, N., Pillepich, A., Werner, N., et al. 2020, MNRAS, 494, 549 [NASA ADS] [CrossRef] [Google Scholar]
- Truong, N., Pillepich, A., Nelson, D., Werner, N., & Hernquist, L. 2021a, MNRAS, 508, 1563 [NASA ADS] [CrossRef] [Google Scholar]
- Truong, N., Pillepich, A., & Werner, N. 2021b, MNRAS, 501, 2210 [NASA ADS] [CrossRef] [Google Scholar]
- Truong, N., Pillepich, A., Nelson, D., et al. 2023, MNRAS, 525, 1976 [NASA ADS] [CrossRef] [Google Scholar]
- Trussler, J., Maiolino, R., Maraston, C., et al. 2020, MNRAS, 491, 5406 [Google Scholar]
- Tüllmann, R., Pietsch, W., Rossa, J., Breitschwerdt, D., & Dettmar, R. J. 2006, A&A, 448, 43 [CrossRef] [EDP Sciences] [Google Scholar]
- Tumlinson, J., Peeples, M. S., & Werk, J. K. 2017, ARA&A, 55, 389 [Google Scholar]
- Velander, M., van Uitert, E., Hoekstra, H., et al. 2014, MNRAS, 437, 2111 [Google Scholar]
- Vladutescu-Zopp, S., Biffi, V., & Dolag, K. 2024, arXiv e-prints [arXiv:2406.02686] [Google Scholar]
- Vogelsberger, M., Genel, S., Springel, V., et al. 2014, MNRAS, 444, 1518 [Google Scholar]
- Voit, G. M., Pandya, V., Fielding, D. B., et al. 2024, ApJ, 976, 150 [NASA ADS] [CrossRef] [Google Scholar]
- Vulic, N., Hornschemeier, A. E., Haberl, F., et al. 2022, A&A, 661, A16 [NASA ADS] [CrossRef] [EDP Sciences] [Google Scholar]
- Wang, Q. D. 2010, Proc. Natl. Acad. Sci., 107, 7168 [NASA ADS] [CrossRef] [Google Scholar]
- Wang, Q. D., Li, J., Jiang, X., & Fang, T. 2016, MNRAS, 457, 1385 [CrossRef] [Google Scholar]
- Wechsler, R. H., & Tinker, J. L. 2018, ARA&A, 56, 435 [NASA ADS] [CrossRef] [Google Scholar]
- Wright, R. J., Somerville, R. S., Lagos, C. d. P., et al. 2024, MNRAS, 532, 3417 [NASA ADS] [CrossRef] [Google Scholar]
- XRISM Science Team 2020, arXiv e-prints [arXiv:2003.04962] [Google Scholar]
- Yang, X., Mo, H. J., van den Bosch, F. C., et al. 2007, ApJ, 671, 153 [Google Scholar]
- Zehavi, I., Zheng, Z., Weinberg, D. H., et al. 2011, ApJ, 736, 59 [NASA ADS] [CrossRef] [Google Scholar]
- Zhang, C., Peng, Y., Ho, L. C., et al. 2021, ApJ, 911, 57 [NASA ADS] [CrossRef] [Google Scholar]
- Zhang, Y.-N., Li, C., Xu, D., & Cui, W. 2022, Exp. Astron., 53, 1053 [NASA ADS] [CrossRef] [Google Scholar]
- Zhang, Y., Comparat, J., Ponti, G., et al. 2024a, A&A, 690, A267 [NASA ADS] [CrossRef] [EDP Sciences] [Google Scholar]
- Zhang, Y., Comparat, J., Ponti, G., et al. 2024b, A&A, 690, A268 [NASA ADS] [CrossRef] [EDP Sciences] [Google Scholar]
- Zhao, D., Peng, Y., Jing, Y., et al. 2024, ApJ, submitted [arXiv:2408.12442] [Google Scholar]
- Zu, Y., & Mandelbaum, R. 2016, MNRAS, 457, 4360 [NASA ADS] [CrossRef] [Google Scholar]
Appendix A: AGN models for star-forming and quiescent galaxies
The percentages of central star-forming or quiescent galaxies identified as hosting AGN (fAGN), based on the BPT diagram, are listed in Table A.1 (Baldwin et al. 1981; Brinchmann et al. 2004). We name the galaxy sample hosting AGN as CENAGN. We follow the method in Paper I to calculate the maximal unresolved AGN emission in the CENAGN sample (LAGN). The AGN luminosity of the CEN or CENhalo is thereby estimated to be (1 − 2)×fAGN × LAGN.
We present in Fig. A.1 the modeled X-ray luminosity of XRB and unresolved AGN for CEN and CENhalo samples.
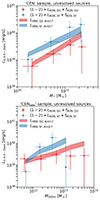 |
Fig. A.1. Top: the model predicted XRB luminosity (band) and the modeled X-ray luminosity of unresolved AGN (data points) for star-forming (blue) and quiescent (red) galaxies in the CEN sampley. Bottom: Similar to the top panel but for the CENhalo sample. |
The star-forming galaxies generally host brighter XRB and unresolved AGN than quiescent galaxies.
Percentage and number of galaxies hosting AGN in CEN and CENhalo samples, identified using the BPT diagram (Baldwin et al. 1981; Brinchmann et al. 2004).
Appendix B: The X-ray surface brightness profiles of star-forming and quiescent galaxies without masking X-ray sources
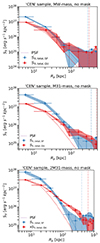 |
Fig. B.1. The X-ray surface brightness profiles of central star-forming (SX, mask, SF, blue) and quiescent (SX, mask, QU, red) galaxies in CEN sample without masking X-ray sources. The vertical dash-dotted line denotes the average virial radius of stacked galaxies. |
 |
Fig. B.2. The X-ray surface brightness profile of galaxies in M31-mass bin of FULLspec sample and the profiles after splitting FULLspec sample to central (CEN) or satellite (SAT) galaxies for star-forming and quiescent galaxies. We scale the observed surface brightness profiles of CEN and SAT according to the number ratio of galaxies, namely, fSAT = Ng, SAT/Ng, FULLspec and fCEN = Ng, CEN/Ng, FULLspec. The vertical dash-dotted line denotes the average virial radius of M31-mass galaxies in the FULLspec sample. |
We compare the X-ray surface brightness profiles of central star-forming and quiescent galaxies without masking X-ray sources in Fig. B.1. The PSF of eROSITA at the physical scale is overplotted in a dotted line. We find the X-ray surface brightness profile of star-forming galaxies is consistent with the PSF and shows weak excess, while the quiescent galaxies host significant extended X-ray emission. Without introducing the uncertainty of X-ray source masking and unresolved X-ray sources modeling, the more extended X-ray emission around quiescent galaxies supports our result in Sect. 3.1.
We discuss in Paper I how the satellite boost biases the central galaxy’ X-ray surface brightness profile by stacking the X-ray emission around central (CEN) and satellite (SAT) galaxies and rescaling the profile by the galaxy number fraction, respectively. Here, we repeat the calculation in Paper I for star-forming and quiescent galaxies, respectively. The comparison of the X-ray surface brightness profiles of FULLspec (including CEN and SAT), CEN, and SAT sample and the rescaled profiles are plotted in Fig. B.2, taking the M31-mass bin as an example. As expected, galaxies with the same M* but classified as satellites or centrals have different X-ray surface brightness profiles. The satellite galaxy, residing in a more massive dark matter halo, has its X-ray emission boosted by the emission from virialized gas of the larger halo they reside in, from nearby centrals and other satellite galaxies. Consequently, the satellite galaxies’ X-ray surface brightness profile appears to be more extended and brighter than that of the central. We find star-forming galaxies suffer less satellite boost bias, as its satellite fraction is low and less extended X-ray emission around it.
All Tables
Best-fit parameters in the β model for the CGM X-ray surface brightness profiles for the central star-forming and quiescent galaxies.
Rest-frame X-ray luminosity in the 0.5–2 keV band within R500c in erg s−1 of different components for CEN and CENhalo samples.
Percentage and number of galaxies hosting AGN in CEN and CENhalo samples, identified using the BPT diagram (Baldwin et al. 1981; Brinchmann et al. 2004).
All Figures
|
Fig. 1. Median M200 m and median M* of galaxies with the 16 − 84% scatter for each mass bin in the CENhalo, SF (blue band), CENhalo, QU (red band), CENSF (green crosses), and CENQU (orange cross) samples. |
| In the text | |
|
Fig. 2. X-ray surface brightness profiles of the hot CGM of the central star-forming (SX, CGM, SF, blue) and quiescent (SX, CGM, QU, red) galaxies with M* ∈ 10.5 − 11.0, 11.0 − 11.25 and 11.25 − 11.5 (top left, top right, and bottom left). The vertical dash-dotted (dotted) lines denote the average R500c (Rvir) of stacked central galaxies. The median redshift ( |
| In the text | |
|
Fig. 3. X-ray surface brightness profiles of the hot CGM of the central star-forming (SX, CGM, SF, blue) and quiescent (SX, CGM, QU, red) galaxies with M200 m ∈ 12.0 − 12.5, 12.5 − 13.0 and 13.0 − 13.5 (top left, top right, and bottom left). The vertical dash-dotted lines denote the average R500c and Rvir of stacked galaxies. The median redshift ( |
| In the text | |
|
Fig. 4. Comparison of M500c − M* relations of central star-forming (top) and quiescent (bottom) galaxies in the catalogs of Tinker (2021) and Yang et al. (2007), and EAGLE, TNG100, and SIMBA simulations. The shadow area denotes the 16–84% scatter of the relation. Yang et al. (2007) only includes galaxy groups with log(M500c) > 11.5 and causes the turnover of the quiescent SHMR at low mass end. |
| In the text | |
|
Fig. 5. Observed hot CGM X-ray luminosity of central star-forming galaxies (LX, CGM, SF, blue) and quiescent galaxies (LX, CGM, QU, red) selected from Yang et al. (2007), compared to the derived LX, CGM, SF or LX, CGM, QU by convolving the observed LX, CGM − M* with SHMR in Yang et al. (2007). The shadow area is the uncertainty from SHMR. |
| In the text | |
|
Fig. 6. Observed LX, CGM, SF − M* (blue) and LX, CGM, QU − M* (red) scaling relations, compared to the derived ones by convolving LX, CGM − M500c with the SHMR in Tinker (2021). |
| In the text | |
|
Fig. 7. Comparison of the observed LX, CGM − M* relation to the predictions from the EAGLE, TNG100, and SIMBA simulations with 1σ uncertainties, for star-forming (top left) and quiescent (top right) galaxies. Comparison of the observed LX, CGM − M500c relation to the predictions from the EAGLE, TNG100, and SIMBA simulations with 1σ uncertainties, for star-forming (bottom left) and quiescent (bottom right) galaxies. |
| In the text | |
|
Fig. 8. Comparison of the LX, CGM − M* relations of star-forming and quiescent galaxies selected by the 4000 Å break or sSFR. |
| In the text | |
|
Fig. 9. X-ray luminosity within 300 kpc, without masking extended X-ray sources, for quiescent (top left) and star-forming (bottom left) central galaxies, and central and satellite galaxies together, compared to Comparat et al. (2022). Also shown are the satellite fractions to explain the bright LX of quiescent galaxies Comparat et al. (2022). X-ray luminosity within 10–100 kpc, after masking all X-ray sources and subtracting XRB emission, for quiescent (top right) and star-forming (bottom right) central galaxies, central and satellite galaxies together, compared to Chadayammuri et al. (2022). Also shown is the LX, CGM of central star-forming galaxies selected in eFEDS sky area and galaxies with star companion. |
| In the text | |
|
Fig. A.1. Top: the model predicted XRB luminosity (band) and the modeled X-ray luminosity of unresolved AGN (data points) for star-forming (blue) and quiescent (red) galaxies in the CEN sampley. Bottom: Similar to the top panel but for the CENhalo sample. |
| In the text | |
|
Fig. B.1. The X-ray surface brightness profiles of central star-forming (SX, mask, SF, blue) and quiescent (SX, mask, QU, red) galaxies in CEN sample without masking X-ray sources. The vertical dash-dotted line denotes the average virial radius of stacked galaxies. |
| In the text | |
|
Fig. B.2. The X-ray surface brightness profile of galaxies in M31-mass bin of FULLspec sample and the profiles after splitting FULLspec sample to central (CEN) or satellite (SAT) galaxies for star-forming and quiescent galaxies. We scale the observed surface brightness profiles of CEN and SAT according to the number ratio of galaxies, namely, fSAT = Ng, SAT/Ng, FULLspec and fCEN = Ng, CEN/Ng, FULLspec. The vertical dash-dotted line denotes the average virial radius of M31-mass galaxies in the FULLspec sample. |
| In the text | |
Current usage metrics show cumulative count of Article Views (full-text article views including HTML views, PDF and ePub downloads, according to the available data) and Abstracts Views on Vision4Press platform.
Data correspond to usage on the plateform after 2015. The current usage metrics is available 48-96 hours after online publication and is updated daily on week days.
Initial download of the metrics may take a while.