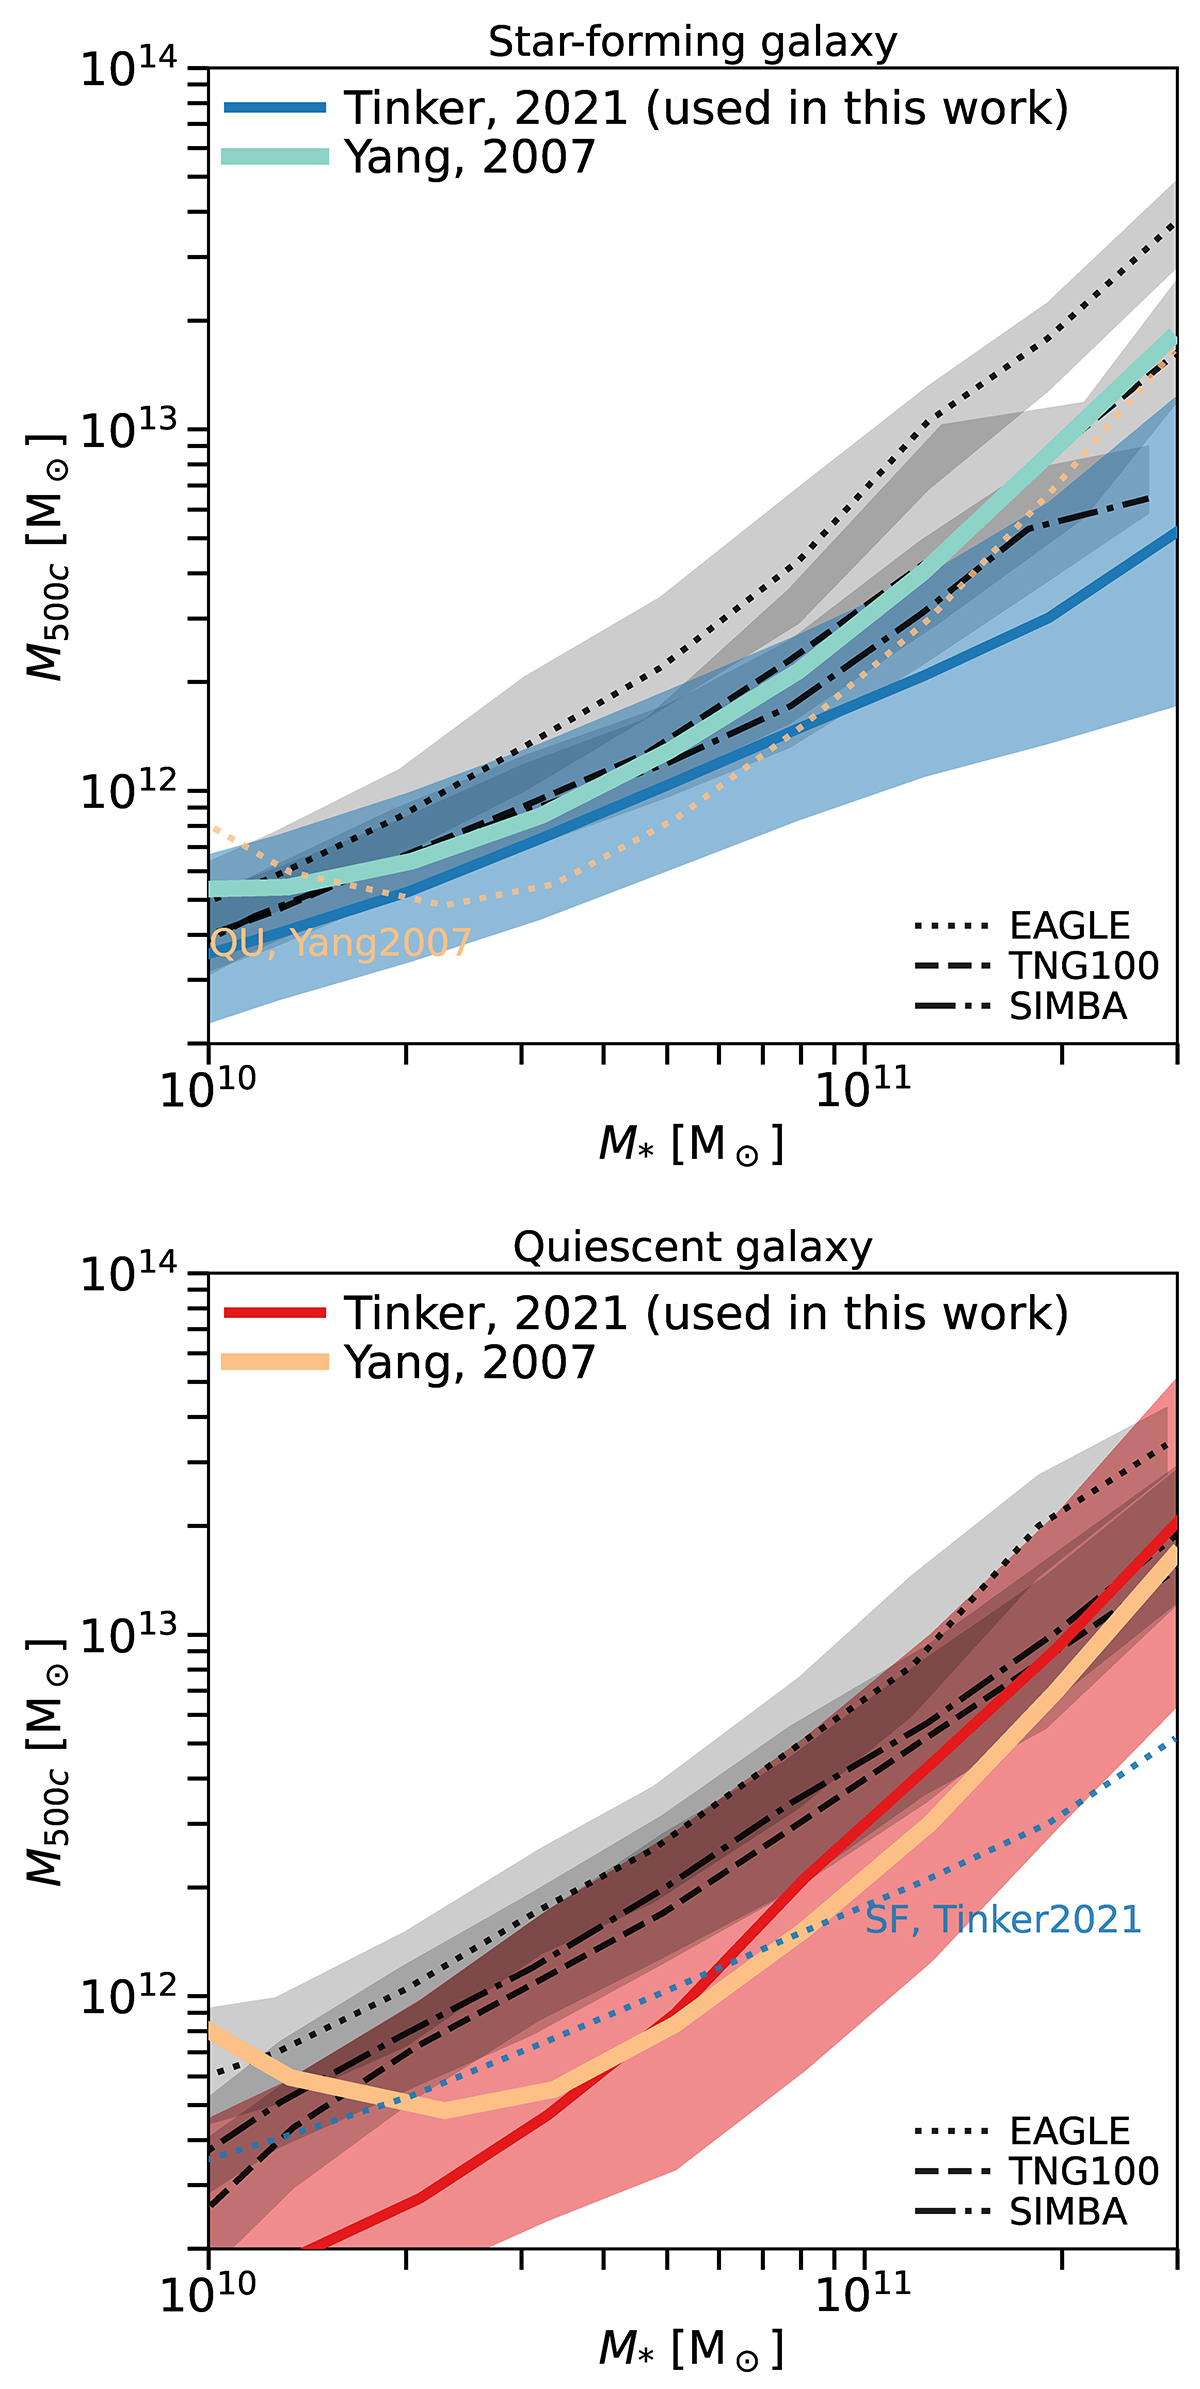
Fig. 4.
Download original image
Comparison of M500c − M* relations of central star-forming (top) and quiescent (bottom) galaxies in the catalogs of Tinker (2021) and Yang et al. (2007), and EAGLE, TNG100, and SIMBA simulations. The shadow area denotes the 16–84% scatter of the relation. Yang et al. (2007) only includes galaxy groups with log(M500c) > 11.5 and causes the turnover of the quiescent SHMR at low mass end.
Current usage metrics show cumulative count of Article Views (full-text article views including HTML views, PDF and ePub downloads, according to the available data) and Abstracts Views on Vision4Press platform.
Data correspond to usage on the plateform after 2015. The current usage metrics is available 48-96 hours after online publication and is updated daily on week days.
Initial download of the metrics may take a while.