Fig. 2.
Download original image
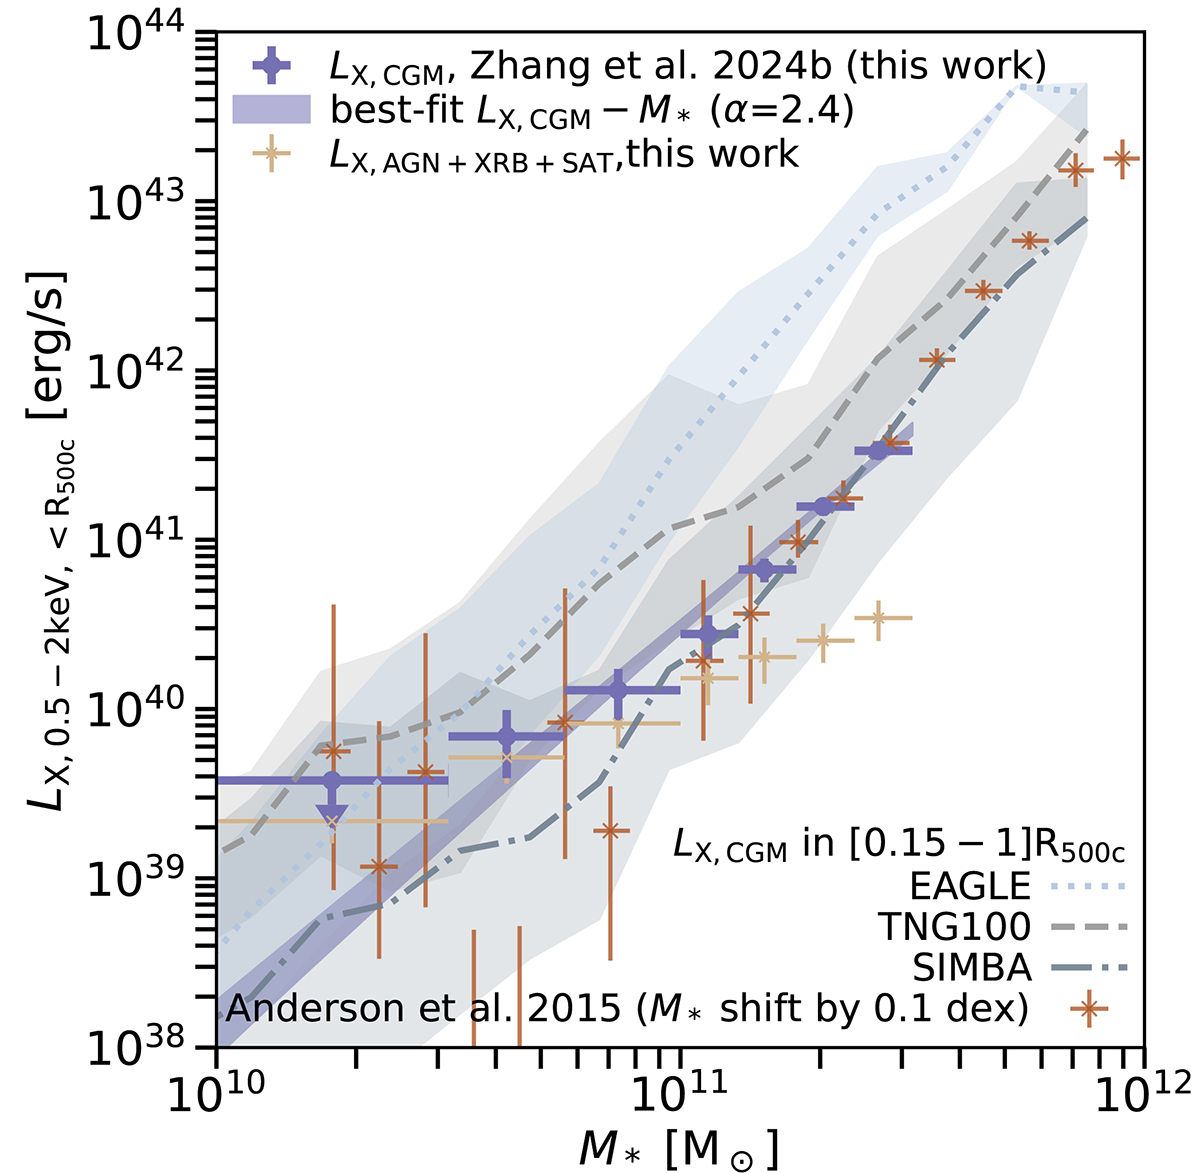
X-ray luminosity vs. stellar mass. The hot CGM X-ray luminosity (LX, CGM) measured around the central galaxies (CEN sample) within R500c in 0.5 − 2 keV as a function of the M* is shown in purple. The purple band displays the best-fit single power law model and its 1σ uncertainty. The modeled X-ray luminosity from unresolved AGN, XRB (LX, AGN + XRB + SAT) is depicted in tan. The LX, CGM − M* measurements from Anderson et al. (2015) are plotted with thin brown crosses, notice the M* is shifted by 0.1 dex to higher mass to account for the difference in M* estimation between Anderson et al. (2015) and this work. The prediction from the EAGLE, TNG100 and SIMBA simulations compiled following the methodology of Truong et al. (2023) are overplotted with 1σ uncertainties.
Current usage metrics show cumulative count of Article Views (full-text article views including HTML views, PDF and ePub downloads, according to the available data) and Abstracts Views on Vision4Press platform.
Data correspond to usage on the plateform after 2015. The current usage metrics is available 48-96 hours after online publication and is updated daily on week days.
Initial download of the metrics may take a while.